i
A Water Quality Study of the Selangor River, Malaysia
Suriyani Awang
March 2015
Thesis submitted for the Degree of Doctor of Philosophy
School of Environmental Sciences
University of East Anglia
Norwich England
"This copy of the thesis has been supplied on condition that anyone who consults it is understood to recognize that its copyright rests with the author and that use of any information derived there from must be in accordance with current UK Copyright Law. In addition, any quotation or extract must include full attribution.”
i ABSTRACT
Malaysia’s rapid economic and demographic development has put pressures on its water supplies and consequently on the quality of its river water. The Selangor River, close to the nation’s capital, is now a major source of water and there are fears that its water quality will deteriorate. The Malaysian Government in its Vision for Water 2025 states that rivers should achieve Class II as measured by Malaysia’s Water Quality Index (WQI) (Class I is cleanest). The objectives of this thesis are to investigate the effects of flow through the 10 major tidal control gates (TCGs) which regulate run-off from the oil-palm plantations into the river, and to predict the water quality for the river in 2015, 2020 and 2030. In order to achieve these objectives it was necessary to set-up, calibrate and validate a commercial one-dimensional numerical model, InfoWorks, which includes both the hydrodynamics and water quality of the river-estuary network. It was concluded that there was insufficient hydrodynamic (stage and current) and water quality data to fully calibrate and validate the InfoWorks model but it performed well when compared with measured salinity transects. The model was found to be relatively insensitive to the choice of diffusion parameters but needed a high value for the oxygen transfer velocity, 0.3 m h-1, to get reasonable values for the dissolved oxygen (DO) along the river. The effect of run-off through the TCGs was less than expected and attributed to the high oxygen transfer velocity and needs to be addressed before the model can properly represent run-off through the TCGs. The model shows the WQI of the lower reaches of the river to be Class III in both wet and dry seasons except close to the estuary where it is Class II due to tidal flushing. The dissertation identifies several deficiencies in the model; the lack of an operational ramp function at the estuary boundary, the use of a single value of the oxygen transfer velocity throughout, and the exclusion of water extraction. Land-use changes above Rantau Panjang, the upper boundary of the InfoWorks model, and water quality data were used to estimate the water quality and its uncertainties at Rantau Panjang in 2015, 2020 and 2030 due to predicted development in the upper catchment for both wet and dry seasons. InfoWorks models of water quality along the river in 2015, 2020 and 2030, which included extraction at the Batang Berjuntai barrage, predict little change in the WQ (Class II/III boundary) below the barrage during the dry season but a rapid deterioration in the wet season (down to Class III/IV by 2030) showing the importance of water extraction to the water quality of the river. Overall, because of its relative simplicity and ease of operation, InfoWorks is considered to be a useful tool for river management in Malaysia.
ii ACKNOWLEDGEMENT
First of all, my praises and thanks to Almighty Allah, the Most Gracious the Most Merciful, who gave me the knowledge, encouragement and patience to accomplish this research study. May the peace and blessings of Allah be upon our Prophet Mohammad pbuh.
I wish to express my sincere appreciation and millions thanks to my supervisor, Prof. C.E Vincent, for his patience, guidance and kind help. Without his continued support and interest, this thesis would not be completed. His good deeds will always be remembered. Also to another two supervisory team members, Dr. Rosalind Boar and Dr Tony Dolphin for fruitful discussion, ideas and advices.
I am also indebted to the National Hydraulics Research Institute of Malaysia (NAHRIM), Department of Irrigation and Drainage (DID) and the Ministry of Natural Resources and Environment (NRE) especially the officers and staffs (Ir. Hj Juhaimi Jusoh, En Azizi Seman, En. Sadiq Kasmani, En Syaiful Bahren and the technicians) who gave their support when I did the field work and getting the data and related information. I also need to take this opportunity to say many thanks to Haji Abdul Jalil Hassan and HR Asia Wallingford software team for their guidance, advice and knowledge in software technical supports. Last but not least to my beloved husband, M. Idrus Said and my gorgeous sons, M. Amir Irfan and M. Azim Imtiaz for continual support and unconditional love. Also to my family members and friends who have directly or indirectly helped and contributed to the success of this study.
iii TABLE OF CONTENTS
ABSTRACT i
ACKNOWLEDGEMENT ii
TABLE OF CONTENTS iii
LIST OF TABLES vii
LIST OF FIGURES x
LIST OF SYMBOLS/TERMINOLOGY xvi
CHAPTER 1 INTRODUCTION
1.0The demand for water in Malaysia 1.1 Malaysian vision for Water 2025
1.2 River water quality management in Malaysia 1.2.1 Organisation and legislation 1.2.2 National water quality standards 1.3 The importance of this study
1.4 Research objectives 1.5 Thesis structures 1 1 6 6 6 9 10 11 12
CHAPTER 2 WATER QUALITY MANAGEMENT AND
MODELLING 2.0 Introduction
2.1 Water quality management and modelling in Europe
2.2 Water quality management and modelling in the US
2.3 Water quality management and modelling in the Southeast Asia
2.4 Water quality management and modelling in Malaysia
2.5 The integrated River Basin Management (IRBM) concept
2.6 Water quality and management in the Selangor River basin 2.7 Summary 14 14 14 16 17 19 20 21 24 CHAPTER 3 MODEL DESCRIPTION
3.0 Introduction
3.1 The Hydrodynamic Model
3.1.1 Hydrodynamic Equations 3.2 Water Quality
3.2.1 Advection-Diffusion Equation 3.2.2 Dissolved Oxygen Module
25 25 26 27 28 29 30
iv 3.2.2.1 Dissolved Oxygen
3.2.2.2 Re-aeration
3.2.2.3 Biochemical Oxygen Demand 3.2.2.4 Chemical Oxygen Demand 3.2.2.5 COD or BOD?
3.2.2.6 Ammoniacal Nitrogen 3.2.2.7 Denitrification
3.3 The Malaysian Water Quality Index (WQI) 3.4 Setting up the river model
3.4.1 River cross sections
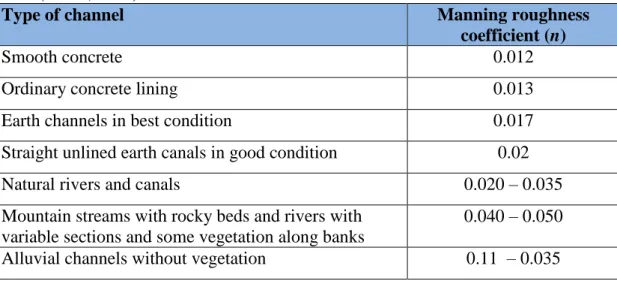
3.4.2 Manning’s Roughness Coefficient, n
3.4.3 Tidal Control Gates 3.5 Summary 31 31 32 34 34 35 35 37 39 39 42 42 49 CHAPTER 4 DATA COLLECTION AND PREPARATION FOR
MODELLING OF THE SELANGOR RIVER 4.0 Introduction
4.1 Description of study area 4.1.1 Location 4.1.2 Climate
4.1.3 The Selangor river system and its characteristics
4.1.4 Soil 4.1.5 Land-use
4.1.6 Human activities by the coast and their impact
4.1.7 River pollution 4.2 River hydraulic Data
4.2.1 Bathymetric (river cross section) data 4.2.2 Tidal data
4.3 River Flow Data at Rantau Panjang 4.3.1 Discharge Measurement 4.3.2 Stage-Discharge Relationship 4.4 Tidal control gates
4.4.1 Water levels behind the TCGs 4.4.2 Canal dimensions and lengths 4.5 Water Quality Data
4.5.1 DOE sampling stations
4.5.2 NAHRIM sampling campaigns 4.5.3 Quality assurance analysis 4.6 Run-off through the tidal control gates
4.6.1 Estimating net flow using a Simple Water Balance Model
4.6.2 Run-off from sub-catchments 4.6.3 Run-off coefficient 4.7 Rainfall data 4.8 Summary 50 50 50 50 51 51 52 54 57 57 59 59 59 62 64 66 68 73 74 75 75 76 79 80 80 80 81 82 85
v
CHAPTER 5 MODEL BOUNDARY CONDITIONS AND
CALIBRATION 5.0 Introduction
5.1 Boundary conditions
5.1.1 Hydrodynamic boundary conditions 5.1.2 Water quality boundary conditions 5.2 Hydrodynamic model set-up and calibration
5.2.1 How good is the hydrodynamic model? – Model evaluation
5.2.2 Initial tidal stage set-up
5.2.3 Manning’s Roughness coefficient, n
5.3 Calibration of the mixing processes 5.4 Ramp function
5.5 Wet and dry seasons
5.6 Summary 87 87 87 87 88 92 92 93 95 96 97 103 104 CHAPTER 6 PRESENT WATER QUALITY: ANALYSIS AND
DISCUSSION 6.0 Introduction
6.1 Calibrating and validating re-aeration in the InfoWorks Water Quality model against measurements
6.2 Variation in WQI along the Selangor River 6.2.1 Dry season (May-July) water quality 6.2.2 Wet season (Oct-Dec) water quality 6.3 Impact of run-off from TCGs on the Selangor
River water quality
6.4 7Q10 – Low flow analysis 6.5 Summary 105 105 106 110 112 116 119 122 125 CHAPTER 7 PREDICTION OF FUTURE WATER QUALITY: 2015,
2020 and 2030 7.0 Introduction
7.1 Land-use and land-use changes
7.2 Estimation of water quality parameters
7.2.1 Estimating water quality at Rantau Panjang in 2015, 2020 and 2030
7.3 Uncertainties in the water quality calculations 7.4 WQI of the Selangor River in 2015, 2020 and
2030
7.4.1 Water abstraction
7.4.2 Water quality along the Selangor River
7.4.2.1 Predicted WQI for 2015 7.4.2.2 Predicted WQI for 2020 7.4.2.3 Predicted WQI for 2030 7.5 Summary 127 127 128 136 137 140 141 141 141 145 145 145 146
vi CHAPTER 8 DISCUSSION OF RESULTS
8.0 Introduction
8.1 Limitation of the InfoWorks hydrodynamic model for the Selangor River
8.2 Prediction of present water quality 8.3 Effects of run-off through the TCGs
8.4 Prediction of water quality in 2015, 2020 and 2030
8.5 Impacts on the Selangor River fire fly colonies 8.6 The need for further work
148 148 148 150 151 154 156 157 CHAPTER 9 CONCLUSIONS 9.0 Introduction
9.1 The InfoWorks Hydrodynamic Model 9.2 The InfoWorks Water Quality Model 9.3 Prediction of Present water quality 9.4 Prediction of future water quality 9.5 Effects on the fire flies
9.6 Overall conclusions of this study
159 159 160 160 160 161 162 162 REFERENCES 164 APPENDIX A 182 APPENDIX B 183
vii LIST OF TABLES
TABLE 1-1 Water-related department and agencies 8 TABLE 1-2 Water Classes and their uses (National Water Quality Standards,
NWQS)
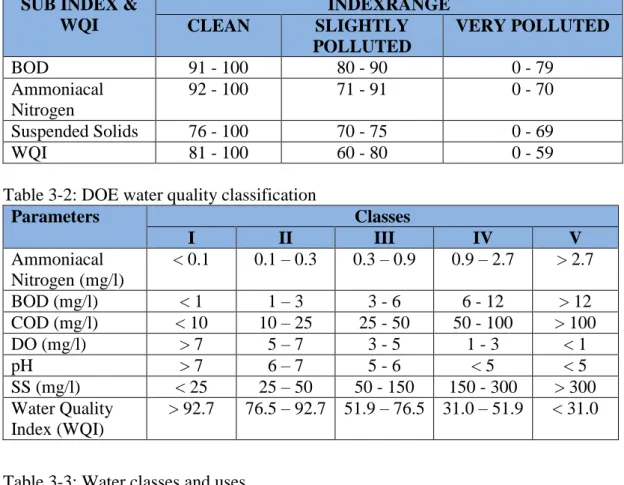
10 TABLE 3-1 Water quality based on DOE Water Quality Index 38
TABLE 3-2 DOE water quality classification 38
TABLE 3-3 Water classes and uses 38
TABLE 3-4 Values of the Manning roughness coefficient, n for various channels and rivers (Chow, 1964)
42
TABLE 3-5 Gate setting-up data; All gates remain closed, (irrespective of water levels) for the first 6 hours of model operation (starts with gate closed manually for first 6 hours) followed by gate operating (opening and closing) automatically after 6.00 am in the morning every day
43
TABLE 3-6 The two logical rules used for the TCGs. Rule 1: when the water level at the upstream node of gate (HEAD_upstream) is more than 0.4 m greater than the water level at downstream node (HEAD_downstream), the gate will be moved up 0.05 m. Rule 2: when the water level at the upstream node of gate is less than 0.4 m greater than the water level at downstream node, the gate will be moved down 0.05 m
44
TABLE 3-7 The possible modes (states) of the gate (from InfoWorksTM Manual)
45
TABLE 4-1 Land use change in the basin for 1990 and 1997 (source: Department of Agriculture, 2001)
55
TABLE 4-2 Projection of land development in the lower Selangor River basin, 2005 – 2015 (Local Planning for Kuala Selangor District 2015 Report, 2007)
57
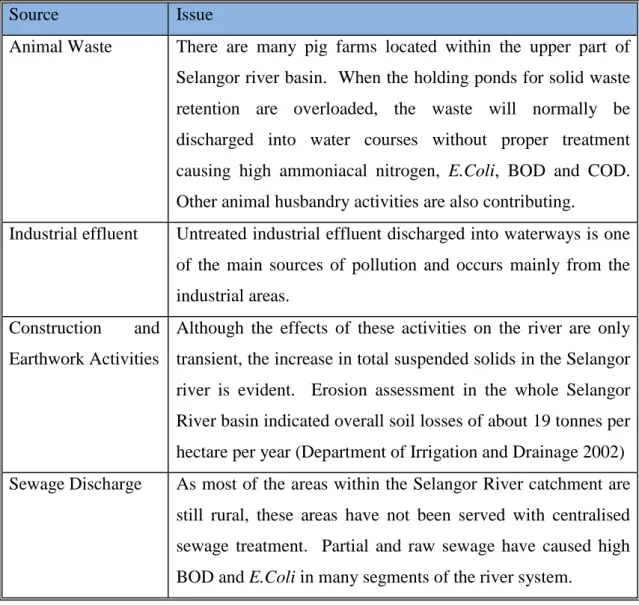
TABLE 4-3 The pollution sources in the Selangor River Basin and the main issues associated with each (Department of Irrigation and Drainage, 2002)
58
TABLE 4-4 The seven largest harmonic constituents for Selangor River estuary from measured water levels Kampung Pasir Penambang (km 5) for the period of 32 days (15 November to 16 December 2007)
viii TABLE 4-5 Summary of daily river flow for the period of ten years (2000 to
2009) at Rantau Panjang in the Selangor River, Malaysia
67
TABLE 4-6 The tidal control gates, with their ID numbers and names, used in the model together with their locations, distances from the river and crest elevations
70
TABLE 4-7 The lengths and widths (± 2.5 m) of the major drainage features in the areas drained by each TCG
75
TABLE 4-8 Locations of sampling stations in study area 77 TABLE 4-9 Summary of Methods used for analysis of physical, chemical and
microbial parameters
77
TABLE 4-10 Runoff coefficient of different type of catchment (Urban Drainage and Flood Control District, 2010)
83
TABLE 4-11 The drainage area of TCG 84
TABLE 4-12 Rainfall stations 84
TABLE 5-1 The boundary concentrations for the water quality components 89 TABLE 5-2 Values of major coefficients used in Selangor River water quality
model
90
TABLE 5-3 Error classification and categorisation of results of model performance as suggested by Sutherland, et al. (2004a)
93
TABLE 5-4 The initial amplitudes of the Tidal Harmonic Constituents used in the hydrodynamic model
94
TABLE 5-5 Mean, Standard Deviation and Number of Observations of the WQI at Rantau Panjang for 1997-2008, for wet and dry seasons, together with the t and P-values to test the difference between the means of the wet and dry seasons
103
TABLE 6-1 Typical values of the re-aeration rate constant, at 20oC, for temperate water bodies (Peavy et al., 1985, p.87)
108
TABLE 6-2 The average and standard deviation (in brackets) measured and modelled DO for every 3 hours on 25 – 26 Nov 2007 (wet season) at three sampling stations
110
TABLE 6-3 The average daily flow for the wet and dry months at Rantau Panjang, and rainfall at RF1 (see text for full explanation), compared with the average flow and rainfall for the wet and dry season periods used in the model. Note the anomalously high
ix flow and rainfall in the 2010 dry season
TABLE 6-4 Mean annual flow rate (m3s-1) of lowest flow in seven consecutive Days for the period of 15 years (1995 to 2009) at Rantau Panjang on the Selangor River, Malaysia
123
TABLE 7-1 Rates of change of land-use changes over 32 years period (1966 – 1997). Data source: Dept. of Agriculture, 2001 (unpublished data)
129
TABLE 7-2 Land-use reclassification and its components 129 TABLE 7-3 Land-use areas from Figures 7-1a to 7-1d for 1997, 2005, 2008
and 2015. 2% errors assumed
134
TABLE 7-4 Land-use areas for calculated for 2015, 2020 and 2030 from the trend lines shown in Figure 7-2, Figure 7-3 and Figure 7-4. Uncertainties of ±4% are assumed
135
TABLE 7-5 Water Quality parameters for 1997, 2005, 2008 from Rantau Panjang
136 TABLE 7-6 Land-use changes over 1998-2015 (this study). Also shown are
changes over the previous 32 year-period 1966–1997 (Department of Agriculture, 2001)
138
TABLE 7-7 K values for the Urban, Agriculture and Forest land-use types for each of the six water quality parameters of the WQI
138 TABLE 7-8 Concentration of water quality parameters projected to enter the
Selangor River at Rantau Panjang for 2015, 2020 and 2030. See text for explanation of red values
139
TABLE 7-9 Average value of WQI (and WQI Class) for the stretch of the Selangor River between km 15 and km 40. [Note that 2009/10 data are not directly comparable due to omission of water extraction]
x LIST OF FIGURES
FIGURE 1-1 The river basins in Selangor state (source: LUAS, 2010) 3 FIGURE 1-2 Water quality management structure in Malaysia. In 2009 the
Ministry in charge of water supply became the Ministry of Energy, Green Technology and Water (KeTTHA)
7
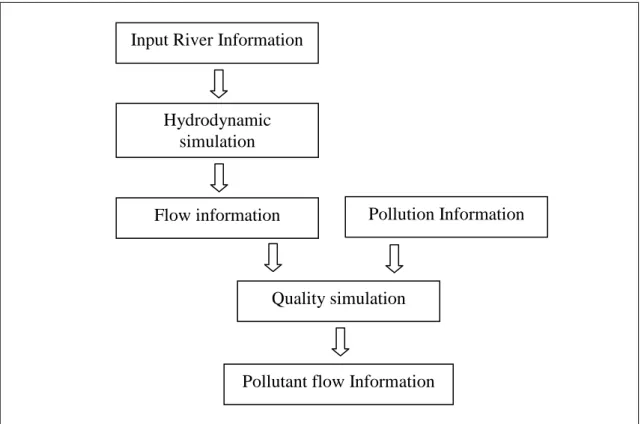
FIGURE 3-1 The work-flow diagram of the HR InfoWorksTM river simulation and water quality model
26
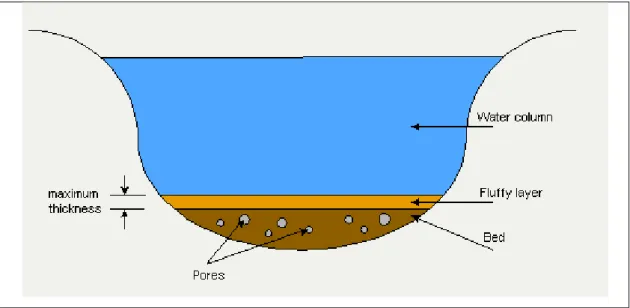
FIGURE 3-2 Vertical structure of the water quality component of the InfoWorksTM RS model
28
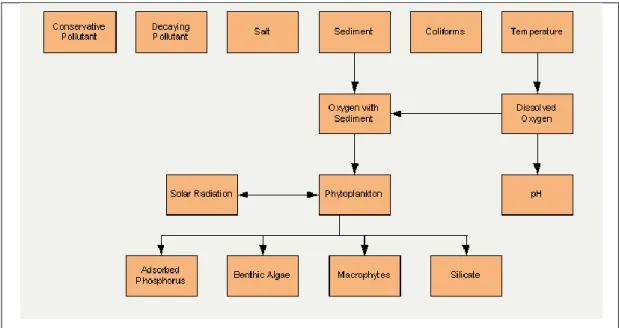
FIGURE 3-3 Components and inter-dependency of processes and variables included in InfoWorksTM Water Quality
29
FIGURE 3-4 A diagram illustrating four of the cross-sectional surveys used in the model. Cross-sections are from (a) the river mouth (km 0), (b) from km 7, (c) from km 20 and (d) from the upper boundary at Rantau Panjang at km 57. Scales are in metres. The two blue horizontal lines show the maximum and minimum water level reached due to tidal forcing
41
FIGURE 3-5 A schematic of the gate parameters used in the InfoWorksTM manual (from Harrison 1967) which have been used in this model for the Tidal Control Gates
44
FIGURE 4-1 The location of Selangor River basin on the west coast of Malaysia (left panel) and the division of the basin into an upper and lower catchment (right panel)
53
FIGURE 4-2 Soil type classification in Selangor River basin. Alluvial soil (Telemong-Akob-Local Alluvium) (A & C); sedimentary soil (Serdang-Kedah, Serdang-Bungo Munchong, steepland, Munchong-Seremban and Renggam-Jerangau) (B); Clay (Kranjiand Selangor-Kankong) (D); mined land (MLD); urban land (ULD) and water (W) from Hamzah et al. (2007)
54
FIGURE 4-3 Land use in 1990 (upper panel) and 1997 (lower panel). (Source: Department of Agriculture, 2001)
56
FIGURE 4-4 Location of tidal stage measurement at Kampung Pasir Penambang (km 5), Selangor River
60
FIGURE 4-5 Tidal stage at Kampung Pasir Penambang (km 5), Selangor River from 15 November to 16 December 2007.
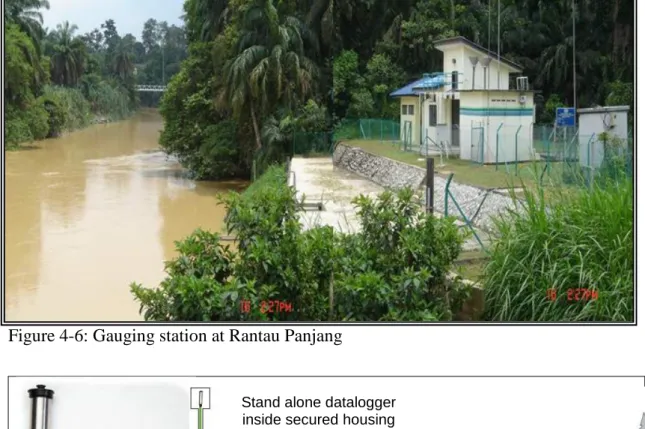
xi FIGURE 4-6 Gauging station at Rantau Panjang 63 FIGURE 4-7 Submersible pressure sensor (left panel), shown here with
external stand-alone data logger for water level measurement.
63
FIGURE 4-8 Submersible pressure sensor and stilling pipe before (left panel) and after (right panel) cleaning
64
FIGURE 4-9 Cross sectional survey for Selangor River at Rantau Panjang 7 Dec 1983
65
FIGURE 4-10 Typical cableway installation drawing (upper panel); cableway with weight attached for deployment
66
FIGURE 4-11 Stage Discharge Curve – Arithmetic Plot (left) and Stage Discharge Curve – Logarithmic Plot (right). Source: DID Manual
67
FIGURE 4-12 Map of lower reaches of the Selangor river showing the location of the sampling stations including the 10 TCGs used in the model, and the location of the rainfall stations (RF1-RF7). Also shown in the location of Rantau Panjang (SS57)
69
FIGURE 4-13a Teluk Penyamun tidal control gate, (TCG 3) looking from upstream of the gate (upper panel) and the typical tidal control gate dimensions from upstream elevation (lower panel). Gate width, gate length and upstream crest length are also shown
71
FIGURE 4-13b Teluk Penyamun tidal control gate (TCG 3); looking from downstream of the gate (upper panel) and the typical tidal control gate dimensions from upstream elevation (lower panel). Downstream crest length is shown by the red arrow
72
FIGURE 4-14 Gate geometry and dimension applied in the model. Diagram (not to scale) adapted and modified from the InfoWorks Manual
73
FIGURE 4-15 Measurement tape used to determine the water level upstream of the gate (left panel) and existing gauge board at the downstream of the gate (right panel)
74
FIGURE 4-16 YSI 6600 multi-parameter water quality sensor (left) and field laptop (right)
78
FIGURE 4-17 Water samples in the cool box (left) and Van Dorn water sampler for the lab samples collection (right)
78
FIGURE 4-18 Average monthly rainfall for one station (RF1) over the period 2000 to 2009, with maximum (green) and minimum (red) monthly values
85
xii log transformed) for all streams in the Selangor River
FIGURE 5-2 Comparison of stage between the modelled and measured values of 31 days period for hydrodynamic calibration (for clarity only 10 days are shown) at km 5 (location of the tide gauge)
94
FIGURE 5-3 Correlation of measured and predicted water level at km 34 over the two-week period between 15 - 27 November 2005 with Manning Roughness, n =0.03
95
FIGURE 5-4 Measured and predicted salinity around low water during spring tide on 11 June 2009 (landward transect – upper panel; seaward transect – lower panel) with default Do (10 m2s-1) with values of D1 from 0.1 to 50
98
FIGURE 5-5 Measured and predicted salinity at high water during spring tide on 11 June 2009 (landward transect – upper panel; seaward transect – lower panel) with default D0 (10 m2s-1) but different values of D1
99
FIGURE 5-6 Measured and predicted salinity at low water during spring tide on 11 June 2009 (landward transect – upper panel; seaward transect – lower panel) with default D1 (10 m2s-1) but different values of D0
100
FIGURE 5-7 Measured and predicted salinity at low water during spring tide on 11 June 2009 (landward transect – upper panel; seaward transect – lower panel) with default D1 (10 m2s-1) but different values of D0
101
FIGURE 5-8 Correlation of measured and predicted salinity at low and high water during spring tide on 11 June 2009 (landward transect - upper panel; seaward transect – lower panel) with D0 = 10 m2s
-1
and D1= 10 m2s-1
102
FIGURE 6-1 The oxygen-sag curve in a river showing the initial decay of dissolved oxygen under pollutant loading and subsequent recovery by re-aeration. (Figure adapted from Ji, 2008)
107
FIGURE 6-2 Comparison between modelled Sub-Index for DO (SIDO, dashed-type lines) with different values of the rate constant (where K in this diagram is fair(20) and the measured data (solid
line) at km 10, km 25 and km 50 on 25 – 26 November 2007
109
FIGURE 6-3 Comparison of model results at km 25 in June 2008. The blue circles represented the measured data; the red solid line gave the model results
xiii FIGURE 6-4 Dry Season daily river flow (m3 s-1) at Rantau Panjang (blue) and
daily rainfall (mm) at one of rainfall stations, Ladang Bukit Belimbing (black)
112
FIGURE 6-5 The tidal stage at the estuary mouth used to force the model (blue line) and the WQI (black line) used for the estuary water. The black dashed lines show one standard deviation WQI from the measured data
113
FIGURE 6-6 Dry Season water quality index as a function of distance down the river. The black lines (mean – solid, dashed +/- 1 standard deviation) are the average values over 3 days of spring tides. The blue lines (mean – solid, dashed +/- 1 standard deviation) are the average values over 3 days of neap tides
114
FIGURE 6-7 Water quality sub-indices along the river averaged over 3 days of Spring tides. A high value of the sub-index contributes to an improvement in the overall WQI
115
FIGURE 6-8 Wet Season daily river flow (m3s-1) at Rantau Panjang (blue line) and daily rainfall (mm) at one of rainfall stations, Ladang Bukit Belimbing (black line)
116
FIGURE 6-9 Wet Season water quality index as a function of distance up the river. The black lines (mean – solid, dashed ±1 standard deviation) are the average values over 3 days of spring tides. The blue lines (mean – solid, dashed ±1 standard deviation) are the average values over 3 days of neap tides
117
FIGURE 6-10 Wet season water quality sub-indices along the river, averaged over 3 days of spring tides
118
FIGURE 6-11 Dry season WQI, spring tide (black), neap tide (blue) with standard deviations (dotted line) when the TCGs are kept CLOSED (top), together with TCGs operating normally (bottom) (repeat of Figure 6-6)
120
FIGURE 6-12 The water quality index (black) of the river water close to the TCG at km 7 during the dry season over a 4-day spring tide period. The state of the TCG (its mode of operation) is also shown (blue). Mode 1-3 – Gate closed; Modes 4-7 Gate open with various flow characteristics (see Table 3-7 in Section 3.4.3)
121
FIGURE 6-13 Low flow frequency 7Q10 at Rantau Panjang (km 57), Selangor River, Malaysia for the period of 15 years (1995 to 2009)
123
FIGURE 6-14 WQI and class in the river stretch at very low flow (3.5 m3s-1). Black line is WQI during spring tide with standard deviation (dotted line); blue line is WQI during neap tide with standard deviation (dotted line)
xiv FIGURE 6-15 Water quality sub-indices along the river averaged over 3 days of
Spring tides. A high value of the sub-index contributes to an improvement in the overall WQI
125
FIGURE 7-1a Land-use map for 1997 for the upper catchment (the area that drains into the Selangor River above Rantau Panjang) reclassified into the four land-use types shown in Table 7-2. The location of Rantau Panjang is shown
130
FIGURE 7-1b Land-use map for 2005 for the upper catchment (the area that drains into the Selangor River above Rantau Panjang) reclassified into the four land-use types shown in Table 7-2. The location of Rantau Panjang is shown
131
FIGURE 7-1c Land-use map for 2008 for the upper catchment (the area that drains into the Selangor River above Rantau Panjang) reclassified into the four land-use types shown in Table 7-2. The location of Rantau Panjang is shown
132
FIGURE 7-1d Map of projected land-use for 2015 for the upper catchment (the area that drains into the Selangor River above Rantau Panjang) reclassified into the four land-use types shown in Table 7-2, taken from the Kuala Selangor Local Planning Report (2006). The location of Rantau Panjang is shown
133
FIGURE 7-2 Agricultural land-use from 1997 to 2015 from GIS and trend line to 2030
134 FIGURE 7-3 Urban land-use between 1997 and 2015 from GIS and trend line
to 2030
135
FIGURE 7-4 Forested area between 1997 and 2015 from GIS and trend line to 2030
135
FIGURE 7-5 WQI for 2015 (black line), 2020 (pink line) and 2030 (blue line) with each standard deviations (dotted lines) during DRY season for spring tide (upper panel) and neap tide (lower panel)
143
FIGURE 7-6 WQI for 2015 (black line), 2020 (yellow line) and 2030 (red line) with each standard deviations (dotted lines) during WET season for spring tide (upper panel) and neap tide (lower panel)
144
FIGURE 7-7 WQI values (black) for Rantau Panjang showing uncertainties from Monte Carlo prediction for DRY and WET (offset by +1year) for 2015, 2020 and 2030. Values for 2009 are measured values of WQI at DOE Rantau Panjang station ±1 standard deviation. Model predictions for the average WQI between km 40 and km 15 are shown (red); the range shown for the red values is the maximum RANGE of WQI due to the Spring-Neap tidal
xv changes
FIGURE 8-1 Nodes for one of the sub-catchment, at Kampong Lubok. The primary canals extend from node KgLubok_u just upstream of the TCG (see brown triangle in green inset) through to KgLubok_u_b where the rainfall is input into the catchment. When the TCG is open water flows down the channel from KgLubok_d to the junction with the river between nodes SS19! and SS19
152
FIGURE 8-2 The DO concentration evolution behind one of the TCGs during model run. The DO is set to 6.0 mg l-1 throughout the catchment at time-zero. The first 14 days are used to ‘spin-up’ the model
xvi LIST OF SYMBOLS/TERMINOLOGY
BOD Biochemical Oxygen Demand
COD Chemical Oxygen Demand
DID Department of Irrigation and Drainage
DO Dissolved Oxygen
DOE Department of Environment
InfoWorks RS InfoWorks River Simulation
IRBM Integrated River Basin Management IWK Indah Water Konsortium Sdn. Bhd.
KeTTHA KementerianTenaga, Teknologi Hijaudan Air (Ministry of Energy, Green Technology and Water)
LUAS Lembaga Urus Air Selangor (Selangor Water Management Authority) NAHRIM National Hydraulic Research Institute of Malaysia
NH3-N Ammoniacal nitrogen
NRE Ministry of Natural Resources and Environment NO2-N Nitrite as nitrogen
NO3-N Nitrate as nitrogen
NWQS National Water Quality Standard
RF Rainfall
TCGs Tidal Control Gates TKN Total Kjeldahl nitrogen
TSS Total Suspended Solids
USACE United States Army Corps of Engineers
1 CHAPTER 1
INTRODUCTION
1 The demand for water in Malaysia
The demand for fresh water is increasing in many parts of the world, primarily as a result of population growth and socio-economic development. The world’s population, currently estimated at 7.2 billion (US Census Bureau, 2010) and growing by some 77 million people each year (United Nations Population Fund, 2003), is projected to increase the demand for freshwater by 64 billion cubic metres a year. Yet 90% of the population growth of the three billion expected by 2050 will be in developing countries, many in regions which already are water-scarce. In Malaysia alone, with an annual growth rate of 2% (Department of Statistics, 2007) the domestic and industrial water demand is expected to increase more than 20% in 50 years (Embassy of Denmark, 2009); the domestic demand will rise from 5.6 million m3 per day in 2000 to 16.2 million m3 in 2050 and the industrial demand from 3.9 million m3 per day in 2000 to 15.5 million m3 per day in 2050 (Embassy of Denmark, 2009).
Most of the water currently used comes from surface water sources. Malaysia at present is highly dependent on the surface water which comes from more than 150 river systems and contributes more than 90% of the total national water supply (Department of Statistics, 2007). As reported by Malaysian Department of Statistics (2007), until 2005 raw water supply in Malaysia as a whole increased at the rate of about 30% (about one billion m3) annually, while Selangor State, which has a population growth rate of about 6% (Department of Statistics, 2001) consumed 576 million m3yr-1 of water for domestic purposes and 261 million m3yr-1 for non-domestic uses. The production capacity is estimated to increase at a faster rate in the future (Department of Statistics, 2007). The increasing water demand which parallels the population growth not only puts pressure on water sources but also results in more sewage discharge and industrial/agricultural contaminants which can finally drain into
2 the river systems. Can the river systems, a major source of water, adequately continue to provide good quality water for the people of Malaysia?
People in Selangor State need clean water. Almost all the four million people in Selangor rely on rivers for their drinking supply. Public water companies draw water from reservoirs on different river intakes of which many are located in northern Selangor. Among the seven major rivers in the Selangor State (Figure 1-1), the Selangor River has nine water intake points and has become the main water source for the State of Selangor, the Klang Valley and Kuala Lumpur, providing 60% of water supply. It supplies two thirds of the industrial and domestic water needs within Selangor and Kuala Lumpur.
Water extraction from the Selangor River began in the 1990’s (Department of Irrigation and Drainage, 2007a) and occurred in three phases. Initially the Sungai Tinggi Dam (reservoir capacity 103 x 106 m3) and a water treatment works with a capacity of 950 million litres per day (11 m3s-1) were constructed; later the water treatment capacity was expanded to 22 m3s-1. Following the construction of the Selangor Dam (reservoir capacity 235 x 106 m3) the total treatment capacity increased to 35 m3s-1 (Department of Irrigation and Drainage, 2007b). The majority of the water extraction takes place at the Batang Berjuntai barrage. In dry years, such as 1990 and 1998, the water extraction capacity can exceed the water yield; when the river flow is low the flow is supplemented with water from the reservoirs, although the flow into the downstream part of the rivers is still significantly diminished.
The demand for the water is continuing to grow and plans have now been made to transport water from the other side of the Titiwangsa mountain range through a 45 km tunnel from Pahang (KeTTHA, 2009) but this will only be sufficient for a few more years. Future projects to satisfy the water demand are at this stage still uncertain.
3 Figure 1-1: The river basins in Selangor State (source: LUAS, 2010)
Much of water flowing into the Selangor River comes from pristine corners of the State. Relatively untouched areas like the highlands area of the upper basin are home to the headwaters of hundreds of brooks and streams that fill aquifers and reservoirs across the state and eventually supply Selangor homes and businessess with valuable water. Pristine rivers also provide recreational opportunities, and important flora and fauna habitats. The upper Selangor River basin provides waterfalls, hot springs and
4 also provides the world-renowned white water rafting, while the downstream areas have a natural wonder, the internationally-known firefly (Pteroptyx tener) colonies with their unique host trees (Sonneratia caseolaris). Part of the estuary is home to a number of large bird species like herons and endangered Milky Storks, as well as primates, namely silver leaf monkeys and macaques.
Unfortunately, Selangor River’s most pristine waterways are becoming polluted. They face contamination from rapidly expanding developments. The quality of river water is often referred to as the ‘pollution condition’ and the ‘health level’ of the waters. Development within the river catchment can effect the water quality of the river systems. Land-use change and human activity have long been understood as the main contributors to many environmental issues including deterioration of river water quality. Hydraulic structures such as dams can block natural stream and river routes and reduce the volume of freshwater to lower reaches of rivers and estuaries. When that happens, the fresh and saltwater balance of the estuary is changed and the estuary can be seriously damaged. Development can damage or even destroy ecosystems. For instance, Yang et al. (2006) found that, with the increased number of dams being contructed in the Yangtze River catchment, the sediment supply to the sea decreased due to more sediment being deposited in reservoirs. As a result, the total growth rate of intertidal wetland in the Yangtze delta decreased from about 12 km2yr-1 in the 1970s to 3.3 km2yr-1 in 1998 (Yang et al., 2006). From data compiled by the Malaysian Department of Environment (DOE) in 2004, the overall trend points to a slow but steady deterioration in the water quality of rivers around Malaysia. Of the 120 rivers monitored, 9 rivers were categorised as ‘highly polluted’ and 53 as ‘slightly polluted’ (Department of Environment, 2005). A large percentage of the highly polluted rivers are located in highly urbanised or industrialised regions on the west coast of Peninsular Malaysia. In 2004 the DOE recorded 17,991 water pollution point sources comprising mainly of sewage treatment plants (54%), followed by manufacturing industries (38%), pig farms (5%) and agro-based industries (3%). Of the total number of effluent sources identified, Selangor State had the second highest number.
5 The Selangor River has experienced substantial changes in water quality. According to an analysis of the water quality for the rivers in Selangor River basin the water in the upper basin, which is surrounded by forest, is generally good but the quality starts deteriorating from Class II (defined by DOE as water ‘requiring conventional treatment’) to Class III (‘extensive treatment required’) in the middle and lower basins due to development pressures arising from converting areas into residential and industrial use (Ranhill Bersekutu Sdn Bhd and Sepakat Setia Consultant Sdn Bhd, 2002). Encroachment into tidal areas especially riparian reserves may become a major threat to sensitive ecosystems like the belt of firefly colonies’ host trees that may spell the demise of the colony if trees are degraded and obliterated. Many people in the past thought tidal inlets or estuaries were ‘waste land’ and many were filled in and built on as pressure for land for growing food or housing increased as population grew. Estuaries are now amongst the most heavily populated areas throughout the world; 22 out of 32 largest cities in the world are located on estuaries (Ross, 1995). The Selangor River estuary is expected to be loaded with more pollutants due to on-going rapid urbanisation from the upper part of the basin and resulting in many environmental problems and conflicting interests of water users.
As the Selangor River catchment is adjacent to that of the Klang River (the Federal Territory of Kuala Lumpur and Putrajaya are situated on the Klang River) the pollution problems that occurred in the Klang River basin are a lesson to ponder. The status of the Klang River now lies between critical and bad (Class V). The Selangor State government had spent about RM50 billion on rehabilitation projects for the Klang River. It is estimated that the entire clean-up and rehabilitation of the 120 km long river will take 15 years to complete. A similar problem is potentially confronting the Selangor River basin which is the next intensive growth centre of the nation after the Klang basin. In the face of rapid growth, the State of Selangor faces the big challenge of accommodating new residents while preserving the natural resources that make Selangor a great place to live, including clean water supplies. The State should protect the water resources it already has while working to clean up waters that have been degraded.
6 1.1 Malaysian Vision for Water 2025
The Malaysian Government has fomulated the Malaysian Vision for Water 2025 as
“In support of Vision 2020 (towards achieving developed nation status), Malaysia will conserve and manage its water resources to ensure adequate and safe water for all (including the environment)” and therefore the implementation of Integrated River Basin Management (IRBM) concept in both the Eighth Malaysian Plan (2001 to 2005) and the Third Outline Perspective Plan (2001 to 2010) was laid out to meet the challenges related to water resources beginning with the three rivers, including the Selangor River. The Ministry of Natural Resources and Environment is determined to increase efforts to ensure that water resources are managed efficiently and effectively for future prospects. Therefore, the water-related departments and agencies under the Ministry such as the National Hydraulics Research Institute of Malaysia (NAHRIM), is strengthening its research into understanding what controls the water quality of rivers and estuaries. One of the strategies is to upgrade the River Basin Decision Support System (RB-DSS), a computerised information system encompassing a number of databases, so that this database can function in an integrated manner in supporting the management of the country’s river basins (Ministry of Natural Resources and Environment, 2005). However, the development of a database by itself will not be sufficient for sound management. There must also be development of good modelling and decision-making tools to aid in making choices and trade-offs. Besides the decision-making rules or guidelines and the procedures for taking action, one of the methods needed is predictive numerical modelling tools.
1.2 River water quality management in Malaysia 1.2.1 Organisation and legislation
The administration and management relating to river water quality in Malaysia currently involves a number of departments and agencies who operate independently of one another according to the specific responsibilities assigned to them. Figure 1-2 shows the organizational arrangement.
7 Figure 1-2: Water quality management structure in Malaysia. In 2009 the Ministry in charge of water supply became the Ministry of Energy, Green Technology and Water (KeTTHA)
The jurisdiction and legislative powers in all aspects of water are distributed between Federal and State Governments in accordance with Legislative Lists of the Federal Constitution. Items enumerated in the Federal List are: hydropower; navigation, maritime fisheries; estuarine fisheries (Peninsular Malaysia); factories, federal works and power including water supplies, rivers and canals except those wholly within one State or regulated by an agreement between States concerned. Items under the State List are: rivers; public nuisances; riverine fisheries and water (including water supplies, rivers and canals if they are wholly within one State). Table 1-1 shows the respective roles of each department/agency. In the past, there has been no single agency, State or Federal level entrusted with overall responsibility for holistic planning and management of water at river basin level. Conflicts involving water resource allocation, flood management, environmental protection, etc. are resolved mainly through ad-hoc inter-agency consultations. Therefore, the establishment of the National Hydraulic Research Institute of Malaysia (NAHRIM) in 1995 was approved
8 during the Cabinet Meeting with the primary objectives to “build a pool of experts and provide research service needed in planning, designing, building and implementing research related to development of water resources in particular and environment in general; and to set up as a National Focal Point that coordinate research on hydraulic engineering in Malaysia” (NAHRIM, 2009). In addition, its function was documented in the “Ministerial Function Act 1969 (Minister of the Federal Government (No. 2) Order 2008) as follows:
i) to conduct basic and applied research in hydraulic engineering, coastal engineering, water resources and water quality for public and private sector;
ii) to provide experts/specialised consultancy services to public and private sectors;
iii) to co-operate with local universities and institutes in hydraulic engineering research;
iv) to function as Government advisor on matters relating to hydraulics, and v) to act as the National centre in hydraulic engineering research and become
the coordinator of all research in the country” (NAHRIM, 2009). Table 1-1: water-related departments and agencies
Function Department/Agency Role
Water supply Department of Irrigation and Drainage
Waterworks Department
Tenaga Nasional Berhad
Irrigation water source development.
Monitoring stream flow and irrigation water supply Water supply source works. Treatment and supply of drinking water. Hydropower source works development. Use of water for hydropower.
Water Pollution Control Department of Environ-ment
Local authorities/Indah Water Consortium
Control of industrial pollutants
Control and treatment of sewage
9 Department of Irrigation
and Drainage
Mineral and Geoscience Department
Control of pollution from irrigation areas
Control of pollutants from mining operations Water Quality Management Department of Environ-ment Fisheries Department Chemistry Department Department of Irrigation and Drainage Monitoring of water quality Prohibition of use of poisoning or destructive methods for fishing Analytical services on water samples monitored Planning, construction and maintenance of drainage works
Watershed Management Forestry Department
Town and Country Planning Department Tenaga
Nasional/Waterworks Department/ Department of Irrigation and Drainage
Protection of forests. Watershed management within forest reserves Land use planning and control
Protection of watershed upstream of reservoirs
1.2.2 National Water Quality Standards
In Malaysia river water quality management systems are monitored and controlled by Malaysian Department of Environment (DOE) which is responsible for providing the river classification standards called National Water Quality Standards (INWQS). Under these standards, there are 22 parameters that define the desired water quality for inland surface waters as listed in Appendix A. Accordingly, a river must meet all criteria of each applicable parameter 100% of the time to maintain its designated classification. The qualitative descriptions of water quality classifications (Table 1-2) are based on a series of qualitative indices and formulae developed by Mustafa (1981) and have been used as the National Quality Index for Malaysia.
10 Table 1-2: Water classes and their uses (National Water quality Standards, NWQS)
CLASS DESCRIPTION
I Conservation of natural environment Water Supply I (practically no treatment necessary), Fishery I (very sensitive aquatic species)
IIA Water Supply II (conventional treatment required), Fishery II (sensitive aquatic species)
IIB Recreational use with body contact
III Water Supply III (extensive treatment required), Fishery III (common, of economic value, and tolerant species livestock drinking)
IV Irrigation
V None of the above
1.3 The importance of this study
Appropriate management strategies are needed to ensure that water supplies are adequate and the water quality is appropriate for the intended use. To evaluate potential management strategies for the basin, a robust computer model capable of simulating a wide variety of complex physical, chemical and biological processes is needed.
In addition to conducting important research into what controls the water quality of the lower reaches of the Selangor river, and making some predictions about the likely effects of industrial and urban developments in the upper reaches of the Selangor river in the next 15-20 years, this study is the one of the first steps in developing a decision support system which will help river authorities all over Malaysia to manage river basins and estuaries and to develop strategies for the management of the river water quality. Therefore, this study will be the foundation for other river basin studies mainly in providing useful information on cause-and-effect relationships in order to anticipate the limit of pollutant loads that can be assimilated by the river system based on Malaysian National Water Quality Standards and the relationship with the changes
11 of development activities in the river basin. It is important that decisions on what to do in one part of a river basin should at least be based on knowledge of consequences for the river system, if not for the whole country.
A wide range of numerical models has been used to assess water quality in Malaysian rivers (Mohamed, 2001; Suliman, 2010) and numerical modelling appears to be useful tool for water quality management. However, the selection of the right model for a given management problem represents a hard task for decision makers: the more accurate and realistic the model, the more expensive is the monitoring programme needed to justify its use, and the more skill and experience that is needed to get the most from the model. The challenge has been to determine the optimal combination of project components that can provide maximum improvement at the best price. This study uses the commercial InfoWorksTM river modelling suite, initially developed by HR Wallingford Ltd.
1.4 Research objectives
The overarching objectives of this thesis are
i) to set-up a one-dimensional hydrodynamic model of the Selangor River and its estuary, and calibrate it against measured data,
ii) to set-up a one-dimensional water quality model that integrates with the hydrodynamic model,
iii) to evaluate the effects of run-off from oil-palm plantations through the Tidal Control Gates (TCGs) on the water quality of the lower reaches of the Selangor River, and
iv) using data and estimates of future land use change, to estimate how severely the water quality of the lower reaches of the Selangor River will be the impacted by urban and industrial developments planned for the upper reaches (above the gauging station at Rantau Panjang) by 2015, 2020 and 2030.
The water quality results from the InfoWorks model simulations were classified quantitatively using Malaysia’s Water Quality Index (WQI), and into five levels of Malaysia’s national water quality class (Table 1-2).
12 1.5 Thesis structure
This thesis is divided into nine chapters.
The first chapter (Chapter 1) provides a general view of the research. The chapter begins with introduction to the topic of the research. This includes an explanation on the emerging water quality issue and the challenges that Malaysia is facing and how important this water quality study is for rivers in Malaysia. The river water quality management in Malaysia is then described, followed by defining the technical and scientific objectives of the research.
Chapter 2 describes some of the different ways that water quality in river basins and estuaries are regulated around the world, some of the numerical modelling tools that are available to assist in the management of river basins, and some of the very many studies that have been conducted around the world. The Chapter begins with Europe and the USA before moving on to tropical water quality modelling and studies in SE Asia. Finally previous experimental and modelling water quality studies in Malaysia and Selangor are described.
In Chapter 3 a description of the InfoWorks™ modelling system is given. The equations in the model and the related water quality parameterisations are presented and discussed. The chapter also describes how the hydrodynamic and hydraulic components of the river model for the Selangor River were set-up, including the river cross-section and the catchments controlled by the tidal control gates.
Chapter 4 focuses on how the data for this study were collected and prepared for modelling of the Selangor River lower basin. This includes the description of the study area, the methodology used for water quality and quality assurance analyses. Primary data were collected during field trips, such as water quality measurements around the tidal control gates and at a number of locations along the river which provide input data and calibration data for the model.
13 Chapter 5 gives a description of the hydrodynamic model calibration which results in a realistic model of the water elevations in the estuary over spring and neap tidal cycles. The hydrodynamic calibration begins with the initial tidal stage set-up and is followed by calibration of the mixing processes using salinity as a conservative tracer.
In Chapter 6, the present water quality in Selangor River is analysed to know what the water quality is likely to be along the river in a typical dry and wet season during both spring and neap tides. Dissolved oxygen (DO) is the parameter used to calibrate and validate the InfoWorks™ water quality module by varying the re-aeration parameter. The impact of run-off of water from the plantations through the tidal control gates (TCGs) on river water quality is examined, and ‘worst case’ scenario (low-flow) analysis is also conducted.
Chapter 7 presents an analysis of the likely water quality in the Selangor River over the short term – 2015, mid-term – 2010 and long term – 2030. A model is constructed which uses GIS land-use maps for 1997, 2005 and 2008 together with concurrent water quality data to estimate the water quality entering the river at Rantau Panjang in 2015, 2020 and 2030 in the wet and dry seasons. A Monte Carlo method is used to estimate the uncertainties in the water quality parameters. The InfoWorks models are run for these scenarios to look at the change in WQI down the river; water extraction at the Batang Berjuntai barrage is also included.
The results of this study are discussed in Chapter 8. This includes a discussion of the findings and experiences from the study, and the limitations of the present research and the InfoWorks™ model and finally suggests further works which are required in in order to obtain reliable results for water quality along the Selangor River and to move towards a fully comprehensive management research tool suitable for this river and other rivers in Malaysia.
Chapter 9 gives a brief summary of the main results of this study and the overall conclusions of this study.
14 CHAPTER 2
WATER QUALITY MANAGEMENT AND MODELLING
2 Introduction
This chapter describes some of the ways that water quality is managed and modelled around the world and previous work that has been conducted, as well as detailing the more local water quality studies in tropical rivers in Southeast Asia that are relevant to the work that has been carried out in this dissertation. Water quality management is important in controlling water pollution and in river basin planning. Cohon (1978) referred to this as a large scale and complicated system, involving three components: the water system (quantity and quality), an economic system (national income and cost of waste water treatment), and a political system (equity and decision making). Water quality standards and regulatory environments differ around the world. There is also a wide variety of numerical models that have been used to simulate and predict water quality in rivers, estuaries and coastal seas. This review concludes with a description of the literature around river water quality management and research in Malaysia and summarises the research into water quality done in Selangor River and other Malaysian rivers and their major findings. A more detailed description of the Malaysian water quality regulation and standards are given in Chapter 1.
2.1 Water quality management and modelling in Europe
In Europe water quality is governed by the European Water Framework Directive (WFD) which looks at 30 measures of the water environment, grouped into a) chemical and b) ecological status; the WFD covers ground-water, lakes, rivers, estuaries and coastal waters. The WFD resulted from demands from European citizens and environmental groups for action to be taken to improve the quality of rivers, lakes and beaches. The WFR was finally adopted in 2000 (European Commission, 2000).
15 The European Commission (2012) gives a complete overview of the evolution of the EU Water Framework Directive. The purpose of the WFD is to establish a framework for the protection of inland surface waters (rivers and lakes), transitional waters (estuaries), coastal waters and groundwater and “ensure that all aquatic ecosystems and, with regard to their water needs, terrestrial ecosystems and wetlands meet 'good status' by 2015” (European Commission, 2000). It does not prescribe the acceptable levels of contaminants or combinations of contaminants but instead requires Member States to establish basin management plans for each river basin district and envisages a cyclical process where river basin management plans are prepared, implemented and reviewed every six years. The four distinct elements to the river basin planning cycle in the WFD are a) characterisation and assessment of impacts on river basin districts, b) environmental monitoring, c) the setting of environmental objectives and d) the design and implementation of the programme of measures needed to achieve them (JNCC, 2010).
There are a variety of models developed in Europe which allow water quality simulations to be made, varying from the 1-D InfoWorks model used in this thesis, to complex 2D and 3-D models such as TELEMAC (Hervouet, 2000), MIKE-21/3 (Geils et al., 2001) and DELFT3D (Roelvink and Van Banning, 1994) which are hydrodynamic models with water quality and flood-plain modules. Until recently these three latter models were only available commercially but recently components have become free-to-download. MIKE11 (DHI, 1998) is the 1-D equivalent of InfoWorks, including a hydrographic simulation engine, and can include hydraulic structures such as weirs, culverts bridges and sluice gates. It has been used extensively around the world including Thailand (Sriwongsitanon et al., 2003) and in the Cameron Highlands, Malaysia (Malakahmad et al, 2008) for a water quality simulation. In the context of the Water Framework Directive, Tsakiris and Alexakris (2012) reviewed and discussed the utility of eight of the more commonly used water quality models.
16 2.2 Water quality management and modelling in the US
In the US the Water and Water Quality Modelling Support Centre, part of the US Environmental Protection Agency (EPA 2013a), provides technical tools to assist States and Local Governments with the implementation of the Clean Water Act. They provide a number of watershed, hydrodynamic and water quality models. The water quality models available are
1. Water Quality Analysis Simulations Program (WASP)
2. River and Stream Water Quality Model (QUAL2K originally QUAL2E) 3. Aquatox
4. 1-Dimensional Riverine Hydrodynamic and Water Quality Model (EPD-RIV1) QUAL2K (or Q2K), a river and stream water quality model based on the earlier version of the QUAL2E (or Q2E) model (Brown and Barnwell 1987), is the US de facto ‘community’ river water quality model in the US (EPA, 2013b). It is similar in many ways to InfoWorks, the UK-based model used in this study; QUAL2K is a 1-D model that assumes the channel is well-mixed vertically and laterally. It uses steady state hydraulics; non-uniform, steady flow is simulated and it includes a diurnal heat budget; heat and mass inputs are allowed through point and non-point loads and abstractions. In common with InfoWorks it divides the river into a series of unequally-spaced reaches but it does not explicitly include structures such as weirs or tidal control gates which are features of InfoWorks. QUAL2K models carbonaceous BOD speciation (through slow- and fast-BOD), anoxia denitrification, sediment-water interaction, bottom algae, light extinction and pathogens. pH is simulated through alkalinity and total inorganic carbon (EPA, 2013b). The output of QUAL2K is structured around the computation of Total Daily Maximum Load (TDML) as required by the Clean Water Act. It also includes a number of modules for assessing the uncertainty in the output predictions based on uncertainties in the input parameters (not available in InfoWorks).
QUAL2K software (latest version 2.11b8, 2009) and manuals can be downloaded from the US Environmental Protection Agency website (EPA, 2013a). The free nature of this software has resulted in its widespread use around the world (e.g.
17 Melching and Yoon, 1996; Drolc and Koncan, 1999; Ning et al., 2001; McAvoy et al., 2003; Paliwal et al., 2007). Ghosh (1997) and Ghosh and McBean (1998) used the QUAL2E model and its uncertainty modules to examine the BOD and DO profiles of the Kaliriver (India) where they found that turbidity was a useful measure of benthic oxygen demand in a region where there were a combination of industrial inputs and municipal sources.
Other models listed above are more complex. For example WASP7 can be used in 1, 2 and 3 dimensions for compartment-modeling of aquatic systems, including both the water column and the underlying benthos incorporating a variety of pollutant types. It is designed to help users interpret and predict water quality responses to natural phenomena and manmade pollution for various pollution management decisions (Ambrose et al. 1993).
For some complex watershed water quality management regions in the USA various models have been integrated into suites of modules. An example of this is the Chesapeake Bay Phase 5.3 Watershed Model, a collaboration between the US Environmental Protection Agency, the Chesapeake Bay Program, the U.S Geological Survey and the University of Maryland (EPA, 2010;Voinova and Gaddis, 2008).
2.3 Water quality management and modelling in the Southeast Asia
In SE Asia a two-year project (2009-2011) was funded by International Human Dimensions Programme on Global Environmental Change at United Nations University to establish a Centre of Excellence in the field of sustainable urban water quality management in Southeast Asian countries. Research was conducted in South East Asian countries on (1) current and future urbanization expansion (2) current water management policies (3) water quality impacts caused by urban activities and climate change and (4) the development of a strategic plan including capacity building programmes. The locations of the research were four urban cities, located in Cambodia, Indonesia, Thailand and Vietnam.
18 Hydrologically, the Mekong River is one of the most complex river systems in the world. It is the longest river in South East Asia, stretching 2,703 miles through six countries, and is nearly twice the length of the Colorado River. Its watershed supports between 65 and 80 million people, providing over $2 billion dollars in revenue from wild fisheries alone (White 2002). The Mekong River Commission (MRC) is an intergovernmental body charged with promoting and co-ordinating sustainable management and development of water in the Mekong Basin (Jacobs, 2002; Backer, 2007)
The large flows of the Mekong, nearly as large as those of the Mississippi, vary widely according to available precipitation. The basin has a wet and a dry season. In the wet season ~16% of the flows come from China while in the dry season, this rises to 40% (Evers et al. 2010). Fuji et al. (2003) modelled the Cambodian floodplain of the Mekong River with Mike 11. Due to the complexity and extent of the Mekong system, drought and flood events rarely affect the entire region equally. There are also interests in the effects of possible climate change on water quality as well as water availability. Prathumratana et al. (2008) concluded that TSS, alkalinity and conductivity were the most sensitive water quality parameters for monitoring impacts of changing climate in the lower Mekong River. In terms of water quality in the Mekong, using available data from the region, Campbell (2007) found that there was no evidence that water quality was poor except in the delta region.
Simachaya (2002) modelled water quality in Thailand using monitoring data. He modelled the major rivers of Chao Phraya and Tachinin the central region of Thailand, to estimate the potential effect of different percentages of waste load reduction and compared these with the no-action scenario, for years 2010 and 2020; Simachaya (2002) found that the water quality deteriorated most in the lower reaches of the rivers.
Tkalich et al. (2002) predicted the hydrodynamics and eutrophication processes in the Singapore Straits using output from 3-D Princeton Ocean Model, coupled with water quality from eutrophication model, NEUTRO. The water quality simulation output was used to the baseline level for generic condition of Singapore coastal waters.
19 Further calibration and validation refinement was still going on at the time their paper was submitted.
A study of land use and water quality relationships was done by Ferianita-Fachrul et al. (2001) in the Ciliwung River basin, Indonesia. 30 years (1970 to 2000) of land use data and 12 years (1993 to 2005) of water quality data were used to assess the relationships and the changes. The water quality in Ciliwung River was found to have decreased to 33% while the sizes of wetland area and water body decreased to 55%. There were no details of information, or findings on the relationship mentioned in this study.
2.4 Water quality management and modelling in Malaysia
A number of water quality studies have been conducted in Malaysia with the aim of improving knowledge of the rivers systems and their management. Sultan and Shazili (2009) conducted a study of the hydrochemistry of the Terengganu River which flows eastwards from the Central Range into the South China Sea. They sampled the surface waters from the river’s source at Lake Kenyir and its five other tributaries for major, minor and trace elements plus eight anions and cations. They identified three water types, Ca-Cl-HCO3 from the lake, Na-Cl-HCO3 from the river and Na-Cl from the
estuary. The eastern side of Peninsular Malaysia is much less developed than the western side and the hydrochemistry mainly relates to the geology through which the rivers flow, the chemistry of the regional rainfall and inflow of salt water from the estuary. A small number of polluted sites were identified, thought to be due to untreated waste water and agricultural runoff. The highest level of nitrate (NO3) was
14 mg/l which is higher than the maximum values measured in the Selangor River (5.6 mg/l at Rantau Panjang and 4.9 mg/l at Kuala Selangor); nitrate levels in the four rainfall samples analysed averaged 2.4 mg/l.
A study of water quality of the Bertam River and its tributaries in Cameron Highlands by Eisakhani and Malakahmad (2009) found high levels of nitrogen and phosphorus resulting from agricultural practices and the “presence of E. coli causing severe
20
micro-biological contamination” due to the use of chicken manure and to “poorly treated or untreated sewage” entering the river.
Haris and Omar (2008) assessed the tidal effects on water quality in the Petani River coastal area. Higher values for salinity and nitrite were recorded during high tide compared to total suspended solids (TSS), ammonia and pH which were higher during low tide. They claimed that most changes in water quality during neap tide were due to anthropogenic factors and the diurnal cycle rather than the influence of the tides. Mah (2006) applied the InfoWorks River System model to the Kanan River in Sarawak to construct the flood hydrograph for this river system. Salapour et al. (2011) also used the InfoWorks model to map the extent of flooding in the Skudai river basin in Johore State. Salapour et al. (2011) used a GIS to create the flood plain topography and simulated the flooding that would occur from a 100-year flood event and generated a flood risk map for the basin. Toriman et al. (2011) modelled dissolved oxygen (DO) along a 15 km length of the Juru River, a highly-polluted (Class IV and V), ‘dying’ and tidally-influenced river, using the InfoWorks model. DO values at 8 km and 11 km from river mouth were found to range between 0.5 and 10.5 mg/l and increased at 8 km during low tide and at 11 km during high tide.
2.5 The Integrated River Basin Management (IRBM) concept
In Malaysia, in order to counter the deterioration of water quality and to meet the future challenges, the Integrated River Basin Management (IRBM) concept has been chosen. The IRBM was laid out in the Eighth Malaysia Plan (five years project plan, 2005-2010) and in the Third Outline Perspective Plan. This is a joint project between the Malaysia Government and Denmark, which is assisting in the process, to be fully implemented in Malaysia, focusing on capacity building of institutions to allow for the implementation of the IRBM approach. A number of related agencies are involved, which will explore methodologies and facilitate communication and coordination. Each is encouraged to take advantage of new strategies and opportunities provided by IRBM and respond better to environmental challenges.