TECHNICAL NOTES
INTERNATIONAL JOURNAL OF SPORT BIOMECHANICS, 1992,8, 145-151Comparison of Film and Video Techniques
for Estimating Three-Dimensional
Coordinates within a Large Field
Rosa
M. Angulo and JesLis Dapena
This study compared the errors produced with 3-D video and film analysis techniques using the DLT method with fixed cameras when the images cover a wide field of view. The results indicated that with a large field of view (8 meters) the accuracy of video analysis is clearly inferior to that of film analysis. However, within the volume of the control object, both film and video analyses are still precise enough for most practical purposes. Errors were larger in landmarks outside the control object than in the points of the control object. The maximum errors in the calculated positions of external landmarks were particularly large in the video analysis. However, even these rather large errors for points markedly outside the control object may be acceptable. It will depend on the requirements of each particular investigation. In the past few years there has been a trend to replace cinematography with video for motion analysis purposes in biomechanics. An advantage of video is that the images are available immediately. This gives the investigator interactive control of the image quality during the recording session itself, which helps to prevent errors in exposure. It also permits the start of the analysis immediately after the recording session. Another advantage of video is the low cost of videotapes compared to the cost of purchasing and processing motion-picture film stock. However, video also has negative features. Above all, pixel size limits the resolution and quality of the video images, which may significantly affect the accuracy of the coordinate values obtained through video analysis.
Kennedy, Wright, and Smith (1989) used the Direct Linear Transformation (DLT) method (developed by Abdel-Aziz & Karara, 197 1 and described in detail by Walton, 1981) to reconstruct three-dimensional (3-D) coordinates with data digitized from film and video images. They found that the difference between film and video techniques in the reconstructed 3-D coordinates of the points of their 2-meter control object was small (average errors of 4.8 and 5.8 mm, respectively).
Rosa M. Angulo, formerly a graduate student at Indiana University, is with the Departament de Biomecanica, Centre d'Alt Rendiment, Apartado de Correos 129, Sant Cugat, 08190 Barcelona, Spain. Jeslis Dapena is with the Department of Kinesiology, Indiana University, Bloomington, IN 47405.
pixel to cover a larger real-life distance, further degrades the image quality, and is likely to produce larger errors in the video analysis. Therefore, while the Kennedy et al. study showed similar accuracy in 3-D video and film analyses when each video pixel covers a small real-life distance, the accuracy of video analysis when each video pixel covers a larger real-life distance was not known. The purpose of the present study was to compare the errors produced in the reconstruction of 3-D coordinates with video and film analysis techniques using the DLT method with fixed cameras when the images cover a wide field of view.
Materials and Methods
A three-dimensional DLT control object and five stationary external landmarks were filmed and videotaped in an indoor gymnasium at Pennsylvania State University with two motion-picture cameras and two video cameras. The control object was rotated and tilted to make most of the control points visible to all cameras.
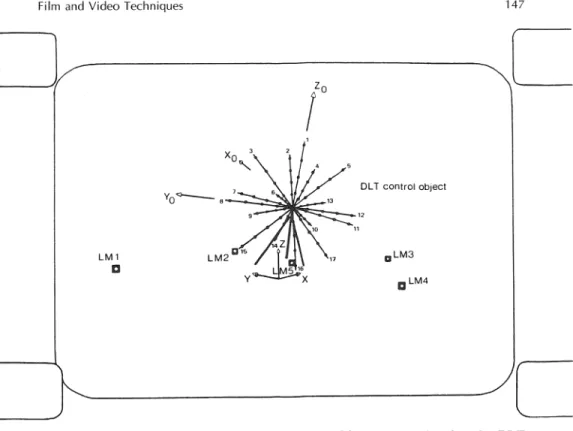
The design of the control object was based on an original idea of Thomas McLaughlin. It consisted of 17 hollow steel rods radiating from a central stainless steel polyhedron (Figure 1). Each pole had four table tennis balls (diameter =
37 mm) skewered at 0.3-m intervals. The diameter of the sphere defined by the most distal balls was 2.4 m. The polyhedron was screwed into a standard photographic tripod. An orthogonal reference frame Ro was defined with origin at the center of the polyhedron and Xo, Yo, and Zo direction vectors that coincided approximately with Rods 6, 8, and 1, respectively. Two separate calibrations with a transit prior to the filminglvideotaping session measured the positions of the 68 ball centers in reference frame Ro with a maximum error of k1.5 mm in any direction. The rods were subject to small deflection changes when the control object was tilted: With a 15" tilt (similar to the tilt used in the filminglvideotaping session), the changes in rod deflection produced a position change of less than 1 mm in the most distal balls.
Each external landmark was the center of a solid white circle (diameter =
40 mm) painted on one face of a 100-
x
100-x
19-mm black wooden square (LM1-5 in Figure 1). The five landmarks were placed standing on the ground, with the white circles facing the cameras. Their positions are shown in Figure 2. The external landmarks defined an orthogonal reference frame R (see Figure 2). Its origin was set at the average location of the five landmarks; the Y direction vector was parallel to the vector pointing from Landmark 4 to Landmark 2; the Z direction vector was defined by the cross-product of direction vector Y with a vector pointing from Landmark 3 to Landmark 1; the X direction vector was defined by the cross-product of direction vector Y with direction vector Z. TheFilm and Video Techniques 147
DLT control ob~ect
Figure 1
-
Image from one of the cinematographic cameras, showing the DLT control object (Rods 1-17) and the five external landmarks (LM1-5). The axes of reference frames R (X, Y, Z) and Ro (Xo, Yo, Zo) are also shown. The width of the field of view was similar in the images from the other cine camera and from the video cameras.coordinates of the five external landmarks in the XY plane were surveyed by triangulation using a metric tape, and expressed in terms of reference frame R.
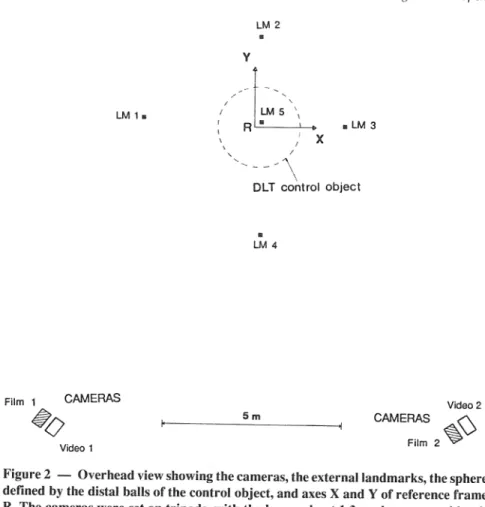
Two high-resolution, shuttered Panasonic S-VHS Reporter AG-450 video cameras were used for the videotape recordings. They had built-in 1 : 1.4,8-80-mm TV zoom lenses which were set at 8 mm. The recordings were made on Maxell S-VHS tape. The video cameras recorded 60 fields per second, with an exposure time of 11250 s. Both video cameras were set at a distance of about 10 meters from the origin of reference frame R (see Figure 2).
The videotapes were digitized at the Biomechanics Laboratory of Pennsyl- vania State University using a Panasonic AG 7300 video cassette recorder, an IBM AT Personal Computer equipped with a standard frame grabber (512
x
480 pixels) and a Panasonic BT-M1310 Y color video monitor. The size of the video monitor screen was approximately 280 mm x 200 mm. The computer operated with software developed by Peak Performance Technologies, Inc. The control object points and the external landmarks were digitized three times. (Six of the control object points were not clearly visible either in the film or in the video images, and they were not digitized; the remaining 62 control object points were used for the experiments.)\
DLT control object
Film 1 CAMERAS Video 2
*o
5 mI. 4 CAMERAS
Film 2 Video 1
Figure 2
-
Overhead view showing the cameras, the external landmarks, the sphere defined by the distal balls of the control object, and axes X and Y of reference frame R. The cameras were set on tripods, with the lenses about 1.3 m above ground level; the external landmarks were set on the ground.Two DC Locam motion picture cameras were used for the film recordings. They were equipped with Angenieux 1:2.2, 12-120-mm zoom lenses set at 12 mm in one camera and at 15 mm in the other. The film was 16-mm Eastman Ektachrome 7250 Video News Film with an ASA rating of 400. These cameras were set at 60 frames per second, with an exposure time of 11250 s. They were placed next to the video cameras.
Both the film and video images covered a field of view about 8 meters wide. With the standard video frame grabber (512
x
480 pixels), each pixel of the video images covered a real-life distance of (80001512 =) 16 mm in the horizontal direction.The films were digitized at the Biomechanics Laboratory of Indiana University. A Vanguard projection head projected the film images onto a Houston Instrument Complot digitizer connected to a SUN SPARC 41330 computer through a terminal. The projector was positioned at two distances from the digitizer surface to produce two different image sizes. The size of the projected film frame was approximately 260
x
200 mm in the small film images. This gaveFilm and Video Techniques 149
the objects that were visible in the projected images similar sizes to those in the video images. In the large film images, the projected film frame was approxi- mately 520
x
400 mm and the projected sizes of the visible objects were about twice as large as in the video and small film images. The control object points (the same 62 points as in the video digitization) and the five external landmarks were digitized three times, both in the large and in the small film images.Computer programs developed at our laboratory for implementing the DLT method of Abdel-Aziz and Karara (1971) were run in the SUN SPARC 41330 computer to calculate 3-D coordinates from the digitized film and video data. The digitized positions of the control object points served to calculate 11 parameters for each camera. These camera parameters were subsequently used with the digitized positions of the control object points and of the external landmarks to compute their 3-D coordinates in reference frame Ro. The computed 3-D coordinates of the external landmarks in reference frame Ro detem~ined the origin and direction vectors of reference frame R in reference frame Ro. Matrices were subsequently used to express the calculated coordinates of the five external landmarks in reference frame R. The computed coordinates of the points were compared with their surveyed values.
Points from the external layer of the control object were selected to define 11 lengths in various directions. The calculated values of these distances were compared with the corresponding values obtained from the surveyed coordinates. The process was repeated with the 10 possible distances among the five external landmarks.
Results
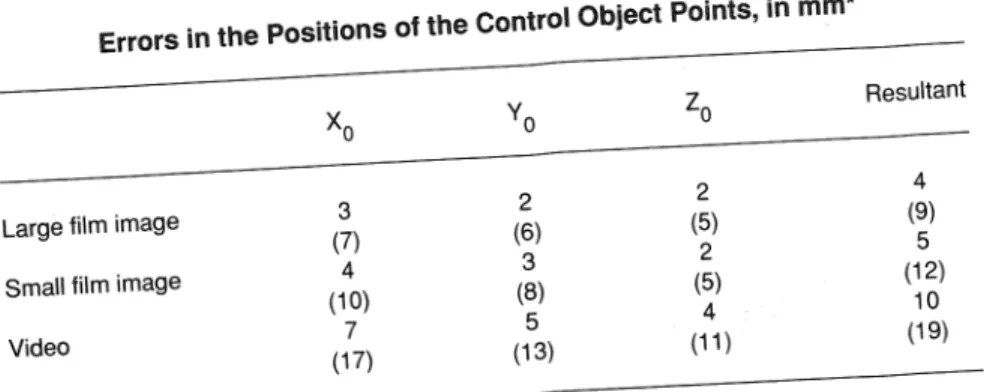
Table 1 shows the root mean square and maximum errors in the reconstructed coordinates of the control object points. The resultant error was larger in the video technique (10 mm) than in the large and small film image techniques (4 and 5 mm, respectively). Table 2 shows the errors in the reconstruction of the positions of the external landmarks in the XY plane. These errors were larger
Table 1
Errors in the Positions of the Control Object Points, in mm*
Xo yo
*,
ResultantLarge film image 3 2 2 4
(7) (6) (5) (9)
Small film image 4 3 2 5
(10) (8) (5) (1 2)
Video 7 5 4 10
( 1 7) (1 3) (11) (1 9)
"Root mean square values for 62 points.
Maximum errors given in parentheses, each being the average of the maximum errors in nine experiments (3 sets of camera parameters x 3 sets of digitized values).
Small film image Video
*Average error for 5 points.
Maximum errors given in parentheses, each being the average of the five means of the maximum errors in nine experiments (3 sets of camera parameters x 3 sets of digitized values).
Table 3
Relative Errors in Distances, Expressed as Percentages of the Surveyed Distances*
- -- - - ~ ~ - - -
Control object points External landmarks
Large film image Small film image Video
*Average error for 11 lengths (control object points) or 10 lengths (external landmarks). Maximum errorsgiven in parentheses, each being the largest percent error in nine experiments (3 sets of camera parameters x 3 sets of digitized values) with 11 lengths (control object points) or 10 lengths (external landmarks). Average distances: 2.090 m for control object points and 3.854 m for external landmarks.
than for the control object points, and again the resultant error was larger in the video technique (39 mm) than in the large and small film image techniques (29 and 28 mm, respectively).
The relative (percent length) errors in the 11 selected distances defined by control object points are shown in Table 3. The average error was larger in the video technique (0.3%) than in the large and small film image techniques (0.1% in both). Table 3 also shows the relative errors in the 10 distances defined by the external landmarks. These errors were larger than for the points of the control object, and again the average error was larger in the video technique (1.3%) than in the large and small film image techniques (1.0 and 0.9%, respectively).
Film and Video Techniques 151
Discussion
While Kennedy et al. (1989) found that 3-D video and film analyses had similar accuracies when a small field of view (3.5 m) was used, our results indicate that a larger field of view (8 m) makes the accuracy of video analysis clearly inferior to that of film analysis. The negligible difference between the results obtained with the large and small film image techniques implies that the difference in accuracy between the film and video analyses is not due to image size.
However, a more important finding of our study is that within the volume of the control object, both film and video analyses are still precise enough for most practical purposes. Percent errors in lengths are llkely to increase with increasing distance from the control object; also, for a given percent error, absolute errors will be larger with longer distances. Since the external landmarks were outside the control object, and the distances among them were larger than among the points of the control object, it is not surprising that the errors in the positions of the external landmarks were larger than those of the control object points.
The errors in the positions and the percent errors in the distances defined by the external landmarks were larger in the video analysis than in the film analyses, and the maximum errors were particularly large. However, even these rather large errors for points markedly outside the control object may be acceptable. It will depend on the requirements of each investigation.
It is not clear from the results of this study whether the differences in accuracy between the film and video analysis techniques were due to the lower resolution of the video images, to differences in the amounts of distortion produced by the lenses, or to other factors. However, the quality of the equipment used for the video and film analyses was standard. Therefore the measurement errors found in this study should be considered typical for the two techniques until further technological improvements become available.
References
Abdel-Aziz, Y.I., & Karara, H.M. (1971). Direct linear transformation from comparator coordinates into object space coordinates in close-range photogrammetry. In Pro- ceedings of the ASPlUl Symposium on Close-Range Photogrammetry (pp. 1-18). Falls Church, VA: American Society of Photogrammetry.
Kennedy, P.W., Wright, D.L., & Smith, G.A. (1989). Comparison of film and video techniques for three-dimensional DLT repredictions. International Journal of Sport Biomechanics, 5, 457-460.
Walton, J.S. (1981). Close-range cine-photogrammetry: A generalized technique for quantifying gross human motion. Unpublished doctoral dissertation, Pennsylvania State University, University Park.
Acknowledgments
The authors are grateful to Dr. Richard Nelson of the Pennsylvania State University Biomechanics Laboratory for providing the filming/videotaping facilities and the video- taping and video digitizing equipment, to Tim Aro, Frank Buczek, Soma Chengalur, Gary Heise, Joseph Johnstonbaugh, and Young-Hoo Kwon for their technical assistance at Pennsylvania State University, and to the Center for Innovative Computer Applications (CICA) of Indiana University for the use of their SUN SPARC 41330 computer.