Electricity Supply Industry Expert Panel
A Review of the Financial Position of the
State Owned Electricity Businesses
Electricity Industry Panel - Secretariat GPO Box 123 Hobart TAS 7001 Telephone: (03) 6232 7123 Email: contact@electricity.tas.gov.au http://www.electricity.tas.gov.au December 2011
Contents
GLOSSARY ... 4
PART 1 ... 1
Foreword ... 1
Purpose and Approach ... 2
Qualification ... 4
Executive Summary ... 5
How the Proceeds from Electricity Sources Flow Through the SOEB Portfolio ... 6
Key Sources of Financial Value Within the SOEB Portfolio ... 9
Financial Position of the SOEBs ... 13
Business diversification activities ... 18
Future risks and opportunities ... 21
1. Structure of the Tasmanian Energy Market ... 24
2. Financial Flows Through The SOEB Portfolio ... 25
2.1.1. Wholesale Energy ... 26
2.1.2. Transmission use of System Charges ... 29
2.2. Significant Intra-SOEB Financial Flows are a Consequence of the Increasing Complexity of Hydro Tasmania’s and Aurora Energy’s Business Activities ... 29
2.2.1. Aurora Energy ... 29
2.2.2. Hydro Tasmania ... 31
3. Cash Generation and Allocation – changes over time ... 34
3.1. SOEB Perspective - cash generation and utilisation... 35
3.1.1. Hydro Tasmania ... 35
3.1.2. Aurora Energy ... 41
3.1.3. Transend ... 48
3.1.4. Summary of SOEB portfolio cash generation and utilisation 2004 to 2010 53 3.2. Portfolio Perspective of Financing Activities ... 55
3.2.1. Investment – functional and diversified business activities ... 55
3.2.2. Debt ... 59
3.2.3. Returns to Shareholders – dividends paid ... 61
3.2.4. Superannuation Defined Benefits Obligations 2010 ... 65
4. Financial Risks and Opportunities ... 67
4.1. Hydrological conditions ... 67
4.2. Carbon Pricing ... 69
4.3. Renewable energy certificates ... 70
4.4. Retail Competition ... 70
4.5. Expenditure exceeding regulatory allowances ... 70
4.6. Major financial obligations ... 72
4.6.1. Transend: ... 72
4.6.2. Aurora Energy: ... 72
4.6.3. Hydro Tasmania: ... 72
4.6.4. Diversification activities and operation in national/international markets 73 PART TWO ... 75
5. Hydro Tasmania ... 76
6. Aurora Energy Pty Ltd ... 92
GLOSSARY
TERM MEANING
AARR Aggregate Annual Revenue Requirement
ACCC Australian Competition and Consumer Commission AEATM Alinta Energy Australia Trading and Marketing AEMO Australian Energy Market Operator
AER Australian Energy Regulator
AETV Aurora Energy Tamar Valley Pty Ltd BBPS Bell Bay Power Station
BSA Basslink Services Agreement CLP China Light and Power
CY Calendar Year
DUOS Distribution use of System
EBITDA Earnings Before Interest Tax and Depreciation FRC Full Retail Contestability
FTTP Fibre to the Premises
FY Financial Year
GBE Government Business Enterprise
GW Giga Watt
GWh Giga Watt Hours
HEC Hydro Electric Corporation / Commission / Department ITE Income Tax Equivalents
JV Joint Venture
MAR Maximum Allowable Revenue MI Major Industrial
MW Megawatt
MWh Megawatt Hour (= 1 thousand kWh) NBN National Broadband Network NEM National Electricity Market
NEMMCO National Electricity Market Management Company PCR Price Control Regulations
TERM MEANING
PTS Prescribed Transmission Service RAB Regulatory Asset Base
RECs Renewable Energy Certificates ROA Return on Allowance
ROC Return on Capital
SOEB State Owned Electricity Businesses
TER Tasmanian Economic Regulator / Tasmanian Energy Regulator TESI Tasmanian Electricity Supply Industry
TNSP Transmission Network Service Provider TNGP Tasmanian Natural Gas Pipeline ToR Terms of Reference
TUOS Transmission use of System TVPS Tamar Valley Power Station
Foreword
In October 2010, the Tasmanian Parliament passed the Electricity Supply Industry
Expert Panel Act 2010 to establish an independent expert panel to conduct a
review into, and provide guidance to Parliament on, the current position and future development of Tasmania’s electricity industry.
The Panel’s Terms of Reference require it to investigate and report on the financial position of the State-Owned Energy Businesses (SOEBs), Transend, Hydro Tasmania and Aurora Energy. (ToR No.4)
The Panel engaged consultants Ernst & Young to undertake an analysis of the historical and forecast financial performance of the SOEBs. This analysis has informed the development of this Paper and the Panel’s broader work program. The purpose of this Paper is to highlight the:
sources of financial value and financial flows between the SOEBs and within each business entity;
relative contributions to business value and Shareholder returns from ‘functional’ (generation, transmission, distribution and retail) business activities; and
extent to which the value generated from functional business activities have contributed to sustainable capital structures (debt levels), equity returns (dividends and equity transfers) and business growth (diversification).
In addition, the Panel has developed summary papers of the key events which have influenced the financial performance of each of the SOEBs. These have been prepared to provide an information base on which the portfolio analysis has been developed.
John Pierce Chairman
Purpose and Approach
The Panel’s review of the financial position of the SOEBs is focused on business activities directly related to the supply of electricity to Tasmanian customers – hydro-generation, transmission, distribution and retail in Tasmania. For the purposes of this Paper these activities are termed functional business activities.
Consistent with its Terms of Reference, the Panel’s review is limited to the financial sustainability of the SOEBs and does not look at wider value considerations of business activities, such as contribution to broader economic or community benefits (beyond direct returns through dividends).
The Panel selected the period 2004 to 2010 for its review as this period spans the key events in the development of the TESI, - physical interconnection via Basslink, adoption of National Electricity Market (NEM) arrangements and the phased roll-out of retail contestability to Tasmanian electricity customers. The SOEB entities have commented to the Panel that a historical review of financial performance is not an indicator of future financial performance, citing improved financial outcomes in 2011 resulting from productivity and efficiency measures and new strategic business directions. However at the time of writing, complete actual1 2011 data was not available and therefore has not been included.
For Hydro Tasmania and Aurora Energy competition and customer choice for energy gave rise to changes in business risk. Tasmania’s participation in the NEM also provided the stimulus for the pursuit of business opportunities and activities outside Tasmania. As a result, there has been a clear diversification of business activities by Hydro Tasmania and Aurora Energy. The Panel has observed that the primary motivation behind this trend appears to be the mitigation of risk in functional business activities. However, some diversification activities have been pursued as value creating strategies in their own right and are more remotely related to existing functional business activities.
Tasmania’s entry into the NEM has also seen changes to the regulatory framework applying to the transmission and distribution network businesses as it has transitioned from Tasmanian based regulation to the national regulatory framework under the Australian Economic Regulator. Evolution of the regulatory framework has also seen changes in the methodologies applied across regulatory determinations.
In addition to market changes, the review period included a period of extreme hydrological significance, described by Hydro Tasmania as a “1:1000 year event” of low inflows. Water storage levels fell to historic lows of 19 per cent across 2007 and 2008, significantly below Hydro Tasmania’s preferred operating zone of a storage system level between 30 and 50 per cent.
During this time Hydro Tasmania was required by its Shareholders to ensure supply. This expectation, coupled with its contract position, required Hydro Tasmania to operate the gas fired Bell Bay Power Station (BBPS) and purchase electricity from the NEM, via Basslink. Both of these options incurred higher costs than Hydro Tasmania’s existing contract arrangements.
The Panel has approached its investigation from both a ‘whole-of-portfolio’ basis (Part 1 of this Paper) and on an individual entity basis (Part 2 of this Paper).
Part 1 of this Paper:
Provides an overview of the structure of the TESI and describes how the proceeds from electricity sales flow through the SOEB portfolio;
Identifies the primary sources of underlying profitability – or direct financial value – within the SOEB portfolio, where value is realised and what influences value outcomes (financial performance measured by EBIDTA)2;
Identifies the major inter-SOEB financial flows and the major intra-SOEB financial flows; and describes how these have been influenced by energy sector reform and diversification of business operations;
Describes how value translates into ‘free cash’ (measured by cash available from operations) and how this cash is utilised by SOEB entities; and
Identifies key risks and opportunities to future financial performance. Part 2 of this Paper:
Looks at key influences on financial performance for each of the SOEBs in greater detail. In this regard it provides further information underpinning the analysis in Part 1 of the Paper.
Qualification
The complexity of the Tasmanian electricity market, and the SOEBs themselves, has increased since 2004. As a consequence, methods of recording and reporting financial information within each business have changed over time. Further, new activities and transactions have commenced and some activities and transactions have ceased. This creates difficulties in analysing changes in financial performance on a consistent basis over time.
The financial information presented in this paper has been obtained from a variety of sources including the audited accounts and other financial information held by the SOEBs, such as management accounts. In developing this Paper, the Panel has requested some information from the SOEBs in forms that are different from the way in which they typically record and review their own information. In some cases, estimates have been required to be established (prepared with the assistance of Ernst & Young). The information in this a paper has been reviewed by the SOEBs where appropriate for factual accuracy. The analysis and conclusions drawn by this Paper are those of the Panel and do not represent the views of the SOEBs.
As such, readers of this Paper should interpret the financial information as illustrative of broad trends, rather than precise and detailed financial results that will always reconcile with published annual report information or information from other sources. For the purposes of this Paper, Aurora Energy’s principal activities of retail, distribution and energy are discussed as separate business components to enable the reader to gain an understanding of their respective financial performance. This is different to the way in which Aurora Energy structures its business operations, whereby it incorporates retail and energy (including gas) in its Energy Division, while retaining distribution and network services separately in its Distribution Division.
Unless otherwise indicated, all dollar figures in this Paper are expressed on a nominal basis and dates represent the financial year.
Executive Summary
In the simplest terms, the financial performance of the SOEBs is a measure of how much is earned through revenue for services provided offset by how much is spenton the cost of providing those services (operating expenses and capital). The financial position of the SOEBs reflects how what is being earned is utilised by the businesses, including the payment of dividends to Shareholders.
In terms of financial position, from a Shareholder perspective, there is a tension between sustainable capital structures, approving major capital investment (particularly where it relates to business diversification or expansion for growth) and the provision of dividend returns to the community.
From the historical review we can observe how this tension has been resolved through the choices that have been made by the Shareholders; and the financial consequences of those choices. This can provide guidance on future choices around the same inherent tensions.
How the Proceeds from Electricity Sources Flow Through
the SOEB Portfolio
Changes in the total revenue earned by the SOEBs over the review period are partly a function of increases in electricity prices paid by Tasmanian customers as well as load growth. It is important to understand that Aurora Energy’s revenue from Tasmanian customers includes pass through costs of supply, such as Renewable Energy Certificates (RECs) and charges applying to distribution and transmission network services, which is revenue earned by its distribution business and Transend. A large portion of Aurora Energy’s cost of supply is the cost of energy, which historically has been reflected as revenue by Hydro Tasmania and now also includes Aurora Energy’s tolling fee for the Tamar Valley Power Station (TVPS). In this sense, prices paid by Tasmanian electricity customers ‘filter through’ the vertical chain of supply as revenue.
Unlike the situation pre-NEM entry, revenue earned from Tasmanian electricity customers is no longer the only source of revenue within the SOEB portfolio. For example, both Hydro Tasmania and Aurora Energy trade wholesale energy in the NEM and have retail customers outside Tasmania. Aurora Energy is also a gas wholesaler and retailer in Tasmania and a gas wholesaler Victoria, and has a tolling arrangement with the Bairnsdale power station for electricity the station produces. 2010 An illustration of revenue flows and cash utilisation
Figure 1 illustrates the two primary financial flows within the SOEB portfolio:
1. How revenue paid by Tasmanian customers to Aurora Energy flows through the SOEB portfolio and is attributed to the components of electricity supply – generation, transmission, distribution and retail; and
2. How total revenue received by SOEB entities, including all revenues arising from the Tasmanian customers (not just those that originate through Aurora Energy’s retail business) and revenues derived from other business activities in Tasmania and elsewhere, is attributed within the business or returned to Shareholders as a dividend.
The internal complexity of Hydro Tasmania and Aurora Energy, and the general complexity of the electricity market, presents challenges in undertaking this type of analysis. Therefore, the Panel reiterates that dollar figures shown in Figure 1 are approximates only and, as all transactions are not represented, will not necessarily be ‘additive’. The intent is to illustrate the broad quantum of financial flows within the SEOB portfolio and between total revenues earned by the SOEB portfolio and uses of cash, including dividend returns to the Tasmanian community.
Revenue flows from Aurora Energy’s Tasmanian customers
The first column of Figure 1 should be read downward, as it illustrates how revenue from Aurora Energy’s Tasmanian customers flows through the SOEB portfolio.
In 2010, Aurora Energy’s Tasmanian customer revenue was approximately $865 million. Of this $542 million was derived from non-contestable customers and $323 million from contestable customers.
Some $323 million of customer revenue flowed through to Aurora Energy’s distribution business for transmission and distribution costs. Transmission use of system (TUOS) charges of $93 million were a direct pass-through to Transend and distribution use of system charges (DUOS) of $231 million were retained by Aurora Energy’s distribution system.
Aurora Energy’s energy business costs totalled $518 million, of which $82 million was paid to its subsidiary, Aurora Energy Tamar Valley (AETV) under the tolling arrangements for the TVPS. The balance, approximately $416 million, flowed through to Hydro Tasmania for energy purchases.
Figure 2 below illustrates the share of Tasmanian customer revenue attributable to each component of the supply chain, noting that retail will include some pass-though costs, such as RECs, that will flow to third parties.
Figure 2 - Allocation of Aurora Energy’s Tasmanian customer revenue 2010
Source: Panel analysis
Note: This does not reflect the break-up of costs incorporated into non-contestable customer tariffs as show in Panel publications, as it relates to contestable and non-contestable customer revenue.
SOEB revenue generation to cash utilisation
Returning to Figure 1, reading across the page illustrates how total revenue derived from all sources by each SOEB entity translates to earnings after operating expenses (represented by EBITDA), which is then utilised by the business for capital investment, financing costs and dividends paid.
On a cash basis, direct operating costs (payments to suppliers and employees) as a proportion of cash received from customers varied across the SOEB entities, with Aurora Energy 92 per cent, Hydro Tasmania 70 per cent and Transend 33 per cent. These outcomes reflect each entity’s ability to fund capital investment (or business diversification), repayment of borrowings and dividends from cash from operations – or is reflective of need to borrow for these activities. In summary; in 2010:
Aurora Energy’s net cash after operating activities, including payment of finance charges and Income Tax Equivalents (ITEs), was $49 million. Capital investment of $234 million and dividends paid of $10 million were funded from increased debt and retained cash from 2009;
Hydro Tasmania’s net cash after operating activities was $178 million. From this, Hydro Tasmania funded a $95 million capital investment program and completed the Momentum acquisition of $35 million. Hydro Tasmania also prepaid $69 million of debt, improving its capital structure; and
Transend’s net cash after operating activities was $101 million. This was utilised to fund capital investment of $147 million, increasing debt by $30 million.
Key Sources of Financial Value Within the SOEB Portfolio
Across the SOEB portfolio, key sources of financial value relate to hydro-generation, transmission and distribution business activities. By comparison, gas-fired generation, electricity retailing and diversification activities have contributed only marginally to financial returns.Energy generation and energy trading is Hydro Tasmania’s main value driver. It generates hydro electricity in Tasmania which it uses to back contract positions with wholesale customers, and retailers in Tasmania and to retail customers, through its subsidiary Momentum in other NEM regions.3 It also generates value via Basslink arbitrage opportunities and through trading in spot market and contract markets. A particular source of value from to Hydro Tasmania is the value from its contracting arrangements with Aurora Energy for supply to non-contestable customer sector.4
3Hydro Tasmania sells electricity to its retail business – Momentum Energy Pty Ltd – which operates on the mainland.
In both the 2007 and 2010 price determinations, the regulated wholesale energy allowance has been higher than the market cost estimate. The contract arrangements struck between Hydro Tasmania and Aurora Energy for the period of the 2007 price determination saw the full value of the wholesale energy allowance captured by Hydro Tasmania.
The latest arrangements for energy to supply non-contestable customers results in a shift in value available under the PCR away from Hydro Tasmania (which with its higher than market value would have been reflected as profit) and to Aurora Energy where it was used to fund the large fixed costs (gas commodity and transport and debt) associated with operating the TVPS. As these fixed costs are paid to third parties, part of the value available under the PCR has been transferred to the private sector and is therefore not available to be returned to the Tasmanian community as a dividend.
During the drought period, Hydro Tasmania’s financial performance was assisted by the price methodology set in the 2007 Price Determination (effective 1 January 2008 to 30 June 2010), which required non-contestable customers to pay a ‘drought premium’ of slightly less than $3/MWh – amounting to $28 million in total.
For contestable customers in the position of renegotiating contracts with Hydro Tasmania during the drought period, market prices reflected the prevailing conditions, meaning that the cost of alternate generation would have been passed through to these customers.
The value of hydro-generation has also been positively influenced by the Basslink arbitrage opportunity. This is derived from Hydro Tasmania holding back production of electricity at times of low prices in Victoria, allowing electricity to flow southward as a substitute for on-island generation, and then later producing that same volume and selling it into Victoria at higher value.
For the regulated network businesses, the largest single driver of value is the return on capital invested in network assets. Return on capital is determined under the revenue cap regulation process by applying the Weighted Average Cost of Capital (WACC) to the Regulatory Asset Base (RAB).5
Over the review period, there has been considerable capital investment by network businesses to replace and refurbish aged assets and to meet customer-driven demand. The opening RAB for Aurora Energy’s distribution network increased by $541 million or 70 per cent from $726 million in 2004 to $1.267 billion in 2010, with WACC increasing from 6.61 per cent to 6.64 per cent between the 2003 and 2007 price determinations. By comparison, the WACC included in Aurora Energy’s proposal for the 2011 price determination is 10.33 per cent which will be applied to
5The RAB represents the capital investment used to undertake the prescribed network services and is derived from
the initial value of the assets plus additional capital expenditure (if approved by the Regulator) after allowing for deprecation.
the opening RAB for each year of the determination.6 The opening RAB for the 2011 price determination is estimated by Aurora Energy to be $1.485 billion, $759 million higher than the opening RAB for the previous determination of $726 million.
Similarly, the opening RAB for Transend’s transmission network increased by $524 million or 92 per cent from $570 million in 2004 to $1.094 billion in 2010, with WACC increasing from 8.80 per cent to 10.0 per cent between the 2003 and 2009 price determinations.
This historical expenditure will have ongoing consequences for Tasmanian transmission and distribution prices in the future as the WACC is applied to the RAB (after allowing for depreciation) in future regulatory periods.
Offsetting increases in revenue, operating expenses have also increased over the review period. The Panel observes that there has been a progressive focus by SOEB entities on efficiency gains, in response to a more clearly articulated direction by Shareholders in recent years. While this may improve future financial performance, historical overspending of regulatory allowances by Transend and Aurora Energy’s retail and distribution businesses has contributed to operating expenses over and above those determined through the regulatory process. These have had a direct impact on profit. Recently the SOEBs have adopted a range of measures to improve the efficiency of their operations.
Summary of efficiency measures/programs:
Hydro Tasmania has had an internal efficiency focus for some time, illustrated by its management of cash through the drought period 2006 to 2009 where it incurred additional costs to source supply from gas fired generation and from the NEM. Hydro Tasmania’s current efficiency strategy is to reduce capital and operating expenditure to generate cash to repay debt to reduce financing costs and achieve a credit rating of BBB+ by 2014; and to finance other investment initiatives. Reflecting the efficiency measures, over the last three years Hydro Tasmania has repaid $69 million in debt and funded the Momentum acquisition of $52 million from internally generated funds.
Transend has recently implemented an Employee Regulatory Incentive Scheme to incentivise its staff to deliver operating and capital efficiencies, while maintaining service levels. This scheme is funded through the Australian Economic Regulator (AER’s) Capital Expenditure Incentive Scheme which rewards Transend for minimising or deferring capital expenditure. For the first year of the current regulatory period, 2010, Transend’s actual capital expenditure was $28 million below forecast and actual operating expenditure was $3 million below forecast. In part this reflects an increase in the regulatory allowance allowed by
6 In its Draft Determination, the AER has not accepted Aurora Energy’s proposed WACC – rather the AER had
the AER compared to Transend’s previous determination. By comparison, during the previous regulatory period, Transend overspent its capital expenditure allowance by $37 million or 11 per cent and overspent its operating expenditure allowance by $28 million or 15 per cent.
Aurora Energy is in the progress of implementing efficiency measures to reduce upward pressure on distribution service prices and to position itself competitively in the retail market. Evidence of the effectiveness of these measures will be in future years rather than in data analysed for the review.
Aurora Energy considers that the reductions in its current regulatory proposal for prescribed distribution services are achievable due to the significant investment in the distribution network that has been made in the past. For the first two years of the current regulatory period (2009 and 2010), Aurora Energy overspent its capital expenditure allowance by $29 million or 9 per cent and underspent its operating allowance by $2 million. This compares to the previous regulatory period where Aurora Energy overspent its capital expenditure allowance by $170 million or 80 per cent (noting that $95 million related to customer connections) and overspent its operating expenditure allowance by $16 million or 9 per cent.
There is evidence of historical overspending by Aurora Energy in other parts of its business operations. The development of a new customer billing system, originally budgeted to cost $15 million was completed for $60 million. Of this, $32 million will be directly expensed impacting financial performance (of which $21 million was expensed in 2010 and $11 million was expensed in 2011).
The Tasmanian Economic Regulator (TER) has allowed Aurora Energy an industry benchmarked cost to serve of $95 per customer per annum, compared to Aurora Energy’s submission of $105 per customer per annum. Aurora Energy’s retail cost to serve per customer is impacted by economies of scale and its move into mainland retail sales was driven in part by an effort to spread fixed costs across a larger customer base. This cost is a focus of Aurora Energy’s current efficiency and productivity measures and will need to be reduced if Aurora Energy is to position itself competitively in an open retail market in Tasmania
The renewed focus on efficiency is expected to improve financial performance. However, this will require ongoing focus by management and Shareholders if it is to be achieved and maintained.
Financial Position of the SOEBs
The Tasmanian Government, on behalf of the Tasmanian community, has a direct interest in the financial sustainability of the SOEB portfolio in three key regards:
The SOEB entities sustain a financial position to continue the delivery of electricity to Tasmanian customers, including sustainably re-investing in those activities;
The SOEB entities maintain appropriate capital structures and debt levels. In 2010 the SOEB combined debt comprised 88 per cent of the Tasmanian Government’s total non-financial business debt portfolio. This debt forms part of the total public sector balance sheet which is considered for credit rating purposes and therefore influences the cost of debt to the Tasmanian Government as well as investor confidence in the State; and
The Tasmanian community benefits from its investment in the SOEBs by way of dividends that should reflect commercial return on its equity investment. These dividends contribute to funding a broad range of policy objectives and this return is core to the public ownership of SOEB entities.
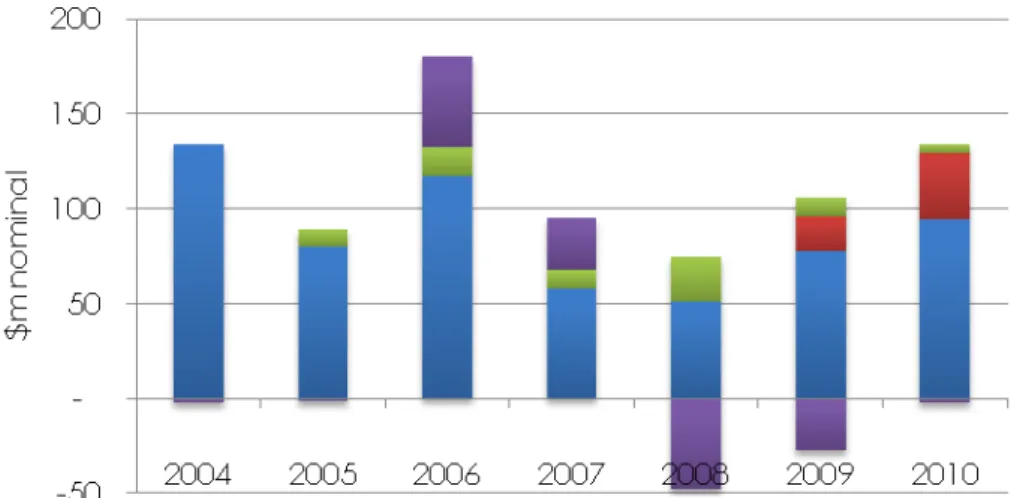
The Panel’s approach to its review of the financial position of the SOEBs is to analyse how net cash from operations (free cash) has been used for capital expenditure and diversification investment, repay debt and return a dividend to Shareholders. Figure 3 illustrates net cash from operations for each of the SOEBs over the review period.
Figure 3 - SOEB Net cash from operations 2004 to 2010
The extent to which efficiency has been a focus of management and Shareholders will determine whether cash from operations is consistent with that which should be expected given regulatory outcomes or prevailing market conditions.
Each of the SOEB entities has generated sufficient cash to fund operating activities and to have available an amount of ‘free cash’ to utilise for capital investment in functional assets or diversification and growth activities, repay debt or return to Shareholders as equity. Following capital investment for the refurbishment and replacement of assets related to functional business activities, the actual allocation of free cash over the review period indicates a preference by Shareholders for investment in diversified business activities, particularly by Hydro Tasmania, rather than the return of capital to the community by way of dividends (for example through the payment of special dividends).
Sustainable delivery of core business functions
The SOEBs generate sufficient cash to continue the delivery of electricity to Tasmanian customers and to sustainably re-invest in those activities.
There has been an increase in the scope and magnitude of financial liabilities which must be met from cash from operations. In 2010, the financial liabilities of the SOEB portfolio included gross debt of $2.5 billion, including an unfunded defined benefits superannuation liability of $450 million. Additionally, the major infrastructure investment decisions of Basslink and the TVPS, together with the commercial decision by Aurora Energy to become a wholesale gas operator, have created fixed financial obligations in the order of $90 million per annum on Hydro Tasmania and Aurora Energy respectively. However, the source of revenue available to service these commitments, and therefore the risk of not being able to do so, is different. Basslink enables Hydro Tasmania to trade electricity between Tasmania and other NEM jurisdictions to capture the highest value for its water resources. Hydro Tasmania’s ability to generate this value is a function of water availability and the temporal changes in electricity prices that provide arbitrage opportunities. The Panel’s detailed review of Basslink highlighted that when water is available, Basslink has provided revenues to Hydro Tasmania in excess of the additional costs that it brings to the business. In low inflow periods, Basslink has not provided revenues in excess of its costs, but it has enabled electricity supplies at a lower cost than alternate on-island generation.
Aurora Energy utilises output from the TVPS, by tolling arrangements with its subsidiary AETV, to back approximately one half of its non-contestable customer load. Aurora Energy’s ability to fund the tolling arrangement is based on the current regulatory arrangements for the energy allowance for non-contestable customers and its commercial arrangements with Hydro Tasmania for the balance of energy required for the non-contestable load. These arrangements expire on 30 June 2013. Should different arrangements be applied after that date, this could impact on Aurora Energy’s ability to service these commitments.
Capital Expenditure and Investment
Between 2004 and 2010, capital expenditure and equity investment across the SOEB entities totalled $2.6 billion, including $491 million invested in diversification activities. $100 million was invested in business activities outside Tasmania.
Sources of funds for capital expenditure and diversification investment include free cash, debt or equity contributions from Shareholders.
Table 1 shows SOEB capital expenditure on functional business assets and investment in diversification activities between 2004 and 2010.
Table 1 - Capital expenditure and diversification investment 2004 to 2010
Source: Panel analysis
$ million 2004 2005 2006 2007 2008 2009 2010 Total
Hydro Tasmania Capital
Expenditure 135 105 128 54 55 81 96 654
Hydro Tasmania Investment -
R40JV 10 23 10 5 48
Hydro Tasmania Investment –
Momentum 17 35 52
Aurora Energy Capital
Expenditure 83 102 134 125 134 168 169 915
Aurora Energy Investment -
TVPS 294 66 360
Aurora Energy Investment – Gas contracts and dispatch
rights 15 15
Transend Capital Expenditure 61 74 89 55 64 97 132 572
Transend Investment - Telco 16 16
Total Capital Expenditure and
Hydro Tasmania’s primary area of capital expenditure has been on hydro-generation assets, with $407 million spend between 2004 and 2007. In addition to equity contributions to the Roaring 40s joint venture (of which $48 million was provided by the Government) between 2004 and 2006, Hydro Tasmania spent $103 million on renewable developments including wind farm assets, primarily sourced from debt. Hydro Tasmania’s $52 million acquisition of its retail business, Momentum, was made from free cash.
Aurora Energy’s primary area of capital expenditure has been its distribution network, with a total of around $753 million in investment. The second largest spend was $116 million in corporate and shared services – which represented whole-of-entity investment in activities such as IT and the development of its new billing system. Aurora Energy’s capital investment is funded through cash from operations and debt. In 2008, Aurora Energy received an equity contribution of $100 million from its Shareholders to acquire the TVPS.
Transend’s principal area of capital expenditure has been on the transmission network, with $252 million on expended on system augmentation and $274 million on asset renewal. Transend utilises free cash from operations to fund network investment with the balance sourced through increased debt.
Maintenance of appropriate capital structures and debt levels
The total SOEB debt position increased by $938 million or 63 per cent from $1.482 billion in 2004 to $2.420 billion in 2010. In general terms, the borrowing capacity of the SOEB portfolio is constrained. Debt levels also impact on credit ratings and consequently the cost of debt through interest charges.
Hydro Tasmania increased its debt in 2005 by $131 million principally for the construction of Woolnorth Studland Bay and Cathedral Rock wind farms. A further increase of $115 million in 2007 provided working capital during the drought period. Repayment of debt is an emerging trend in Hydro Tasmania’s free cash allocation, with debt reduced by $106 million from 2008 to 2010. Hydro Tasmania is targeting a BBB+ credit rating that will require debt to be held at current levels.
Historically, Aurora Energy and Transend’s debt related to capital investment in their respective network businesses. More recently, directions from Shareholders have increased the debt position of both companies.
In 2009, Aurora Energy was required to borrow $260 million to complete the construction of the TVPS. Borrowing to fund the TVPS required the Treasurer to provide a letter of comfort to the Tasmanian Public Finance Corporation on that portion of Aurora Energy’s debt. The TVPS has a highly geared capital structure, impacting on Aurora Energy’s overall credit rating and consequently its cost of debt, including to its distribution business. Any changes in the regulatory framework for non-contestable customers from 30 June 2013 may impact on the ability of Aurora Energy to service this debt. Aurora Energy is currently BBB rated but is targeting BBB+ within a 5 to 10 year time period. A BBB+ rating is consistent with the assumed rating used by the regulator as part of the network pricing determination process. This means that Aurora Energy’s cost of debt relating to its distribution business is higher than the financing costs it receives under its regulatory allowance. Transend’s debt has increased as a result of the Tasmanian Government’s decision to rebalance equity across the SOEB portfolio via a ‘debt swap’ between Hydro Tasmania and Transend ($220 million) and to withdraw equity ($50 million) in 2008 which was also provided to Hydro Tasmania. Transend is currently ‘A’ rated and has some balance sheet capacity, although this will be reduced if Transend needs to fund from debt the Tasmanian Government’s equity commitment to TasRail of $100 million over the next five years.
Benefit the Tasmanian community by providing commercial
returns on their invested capital
The Tasmanian community benefits from its investment in the SOEBs through dividends which should reflect a return on its equity investment.7 These dividends contribute to funding a broad range of government policy objectives and are core to the rationale of ongoing public ownership of the SOEBs.
The payment of dividends to shareholders, and therefore the return to the Tasmanian community from business activities, totalled $309 million over the period 2004 to 2010. This represents, in aggregate, 18 per cent of cash from operations. Of total dividends paid, $52 million, or 17 per cent comprised the Shareholder’s special dividend requirement from Hydro Tasmania. During the first three years of the analysis period, Hydro Tasmania was required to supplement ordinary dividends with special dividends to pay a total dividend of $40 million per annum.
7 ‘Equity investment in a government business carries an opportunity cost, being the benefit the Government
forgoes from an alternative use of the equity. Accordingly, the Government expects its businesses to achieve returns that are comparable to alternative investments of similar risk, and for dividends to be at an appropriate level to reflect these returns’ (Guidelines for Tasmanian Government Businesses – Dividends – November 2010).
Other than Hydro Tasmania’s special dividend arrangement, the Panel has seen no evidence that successive Tasmanian governments have utilised the SOEBs as quasi tax-raising entities through the extraction of dividends. On the contrary, dividend returns have been continuously low and below the cost of capital for investment of the kind undertaken by the SOEBs.8 However, in the 2011-12 Budget, the Government announced a preference for improved returns across the SOEB portfolio by increasing the rate of underlying profit to be returned as a dividend from 2011.
Business diversification activities
There has been a clear diversification of business activities by Hydro Tasmania and Aurora Energy, away from their respective functional business activities of hydro-generation and distribution and retailing in the Tasmanian market.
The primary motivation for business diversification appears to be mitigating risk in functional business activities9 – arising in part from the nature of the native Tasmanian market and in part from implications of energy reform. Some diversification activities have been pursued by the entities as value creating strategies in their own right and in some cases the strategic basis for an activity has shifted from a risk mitigating measure to a value creating opportunity over time. Hydro Tasmania’s initial basis for building wind farms in Tasmania was to secure additional on-island capacity following the end of dam construction. Subsequently, Hydro Tasmania developed wind assets in the national and international markets, as a value strategy not related to energy supply in Tasmania. Hydro Tasmania’s current wind strategy is to secure Renewable Energy Certificates (RECs) to support its retail business growth. Hydro Tasmania’s capital investment in wind assets through the Roaring 40s joint venture is $98 million, which to date has returned a cumulative loss of $11.2 million. In 2010 Hydro Tasmania’s equity share in the Roaring 40s joint venture was $121 million, noting that the joint venture has since been dissolved and Hydro Tasmania has announced its intention to sell 75 per cent of the Woolnorth wind farm assets. Hydro Tasmania’s underlying value in its wind farm investments will be determined through this sale process, rather than on the carrying value of its assets.
8 Unlike private shareholders in traded companies, Government shareholders cannot sell shares to access their
capital (unless the business is privatised). For Government owned businesses, dividends are the only way in which shareholders can get a return. As such, a Government which is getting little or no dividends is accepting all of the risk and no gain.
9 For example, Hydro Tasmania’s current retail strategy is to provide a path to market for excess generating capacity
Similarly, following the end of dam construction, Hydro Tasmania’s consulting business, Entura, was retained to provide operation and maintenance services to the existing hydro-generation assets and provide services to the other SOEBs. There has been an ongoing strategy to diversify Entura’s revenue base away from Hydro Tasmania. Entura’s share of revenue sourced from Hydro Tasmania has declined from 68 per cent in 2004 to 39 per cent in 2010, offset by services to external clients, increasingly in the national and international markets. Since 2002, Entura has made an EBIDTA contribution of between $1 and $4 million per annum, with a loss of $4 million in 2010 associated with the Global Financial Crisis (GFC). Hydro Tasmania’s purchase of its retail business, Momentum, is to capture the wholesale and retail value of excess generation capacity in Tasmania following the commissioning of the TVPS and to mitigate against the loss of a large customer. The analysis period reflects the acquisition phase of Momentum. As such, the longer-term outcome of this strategy will be reflected in future year’s performance. Hydro Tasmania’s capital investment in Momentum is $52 million, which to date, has returned a cumulative loss of $15.1 million during its start-up phase. Hydro Tasmania believes that Momentum will deliver strong profit growth in the coming years.
In a similar manner, in response to the introduction of customer contestability, Aurora Energy expanded its retail base into other NEM jurisdictions to spread its largely fixed cost-to-serve expense across a larger customer base. Between 2005 and 2010 Aurora Energy’s cumulative return from mainland electricity retail trading was $3.3 million.
At the direction of its Shareholders, on the basis of energy security, Aurora Energy acquired and completed construction of the gas fired TVPS. This required Aurora Energy to borrow $260 million, which has influenced the overall cost of debt across the business. The Panel has estimated the negative impact on Aurora Energy’s net profit after tax from the operation of the TVPS in 2010 to be $29 million when compared with an assumed situation where it could have sourced its energy requirements from Hydro Tasmania at a price equivalent to the regulated wholesale energy allowance. As noted above, the viability of the TVPS for the period 2011 to 2013 is underpinned by the value of the wholesale energy allowance and Aurora Energy’s contractual arrangements with Hydro Tasmania for the balance of the non-contestable customer load.
Shortly after its sale of the TVPS, Babcock and Brown Power also put up for sale the assets of its business AEATM, which included the gas supply arrangements (commodity and transport) for the TVPS. Aurora Energy made a commercial decision to acquire the AEATM assets for $15 million in order to mitigate gas price risks and to obtain synergies with its NEM retailing operations.
The gas assets acquired through the AEATM purchase included gas commodity and transport arrangements, in addition to those related to the TVPS and tolling arrangements with the Bairnsdale power station in Victoria. The gas arrangements provide Aurora Energy with a growth opportunity in wholesaling gas to major customers in Tasmania and on the mainland and in retailing gas to customers in Tasmania. Aurora Energy returned a $1.8 million loss on wholesale gas trading in 2010.
On a smaller financial scale, Aurora Energy has developed the electrical safety WireAlert10 product and is the Tasmanian Government’s strategic partner in telecommunications, which includes the rollout of the Australian Government’s National Broadband Network (NBN) project. While these activities are less capital intensive (for example, $8.8m has been invested in the WireAlert product with a cumulative loss of $0.6 million), they consume a significant amount of management and board time that reduces time available to focus on functional business activities.
The Panel has not considered in detail the nature and extent of the risks being mitigated through each of these various diversification activities, whether the activity has been the best way of managing risk, nor whether it has resulted in an overall lower risk position.
These matters are for the Shareholders and the businesses as owners and managers of the businesses respectively. However, irrespective of how these kinds of investments are funded, it is important to remember that the capital has opportunity cost in terms of its ability to support General Government Sector service delivery. In this context, the Panel has questioned whether such investments and activities are appropriate investments for government at all, given that, in making them the Government has also accepted that General Government Services will need to be adjusted in the event that they are not commercially successful.
The Panel has observed the outcomes of these diversification activities and concluded that:
Diversifications have provided a major focus for (limited) board and senior management resources.
The Panel has found little evidence in support of the proposition that these business activities have or will generate sufficient improvements in Shareholder value to justify them. Further, there is little evidence that the Tasmanian community, as owner of the businesses, has realised direct value, from these investments though dividends paid.11
10Aurora Energy’s WireAlert product (marketed in Tasmania as Cable PI) is a safety sensor provided to Tasmanian
households in 2009.
11 The Panel believes that this is a key consideration given the difficulties in crystallising the value of capital growth
Through a series of incremental decisions, SOEB business activities have moved away from the primary activity of electricity supply to Tasmanian customers. The extent to which these diversification strategies have changed the risk/return profile in particular of Hydro Tasmania and Aurora Energy is a matter for the Government, as Shareholder, to be aware of and to be satisfied that the resulting risk profiles are consistent with its objectives and expectations for the SOEBs.
There appears to be a lack of clarity around when and how the financial returns from some diversification strategies will be realised by the community. In this regard, a key consideration is whether the financial outcomes of diversification activities reflect the opportunity cost of this capital invested, for example, through higher dividends or the repayment of debt to strengthen the SOEB balance sheet position.
Generally, a consequence of a growth strategy is the medium-term need by the business for capital. This can be in discord with the short-term, year-on-year Shareholder need to withdraw equity through dividends. There is a risk that this tension can compromise the delivery and/or value of the growth strategy.
Future risks and opportunities
Although not analysed as part of the Panel’s review, recent results for the 2011 financial year indicate financial performance across the SOEB portfolio is stronger than it has been during the review period. This is due to a number of reasons. Higher than average water inflows means that Hydro Tasmania has inventory to sell rather than using Basslink to back its contract position; the TVPS is underpinned by regulatory arrangements and Aurora Energy’s contract arrangements with Hydro Tasmania; and Transend has benefitted from a materially better outcome under its current price determination that under previous determinations. The 2011 results also reflect the renewed focus on efficiency.
Nonetheless, the energy market is dynamic and there will always be transitory drivers of value up or down in particular years. Similarly, circumstances reflected in the 2011 results may not continue into the future.
In this sense a historical review of longitudinal financial performance is valuable in that it illustrates what decisions have been made and how choices have affected outcomes.
The SOEBs have generated sufficient cash from operations to ensure that the supply of electricity to Tasmanian customers is maintained and reliability improved. In addition, there has been ‘free cash’ generated that has been applied primarily to capital investment and diversification activities. At the same time, returns to Shareholders have been poor. There is a tension between growth (earnings over time) and return of capital now for the benefit of the community. The community has seen limited tangible financial value from diversification initiatives, notwithstanding the considerable investment they have required.
A common theme throughout the Panel’s broader review, and its investigation into the financial position of the SOEBs, is the lack of a clear view on what the Government is seeking to achieve through its ownership of the SOEBs – for example the extent to which it is for the supply of electricity to Tasmanian customers, or it is to pursue Shareholder value through business operations in other NEM jurisdictions and internationally. A key consideration is whether the risk profile of these wider opportunities is consistent with the risk appetite of government and the Tasmanian community relative to its investment in them and the opportunity cost of that investment and, indeed, whether the anticipated returns eventuate.
Value creating strategies require capital investment. As the Panel has observed, in a general sense the SOEB portfolio is currently debt constrained and Hydro Tasmania and Aurora Energy are targeting credit ratings that will require debt to be reduced or maintained. At the same time, the Tasmanian Government has implemented a dividend strategy that delivers better returns to enable provision of key public services. While the Tasmanian Budget is constrained this is likely to remain in place. A key risk in pursuing non-core value creating strategies is that the associated capital needs exceed SOEB capacity, either through internally generated funds or debt. For example of Hydro Tasmania’s venture into wind asset development could not keep pace with capital requirements and needed to secure an equity contribution from its Shareholders of $50 million.
A key question then is if additional capital is required where is this capital going to be sourced? Or will growth opportunities be forgone due to the lack of available capital, despite the expectation that may have been built around them?
From a Shareholder perspective, there are several key financial risks confronting the SOEB portfolio.
Aurora Energy’s retail business is financially vulnerable to a loss of market share arising from further retail competition; and the cost of operation of the TVPS, in terms of average cost per megawatt hour of output is higher than both the prevailing market prices in Tasmania and the regulated wholesale energy allowance. This leaves Aurora Energy’s energy business highly vulnerable to changes in the regulatory arrangements and re-negotiation of contract arrangements for the non-contestable beyond 30 June 2013; and to the introduction of further retail competition.
Hydro Tasmania remains vulnerable to hydrological risk, although the nature of this risk has changed over time. Both Hydro Tasmania and Transend are vulnerable to a large industrial load leaving Tasmania, in terms of the opportunity value of stranded energy and stranded network assets respectively.
The financial performance of Aurora Energy and Transend’s network businesses is determined by how aligned actual expenditure compares to determined revenue. The regulatory risk to these businesses arises from changes in the regulatory framework or that the regulatory framework does not deliver revenue outcomes that are consistent with board and management’s expectations of expenditure requirements.12
The principal financial opportunity for the SOEB portfolio is the potential increase in value available to Hydro Tasmania from its hydro-generation in light of carbon pricing.13 The application of any increase in value remains a key consideration for the Tasmanian Government. A key question for the Tasmanian community is how much of the additional value from hydro-generation resulting from a price on carbon will be allocated to growth strategies or returned to the Tasmanian community in recognition of its historic investment in those assets.
There is a fundamental tension here between certainty and risk which ultimately fall on Government to resolve. Value returned to the community now can be spent on the provision of public services. Value re-invested in growth opportunities with the SOEBs may return greater value to the community at some time in the future, but neither the quantum nor the time frames for that return are certain.
12 Note the AER’s Draft Determination for Aurora Energy’s distribution business proposes WACC of 8.08 per cent
compared to Aurora Energy’s proposes 10.03 per cent; capital expenditure at $536 million compared to Aurora Energy’s proposed $675 million; and operating expenditure of $311 million compared to Aurora Energy’s proposed $340 million.
13 this environment will further increase the generation costs of the TVPS relative to hydro-generation, but will also
1.
Structure of the Tasmanian Energy Market
Since disaggregation of the Hydro-Electric Corporation (HEC) in 1998, the TESI has experienced major structural, regulatory and investment changes. The Panel’s Discussion Paper ‘The Evolution of Tasmania’s Energy Sector’ provides a detailed discussion of energy sector reform undertaken in Tasmania since 1995. In addition to that paper, the Panel has also previously released the Discussion Paper ‘Tasmania’s Energy Sector – an Overview’14 which provides a detailed discussion on the physical structure of, and main participants in, the TESI.
The Tasmanian Government owns the three primary entities15 in the TESI, Hydro Tasmania, Transend and Aurora Energy, collectively referred to as the SOEBs. Figure 4 below illustrates the corporate structure of the TESI and summarises the various relationships across the portfolio.
Figure 4 - Primary participants in the Tasmanian Electricity Supply Industry, 2011
14These papers are available on the Panel’s website at www.electricity.tas.gov.au.
2.
Financial Flows Through The SOEB Portfolio
There are a number of inter-relationships which govern the functioning of the TESI. These relationships reflect the complexity of financial flows within each SOEB and between the SOEBs.
The diagram below presents a high-level summary of the primary financial flows between the three SOEBs, as well as the intra-entity financial flows among the various business segments within each of the SOEBs.
Figure 5 - 2010 Inter and intra entity financial flows within the SOEB portfolio
Note: Some of the key financial flows have been omitted to preserve commercial confidentiality.
There are two major inter-entity financial flows within the SOEB portfolio, namely:
wholesale energy contracts between Hydro Tasmania and Aurora Energy for both contestable and non-contestable customers; and
the pass-through of transmission charges from Transend to Aurora Energy. Energy sector reform has influenced the complexity of intra-entity financial flows within both Hydro Tasmania and Aurora Energy, as each business has diversified business operations resulting in more vertically integrated entities than those that were in place at disaggregation.
2.1.
The Two Major Inter-SOEB Financial Flows Relate to Energy and
Transmission
2.1.1.
Wholesale Energy
Given Hydro Tasmania’s dominant position in the Tasmanian wholesale energy market, and Aurora Energy’s dominant position as the incumbent retailer, coupled with its direct participation in the wholesale energy market through the TVPS, there are several financial interrelationships between the two SOEBs through the wholesale energy market.
The contractual arrangements between the two entities under which Aurora Energy contracts for wholesale energy to service its contestable and non-contestable load are the primary form of financial interrelationship. The foundation on which these financial relationships are based differ, which is explained below.
Wholesale contracting for non-contestable customers
Prior to the commissioning of the TVPS in 2009, Hydro Tasmania provided Aurora Energy’s wholesale energy contracts for its non-contestable customer base. The total value of this relationship was based on the wholesale energy allowance provided to Aurora Energy under the Price Control Regulations16 (PCRs). Typically, the contract arrangements struck between Hydro Tasmania and Aurora Energy for these customers saw the full value of the allowance captured by Hydro Tasmania. Aurora Energy did not secure any ‘additional margin’ in excess of the allowed retail margin through ‘savings’ on the wholesale energy cost.
The nature of these arrangements has changed materially. The first significant change was that, following the negotiation of its hedge arrangement with Alinta backed by the TVPS, Aurora Energy no longer sought to contract for the full non-contestable load exclusively with Hydro Tasmania. Following acquisition and completion of the TVPS, Aurora Energy has subsequently has utilised the output of the TVPS, to cover around half of the non-contestable customer load.17
16 See the Panel’s Information Paper ‘Tasmania’s energy sector – an overview’ available on the Panel’s website
www.electricity.tas.gov.au.
17 Refer the Information Panel’s Paper ‘Tamar Valley Power Station: Development, Acquisition and Operation’
The second major change is that Hydro Tasmania is no longer capturing all of the ‘value’ inherent in the wholesale energy allowance for the volume under its contract. Some of this value has been captured by Aurora Energy, which assists it with the financial consequences of owning and operating the TVPS and results in a substantial transfer in value available under the regulatory arrangements from Hydro Tasmania to Aurora Energy, by comparison with earlier arrangements.18
Contracting for contestable customers
With Aurora Energy’s commercial decision to utilise the TVPS capacity to part-back its non-contestable customer load requirements, Aurora Energy, like other retailers operating in the Tasmanian market, seeks wholesale contracts with Hydro Tasmania to back offerings to contestable retail customers. Contestable retail contracts will typically reflect the underlying wholesale cost of electricity (i.e. are usually ‘cost plus’). All retailers, including Aurora Energy, may choose to take differing levels of spot market exposure or use different risk mitigation products (e.g. combinations of hedges and caps) to back retail positions. These strategies have differing costs and risk profiles, and could result in a different wholesale energy cost estimate on which retailers could price retail contracts, even if all retailers are faced with a common wholesale energy contract offering from Hydro Tasmania.
The Panel understands that where its retail position is not backed by generation, Aurora Energy seeks to minimise its spot market exposure due to market volatility in Tasmania, so that there is a large degree of financial interconnectedness between Aurora Energy and Hydro Tasmania in relation to contestable customers through wholesale energy contracts for contestable customers.
Spot Market
All retailers and generators face a degree of spot market exposure, even in light of a high level of contracting, as end customer loads are variable and difficult to predict. This also applies to the availability of generating plant.19.
18 The wholesale energy allowance for regulated customers is determined through the Regulator’s price
determination. To the extent that the wholesale energy allowance is greater than the prevailing market price for electricity ‘value’ is created. How this value is allocated depends on the contracting arrangements between Aurora Energy and its supplier. Prior to July 2010, the contractual arrangements between Aurora Energy and Hydro Tasmania for backing the regulated customer base consistently allocated all of the value to Hydro Tasmania (i.e. the contact ‘price’ reflected the wholesale energy allowance). Aurora Energy received no additional margin on its retail business for any ‘savings, on the cost of wholesale energy. From July 2010 to July 2012, the contractual arrangements between Aurora Energy and Hydro Tasmania for the cost of wholesale energy supplied to meet the regulated customer load (52 per cent of load) is lower that the wholesale energy allowance, transferring this value to Aurora Energy. Aurora Energy applies this ‘value’ to offset the cost of energy supplied by the TVPS through its tolling arrangements (48 per cent of load) which is higher than the wholesale energy allowance. The changes to the Price Control Regulations in 2010 were made to enable the Treasurer to determine the arrangement between Hydro Tasmania and Aurora Energy should they not be able to reach a commercial arrangement. This regulatory intervention was not utilised as the parties reached a commercial decision.
19 A load following or whole-of-meter swap will provide full cover for a retailer against the spot price, but these are
As Hydro Tasmania’s generation business and Aurora Energy’s retail business are on the opposite sides of the buy/sell transaction in the spot market, there can be material value shifts between the businesses arising from spot market outcomes on a half-hourly basis. In circumstances where Aurora Energy has fixed-price supply obligations to retail customers and an exposure to the spot market, spot prices above the assumed rate within the retail contract will shift value away from Aurora Energy and to Hydro Tasmania (assuming it has a similar spot market exposure). Generally, to the extent that Hydro Tasmania is able to capture additional value from spot market activities this will generally see a value shift from wholesale market buyers, including Aurora Energy20, to Hydro Tasmania.
From an overall SOEB portfolio perspective, improving returns from one part of the portfolio derived through the spot market can be offset by directly poorer returns from another part of the portfolio, noting that respective businesses may have different exposure to the spot market and therefore different risk profiles.21
TVPS
With the commissioning of the TVPS, there is now an additional financial interconnection between Aurora Energy and Hydro Tasmania. Depending on the contracting and operating profile of the TVPS, Aurora Energy has simultaneous financial interests in both the sell and buy side of the Tasmanian spot market. In some circumstances, this can act as a ‘natural hedge’ by effectively insulating part of Aurora Energy’s exposure to the market by being on the ‘opposite side’. For example, if Hydro Tasmania is able to take advantage of commercial opportunities in the spot market (for example, owing to unexpected demand by customers pushing volumes higher than contracted volumes) to the extent that it is under-contracted, Aurora Energy could be exposed to the spot market. If the TVPS is also operating at that time and is also under-contracted, it would benefit from the higher spot price – offsetting some of the negative impact on the retail business.22 Similarly, if Aurora Energy is over contracted and spot prices were low it would have a negative impact on its energy business.
20 And also includes other retailers and large customers with spot market exposure.
21 Some value can be lost from the SOEB portfolio to customers from this spot market activity, which is addressed by
the Panel in its Draft Report.
2.1.2.
Transmission use of System Charges
The second major inter-SOEB financial flow relates to Transend’s TUOS charges. TUOS charges are derived from the following sources:
1. TUOS charges paid by Aurora Energy (and potentially other retailers) to Transend for non-direct connect customers (predominantly residential and business customers). These TUOS charges are passed through to users in the electricity retail price;
2. TUOS charges paid by Aurora Energy (and potentially other retailers) to Transend for direct connect customers (primarily large businesses). These TUOS charges are passed through to users as a separate component of their electricity bill; and
3. Direct connect charges paid by major industrials and generators (Hydro Tasmania and the TVPS) directly to Transend.
The transmission component of electricity charges to customers represents a pass-through cost to Aurora Energy – both its revenues and costs incorporate transmission costs and it receives no value from that proportion of revenue that corresponds to the transmission charges.
2.2.
Significant Intra-SOEB Financial Flows are a Consequence of
the Increasing Complexity of Hydro
Tasmania’s and
Aurora Energy’s Business Activities
The current complexity of the financial flows within the SOEBs has been influenced by energy sector reform, particularly Tasmania’s entry into the NEM and more recently, the commissioning of the TVPS.
2.2.1.
Aurora Energy
Among the SOEBs, Aurora Energy has the most complex intra-entity financial flows. These are mainly attributable to:
The pass-through of network charges, (TUOS and DUOS) from its distribution business to its retail business; and
The acquisition of the TVPS and associated gas supply contracts which have led to the establishment of AETV and the creation of Aurora Energy’s integrated energy business.
Distribution Business:
The distribution business, while generating approximately 40 per cent of Aurora Energy’s total revenue, contributes approximately 90 per cent of total earnings margin (EBITDA23). The distribution business passes through the regulated charges for both the distribution and transmission networks to Aurora Energy’s retail business (and other retailers) for on-charging to customers. The network component (distribution and transmission) of the regulated electricity price has increased significantly during the last decade driven mainly by capital investment and the consequential increase in the value of both the distribution and transmission regulated asset bases.
The balance sheet strength of the distribution business, and the cash flows that it generates, support Aurora Energy’s energy business and its retail business (in a financial, rather than a regulatory sense) and non-core activities. Aurora Energy’s energy business and retail business also benefit from a stronger credit rating than would be achieved on stand-alone basis. Conversely, Aurora Energy’s distribution business is exposed to higher debt costs as a result of the energy business than would be the case on a stand-alone basis.
Wholesale Energy Business:
The primary function of the energy business is the wholesale purchase of electricity on behalf of the retail business; and the wholesale purchase and trading of gas for the TVPS operation, the Bairnsdale power station and for resale to large gas customers.
Aurora Energy has implemented two tolling arrangements between the energy business and AETV, the entity which owns the TVPS. These tolling arrangements effectively transfer the rights and obligations associated with the pool income from the generation of TVPS from AETV to the energy business in return for tolling fees to produce and dispatch electricity from the gas provided by the energy business at the discretion of the energy business.
With the Government-directed purchase of the TVPS, Aurora Energy acquired a suite of gas supply contracts to ensure the security of supply of gas to operate the TVPS. Aurora Energy subsequently entered into a separate commercial transaction to acquire a portfolio of gas supply, transport and sales arrangements (including the contracts for the supply of gas to the TVPS) from Babcock and Brown Power (AEATM). With these arrangements Aurora Energy is the principal supplier of gas for industrial and retail purposes in Tasmania (including its own retail gas business and to supply the TVPS). Aurora Energy also wholesales gas in other jurisdictions and has a tolling arrangement with the Bairnsdale power station, including the supply of gas.
23 Earnings before interest, depreciation and tax – this is a measure of operating cash flows. Broadly, it provides an
2.2.2.
Hydro Tasmania
Hydro Tasmania’s significant intra-entity flows relate to diversification of business activities on the back of hydro-electricity generation.
Over 2009 and 2010, Hydro Tasmania acquired the retail business, Momentum Pty Ltd (Momentum). Momentum is located in Melbourne with customers in Victoria, New South Wales, Queensland, the ACT and South Australia.24 Wholesale energy pricing arrangements between Hydro Tasmania and Momentum provide opportunities for Hydro Tasmania to allocate margins and risks between itself and Momentum in relation to electricity and Renewable Energy Certificates (RECs). Hydro Tasmania has advised