1
CENTRE FOR EMEA BANKING, FINANCE & ECONOMICS
Concentration and Efficiency in the Vietnamese
Banking System Between 1999 and 2009: a
Structural Model Approach
Thao Ngoc Nguyen
Chris Stewart
Working Paper Series
No 12/37
2
Concentration and efficiency in the Vietnamese banking system between 1999 and 2009: a structural model approach1
Thao Ngoc Nguyen2
London Metropolitan Business School, London Metropolitan University
Chris Stewart
London Metropolitan Business School, London Metropolitan University
Abstract
The purpose of this paper is to examine the degree of concentration and efficiency in the Vietnamese banking system using the structural model. We apply the concentration ratio (CR), Herfindahl-Hirschman Index (HHI) and concentration-profitability model based upon the Structure-Conduct-Performance (SCP) and Efficiency Hypothesis (EH) approaches to examine 48 Vietnamese commercial banks over the period 1999-2009. This is the first such study of the Vietnamese banking system. Our empirical results show that the Vietnamese banking industry has become substantially less concentrated, however large commercial banks still dominate the whole banking system. Further, our results do not support either the traditional Structure-Conduct-Performance or the Efficiency Hypothesis.
Keywords: Banking; Concentration; Efficiency; Structural model; Herfindahl-Hirschman Index; Vietnam.
1
We are grateful to Roman Matousek for his helpful comments on an earlier version of the paper. Any remaining errors are the responsibility of the authors.
2
Corresponding author: Thao Ngoc Nguyen, London Metropolitan Business School, London Metropolitan University, 84 Moorgate, London EC2M 6SQ, Email: [email protected].
3
1. Introduction
Vietnam has become one of Asia's economic success stories in recent years, averaging growth of 7.8% a year. During previous years, the banking system provided capital for the economy, contributing approximately 16% to 18% of GDP annually which was almost equivalent to 50% of the total capital invested in the whole country since the transition in 1986. Hence, the banking system had developed strongly and played a crucial role as the connection between production, consumption, and savings. However, Vietnamese finance has had its problems, for example, during the 1997 Asian and 2008 Global crises. The domestic banking system still suffers from a lack of capital, inadequate provisions for possible loan losses, low profitability, inexperience of the capital markets, low pace of institutional reform (Dinh TTH and Kleimeier, 2007) and high dependence on governmental policies compared to foreign banks.
The objective of this study is to provide for the first time a comprehensive application of the extended structural models to the Vietnamese banking system. Using structural models we will examine how profitability is affected by market concentration (Structure-Conduct-Performance) or market share (Efficiency Hypothesis). The structural model consists of the Structure-Conduct-Performance (SCP) and Efficiency Hypothesis (EH) approaches (Weiss, 1974; Smirlock, 1985; Lloyd-Williams et al., 1994 and Molyneux and Forbes, 1995). The SCP approach examines whether a highly concentrated market causes collusive behaviour among large banks and whether it improves market performance. In contrast, the EH approach assesses whether efficient behaviour of large banks leads to an improvement in market performance.
This paper’s principal contributions are empirical. We employ the concentration-profitability model (SCP and EH approaches) to examine 48 Vietnamese commercial banks over the full sample (1999–2009) and four sub-samples (1999–2003; 2004–2009; five State Owned Commercial Banks (SOCBs) and 43 Non-State Owned Commercial Banks (non-SOCBs)). No previous study of the Vietnamese banking system has used the SCP or EH approach or
4 utilised concentration ratios or HHIs. This is the main contribution of our paper. Further, we use 3 measures of market share and the concentration ratio based upon customer deposits, total assets and customer loans. For the concentration ratio we also consider 3-bank and 5-bank ratios. Such a variety of measures have not been employed by previous studies 5-banking system studies – see, for example, Barth et al., (2001, 2004). In our models revenue over total assets, interest income over total assets and profit before tax over total assets are our dependent variables. Other environmental factors such as capital/assets, loans/deposits and number of branches are included in the model to account for risks, cost and size.
The rest of this paper is structured as follows. The next section details developments in the Vietnamese banking system in the period from 1986 to 2009 while section 3 contains a brief review of the previous empirical literature of the structural model in banking. Section 4 deals with methodology and data, empirical results are presented in section 5 and section 6 gives conclusions.
2. The Vietnamese banking system during 1986-2009
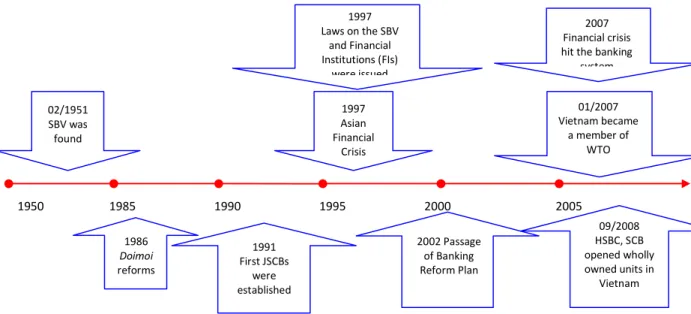
From 1986 to 2009 the Vietnamese banking system was transformed from a mono to two-tier banking system. The two-two-tier banking system has the State Bank of Vietnam (SBV) as the central bank (tier 1) and four specialised state owned banks (tier 2), see Figure 1. The Vietnamese banking system was not affected by the 1997 crisis as drastically as other countries. The door for free international capital mobility was narrow. Foreign exchange transactions were maintained under control. In the 2008 Global crisis, there were still economic difficulties due to excessively rapid growth (average 7.8% a year from 2001 to 2007). These induced the government to concentrate on the regulatory environment. The banking system encountered many difficulties, resulting from loss of balance in the source and use of funds, and the rapid increase in credit growth. On this basis many banks were affected by tightening monetary policy. Compulsory measures were necessary for banks to reorganise and strengthen their organisations.
5 Table 1 shows the number of Vietnamese commercial banks from 1990 to 2009. With extended networks in almost all provinces and larger cities, SOCBs have a competitive edge in providing banking services. Although joint stock commercial banks (JSCBs) increased their numbers immediately after their appearance in 1990 (in 2009 there were 37 banks), the leading positions in the market still belong to SOCBs. The rising numbers of branches of foreign banks (BFBs), from 18 banks in 1995 to 48 banks in 2009, explained the demand for foreign companies on banking services. However, each BFB normally has one branch in either Hanoi or Ho Chi Minh City. Hence, the assets, loans and deposits are small compared to SOCBs and JSCBs. Despite Foreign Direct Investment (FDI) in US dollar (USD) terms growing eight times from 1990 to 2005, foreign companies are still hesitant as whether or not to choose domestic banks when they enter this new market. The number of joint venture commercial banks (JVCBs) has slightly increased from four to six banks between 1995 and 2009.
Figure 2 shows that non-performing loans to outstanding total loans (NPLs/TLs) in the Vietnamese banking system increased from 9.3% in 1996 to 13% by the end of 1998, and decreased in the next seven years to 2.85% in 2004. The proportion of non-performing loans plunged sharply to 3.17% in 2005. Non-performing loans over total loans were quite low in this period. With the high development of the economy, non-performing loans decreased from 2.6% in 2006 to 1.5% in 2007. Due to the financial crisis in 2008 non-performing loans rose to 2.13% in 2008 before falling slightly to 1.99% in 2009.
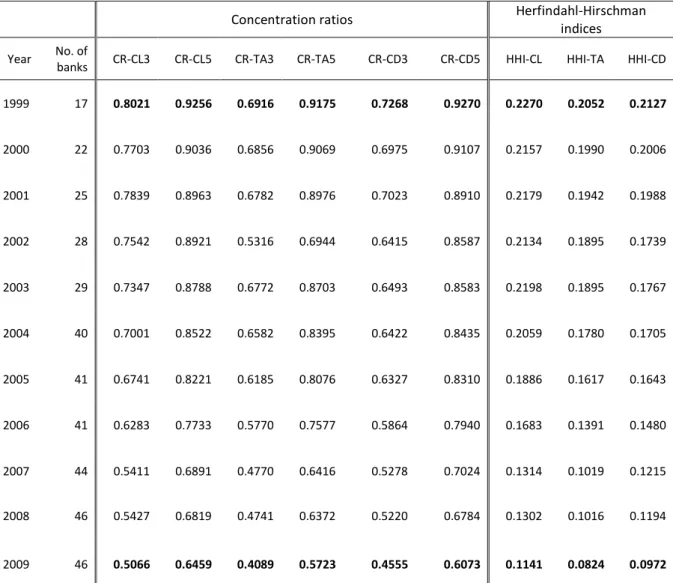
Table 2 reports Herfindahl-Hirschman Index (HHI) and concentration ratio (CR) of the Vietnamese banking system from 1999 to 2009. The highest CR uses the customer deposits measure involving five banks (denoted CR-CD5) which was 92.70% in 1999, suggesting that these five banks dominated the banking industry in 1999. By 2009 CR-CD5 had fallen dramatically to 60.73%. The corresponding 5-bank CR measured using customer loans, CR-CL5, (total assets, CR-TA5) also fell steeply from 92.56% (91.75%) in 1999 to 64.59% (57.23%) in 2009. Similar substantial declines in CR are also observed for the 3-bank measures based on customer deposits (from 72.68% in 1999 to 45.55% in 2009), customer loans (80.21% to
6 50.66%) and total assets (69.16% to 40.89%). For all measures the CR fell by approximately 30 percentage points suggesting a massive reduction in concentration over the period. Nevertheless, concentration still remained high in 2009 with all measures of the concentration ratio exceeding 40%. The HHI provides the same inferences. They gradually reduced from 1999 to 2009 as small and medium sized banks increased their share of customer loans, total assets and customer deposits in the system. In 1999, HHI-CL, HHI-TA and HHI-CD were 0.2270, 0.2052 and 0.2127, respectively. After 10 years, these indices fell to about half of their level in 1999, being 0.1141, 0.0824 and 0.0972, respectively. On the whole, the overall downward trend of the CRs and HHIs suggests that the Vietnamese banking industry has become notably less concentrated between 1999 and 2009 (the reduction is by approximately 10% a year). However, large commercial banks still dominate the whole banking system.
There are changes regarding non-SOCBs and SOCBs in terms of customer loans, total assets and customer deposits over the period. Non-SOCBs start to expand their total assets and offer customers both low-rate loans and high-rate deposits. On the other hand, SOCBs start to transform into non-SOCBs. The increase in the number of banks and decreased market concentration may suggest that banking service choice is increasing. Indeed, the growth in branch networks in many banks appears to reflect this trend. In addition, the growth of non-traditional banking services (such as through the stock exchange), derivative products, internet banking, phone banking, credit cards, ATM and so on also indicate that overall choice grew during this period.
3. Measuring performance using the structural model
The structural model consists of the Structure-Conduct-Performance (SCP) and Efficiency Hypothesis (EH) approaches. The SCP approach uses a model that can examine whether a highly concentrated market causes collusive behaviour among large banks and whether it improves market performance. In contrast, the EH approach is used to determine whether the efficient behaviour of large banks leads to an improvement in market performance. The
7 difference between the SCP and EH approaches is not in the relationship between market structure, conduct and performance, but rather the connection between concentration and profit under public intervention to reach a competitive goal. The main idea of the EH is that an industry will become more concentrated under competitive conditions if some firms expand output. Such expansion will increase the degree of concentration at the same time that it increases the rate of return. The result may be better products that satisfy demand at a lower cost. In this case efficient firms tend to achieve a larger market share, leading to increased concentration of the industry. The success of firms will be reflected in higher returns and stock prices, not higher input prices (Demsetz, 1973 and 1974)3. After Demsetz a number of researchers embraced the EH, for example, McGee (1974), Smirklock (1985), Jovanovic (1982), Carter (1978), Brozen (1970) and Phillips (1976) amongst others. Some economists were undecided regarding the two approaches, including Schamalensee (1985) and Eckard (1995). In essence the EH is a criticism of the SCP approach on concentration, if it is still based on the SCP paradigm of explaining structure.
The non-structural method, defines bank structures as perfect competition, monopolistic competition or monopoly. Banking researchers might access three characters of market structure: concentration, product differentiation and entry barriers. It is widely accepted that the measurement of bank performance and the measurement of market structure are different but parallel to each other.
In bank performance, profitability (measured as return on assets and return on capital) is the preferred performance measure being used 38 times out of 133 cases that are considered (Molyneuxet al., 1996). Profitability measures succeed in finding a significant relationship between market structure and industry performance. For market structure, concentration is commonly used (95 times) due to its easy quantification. Typical profitability-concentration studies include Weiss (1974), Smirlock (1985), Rhoades (1985), Berger and Hannan (1989), Molyneux and Thornton (1992), Lloyd-Williams et al. (1994)and Molyneux and Forbes (1995).
3
Demsetz is among those from the Chicago School (Stigler, 1968; Posner, 1979; Reder, 1982) that queried a challenge to Professor Joe Bain that used another explanation about structure, called the Efficiency Hypothesis (EH).
8 Most of the studies in the USA found evidence of a positive relationship between market share and profitability whereas studies in Europe generally suggest a positive relationship between concentration and profitability. Smirlock (1985) employed data of 2,700 US banks in seven states from 1973 to 1978. The model includes a set of control variables which reflect the differences in the size and growth of the banking sector, changes in capital resources, bank scale and the alliance with the holding corporation. Smirlock (1985) favoured the efficiency hypothesis. Evanoff and Fortier (1988) used data of more than 6,300 US banks in 30 states in 1984. They examined the effect of regulation on bank performance by dividing the market into those with high entry barriers and those with low entry barriers. In markets with high entry barriers market share has a strong impact on profitability. However, in markets with low entry barriers market growth has a significant and negative effect on bank profitability. In general, their results support the efficiency hypothesis. Berger and Hannan (1989) analysed data of 470 banks in 195 local US banking markets. They analysed the relationship between market concentration and profitability using non-competitive pricing behaviour. The empirical evidence indicates a negative link between market concentration and deposit interest. In other words, banks in a highly concentrated market exercise market power by paying low deposit interest.
Molyneux and Thorton (1992) investigated the determinants of bank performance across 18 European countries between 1986 and 1989. They used a variety of profitability measures including before and after tax returns on total assets and the return on total equity. Generally, they found that market concentration has a positive impact on profitability. Lloyd-Williams et al. (1994) found that market share was either negatively related to profit or insignificant when included with a three-bank concentration ratio variable (which was positively related to profit) in their study of Spanish banks in 1980s. The results generally favoured the SCP hypothesis. Molyneux and Forbes (1995) used data for banks from 18 European countries from 1986 to 1989. Their findings also supported the traditional SCP approach. Their results suggest that concentration in the European banking market lowers the cost of collusion between firms and results in higher profits for all market participants.
9 Only a few researchers have analysed Vietnam’s banking performance using concentration ratio (bank sizes) from reports of the SBV. Disappointingly, most of the indices on customer deposits, total assets and customer loans are limited for Vietnam. The problem of data collection made it difficult for researchers to investigate the issue through parametric models or non-parametric methods. No previous study has explicitly considered Vietnam’s banking performance using the structural model (SCP or EH approaches). Barth et al. (2001) is a valuable report about regulation and supervision of banks around the world. Building on this work and other sources, Kousted et al. (2005) examined the market structure of Vietnam using concentration ratios. He argued that the Vietnamese banking sector is less concentrated than that of average developing countries. The degree of government ownership in the Vietnamese banking sector is very high compared to both other countries in the region and to the average level in developing countries. Barth et al. (2004) used deposits of five banks in concentration ratio. He indicated that a higher degree of state ownership tends to be associated with lower bank efficiency, less saving and borrowing, lower productivity and slower growth. The share of deposits of the five largest banks held by government-owned banks was 80% before 2001 (when they accounted for only 10% of the total of banks at that time). Barth et al. (2004) also found that tighter entry restrictions tend to increase overhead costs; the likelihood of a major banking crisis is positively associated with greater limitations on foreign bank participation.
In general, bank structure in Vietnam has not been analysed for a large number of banks and long period of time using parametric or non-parametric methods. Hence we extend the current research of Vietnamese bank structure in several ways. Firstly, we use three factors, customer deposits, total assets and customer loans, in either 3-bank or 5-bank ratios that reflect features of the Vietnamese banking system but have not been employed by previous studies. Secondly, we model and estimate revenue over total assets, interest income and profit before tax over total assets as the dependent variables. We will try to show, using the structural models, how the profitability measure is affected by market concentration (Structure-Conduct-Performance) or market share (Efficiency Hypothesis). Moreover, this is the first time that an extensive panel data set has been employed to examine the
10 Vietnamese banking system. Our data set includes48 Vietnamese commercial banks over the period 1999 to 2009.
4. Methodology and data
Concentration-profitability in the SCP model will be employed to consider the banking structure of Vietnam. The motivation of this section is to answer the question of whether the Vietnamese banking market is collusive or efficient. An important contribution we make to the structural method is that we use 6 measures of CR based on the three factors, customer loans, total assets and customer deposits in both 3-bank and 5-bank ratios. No previous study of the Vietnamese banking system, such as Barth et al. (2001, 2004), has used all 6 measures. Barth et al. (2001, 2004) and Kousted et al. (2005) employed only 5-bank customer deposit measures in their research of concentration ratio. Variables that capture other environmental factors such as capital/assets, loans/deposits and the number of branches are included in our model to account for risks, cost and size. Following Weiss (1974), Smirlock (1985), Lloyd-Williams et al. (1994) and Molyneux and Forbes (1995) we will test the performance of the Vietnamese banking system by estimating the profit equation below:
∑
= + + + = n j it j j t it it a a MS a CR a Z 3 , 2 1 0 π (1)where
π
it is a measure of bank i’s profit in period t,MSit is a measure of market share,CRtdenotes market concentration and Zj,it is a vector of j control variables which are included to account for firm-specific and market-specific characteristics. From (1), if:
• a1 >0and a2 =0: banks with a relatively high market share are more efficient than their rivals and earn rents because of this efficiency while increased market
11 concentration does not result in banks earning any monopoly rents. This supports the efficiency hypothesis.
• a1 =0and a2 >0:market share does not affect bank rents and rents reflected in higher profitability are monopoly rents that result from increased market concentration. This supports the traditional SCP hypothesis (Smirlock, 1985).
For testing purposes, we cast model (1) in empirical form, as follows:
) ln( ) ln( ) ln( 5 , 6 , , , 4 , , 3 2 , 1 0 , it it t i t i t i t i t t i t i a TA a BR CD CL a TA TC a CR a MS a a ROA = + + + + + + (2)
where, ln(ROAi,t)is the natural logarithm of the return on assets (used to measure a bank’s performance). We consider three measures of performance (ROAi,t)as follows: the natural logarithm of revenue divided by total assets
t i t i TA REV , ,
ln , the natural logarithm of interest
income divided by total assets
t i t i TA INT , ,
ln and the log of (one plus) profit before tax divided
by total assets + t i t i TA PBT , , 1
ln .4Market share
(
MSi,t)
is measured as the percentage of industry sales of a particular company or product and captures bank efficiency (Smirlock, 1985; Molyneux and Forbes, 1995). We use the following 3 measures of market share: the total loans of bank i divided by total banking sector loans in year t (MS-CL), the total assets of bank i divided by total banking sector assets in year t (MS-TA) and the total deposits of bank i divided by total banking sector deposits in year t (MS-CD). The concentration ratio( )
CRtindicates the relative size of the largest firms in relation to their industry as a whole. We consider 6 measures of market concentration based on three-bank and five-bank loans,
4 Because t i t i TA PBT , ,
can take on (small) negative values, we compute the dependent variable as
+ = t i t i t i TA PBT ROA , , , ln1
12 assets and deposits. The control variables
( )
Zj,it are included to account for other risk, cost, size and ownership characteristics. Since the performance measure, ROAi,t, is not risk adjusted, we will employ the two following variables to account for firm-specific risk, thecapital to total asset ratio
t i t i TA TC , ,
and the customer loans to customer deposits ratio
t i t i CD CL , ,
,see Lloyd-Williams et al.(1994) and Molyneux and Forbes (1995). Ln(TAi,t)is the natural logarithm of a bank’s asset size which is included as a control variable to account for cost and capital ratio differences related to bank size and to control for the possibility that large banks are likely to have greater product and loan diversifications than smaller banks. This increased diversification implies less risk and hence a lower required rate of return (Smirlock, 1985).
)
ln(BRi,t is the natural logarithm of the number of bank branches.
In this paper, annual individual balance sheets and income statements of 48 Vietnamese commercial banks from 1999 to 2009 have been collected from the SBV, Bloomberg, National Library of Vietnam and individual banks. This data set accounts for more than 90% of total customer loans, total customer deposits and total assets. Five of the 48 banks are SOCBs, five are JVCBs, one is a foreign commercial bank (FCB) and the remaining 37 are JSCBs. Several banks established in 2008 and 2009 are included in the data. The number of records ranged from a low of 17 banks in 1999 to a high of 46 in 2009. Banks also have differing frequencies of years in the data – see Table 1. There are sixteen banks with data for all years; twelve banks with 4–8 years of data; fourteen banks with 5–7 years of data and five banks with 2–4 years of data (of which three banks were established in 2008 and one bank was founded in 2006). Only one bank (which was transformed from a branch of a foreign bank to a foreign commercial bank in 2008) has one year of data.
5. Empirical results
Table 3 to Table 5 report the estimated revenue and profit equations using the various concentration ratio (CR) and market share (MS) measures for the full sample. Table 3 reports
13 the results for the CR and MS measures based on customer loans while Table 4 and Table 5 give the results using measures based on total assets and customer deposits, respectively. All models are estimated using the cross-sectional fixed-effects estimator5. 1
0
H refers to the F-test of the null hypotheses that cross-sectional fixed-effects are redundant. All of the F-F-tests reject the exclusion of cross-sectional fixed-effects and so the one-way fixed-effects model is favoured and used for inference. In addition to the CR and MS covariates are the control variables. The R2 (denoted R2) and Adjusted R2 (Adj. R2) are reported below the control variables. The F-statistic (F-sta.) testing the overall explanatory power of the model and number of observations (Obs.) are given at the bottom of the tables.
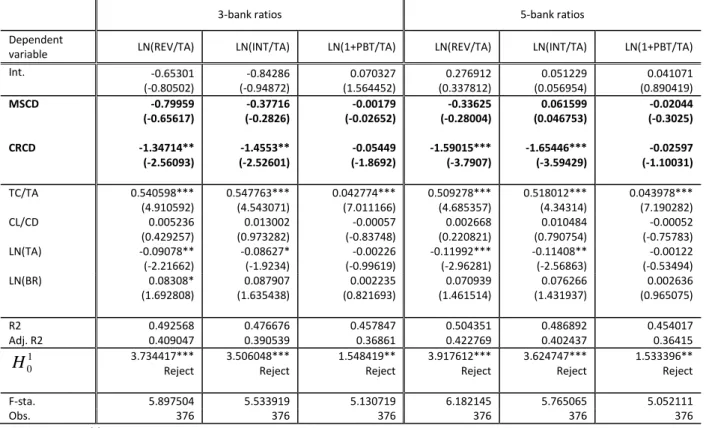
For the full sample (Tables 3 to 5), the coefficients on CR are always negative and generally significantly different from zero while those on MS are always insignificant.6Hence, MS does not affect banks’ revenue, interest income or profit before tax and so banks with a higher market share are not earning greater profits because they are more efficient. Further, CR generally has an unexpected negative (or zero) effect on a bank’s revenue and profit before tax. This does not support the notion that profitability is raised due to collusive behaviour resulting from increased concentration. Thus, our results do not support either the traditional SCP or efficiency hypotheses. However, our results could suggest that the business strategies of Vietnamese banks during this period were focussed on raising capital, loans, assets, deposits, branch networks and reducing non-performing loans. In this case banks appear to focus on increasing their size (loans, deposits, assets, branch networks) and other services (stock exchange, derivative products, internet banking, phone banking, credit cards and ATM). Thus, revenue, interest income and profit are not the most propriety missions of banks.
5
We cannot apply the two-way fixed-effects estimator (including both time period and cross-sectional fixed effects) because the CR variable (which only varies through time) would be perfectly collinear with the period fixed effects. Unreported pooled OLS estimates of the models are available upon request. These are not reported in the tables because the fixed-effects estimator is always preferred to the pooled OLS estimator.
6
In 11 (14) out of the 18 regressions CR is negative and significant at the 5% level (10%) level. CR is always negative and insignificant using the customer loans measure (Table 3) and generally significant using customer deposits (Table 5). Using the total assets (Table 4) measure CR is often insignificant.
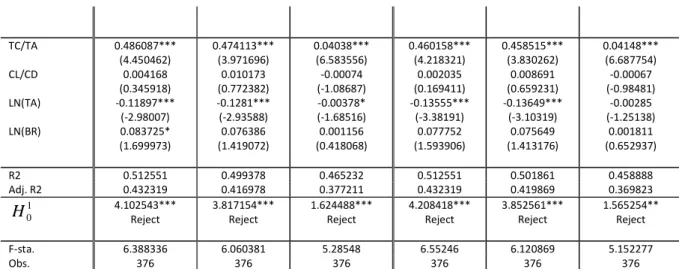
14 Regarding the other variables, TC/TA is always positive and statistically significant. This implies that the capital/asset ratio has a positive relation with revenue, interest income and profit before tax. In reality, all the banks increased their capital due to the Decree No. 141/2006/CP of the government7. CL/CD is insignificant in all the models. LN(TA) is negative and significant when LN(REVTA) and LN(INT/TA) are the dependent variables and the CRs are measured using customer deposits and customer loans. In contrast, LN(TA) is insignificant when CRs are measured with total assets and when LN(1+PBT/TA) is the dependent variable. LN(BR) is always positive and sometimes statistically significant. Hence, there is some evidence that revenue and profit also grow when banks increase the number of their network branches.
Table 6 summarises the unreported estimation results (available from the authors on request) for the full sample and the 4 sub-samples:1999–2003; 2004–2009; five SOCBs and 43 non-SOCBs. The results for the full-sample are similar to the sub-sample for 2004-2009 and for 43 non-SOCBs in that there is generally no relation between MS and revenue, interest income and profit before tax while there is a negative relation between CR and all three dependent variables (although the evidence is more ambiguous). Further, revenue, interest income and profit before tax of Vietnamese banks increase when CR decreases for the samples 1999-2009, 2004-2009 and non-SOCBs. For the sub-sample 1999 – 2003 both CR and MS are generally insignificant with the models using total assets and customer deposits. CR and MS are often negative and significant with the models based upon the customer loans measures. Generally, banks’ revenue, interest income and profit are not from loans but other sources such as derivative products, international settlements, credit cards and other services. When banks expand their loans from 2004 to 2009, revenue and interest income decrease. There is almost no relation between CR and revenue, interest income and profit before tax for the five SOCBs, while MS is significant and has a negative relation with revenue and interest income but not with profit before tax. Regarding the control variables, TC/TA is positive and significant. CL/CD and LN(TA) are generally insignificant or negative and significant8. The effect of LN(BR) differs depending on the samples. Overall, our results do not
7
To guarantee the competitive ability of domestic banks after joining the World Trade Organization (WTO), the government issued Decree No. 141/2006/CP dated 22nd November 2006 to define legal capital for commercial banks as 1,000 billion VND and 3,000 billion VND in 2008 and 2010 respectively.
15 support either the traditional (SCP) or efficiency hypothesis (EH) for the sub-samples or the full sample.
6. Conclusion
This study has examined the SCP and EH models in order to analyse the Vietnamese banking system. The SCP hypothesis is the approach through which the influence of market structure on firms’ performance is examined (Goddard et al., 2001). If the banking industry is almost monopolistic the degree of competition is low and banks can indulge in collusive behaviour. Consequently, a reinforcement of regulation on the part of the government would be recommended in order to prevent the abuse of market power by a small number of firms. In contrast, the method developed by members of the Chicago school, such as Demsetz (1973), is the EH. According to this approach a positive relationship between concentration and profitability does not necessarily reflect collusive behaviour by several firms rather it shows that large firms come to earn high profits by performing efficiently. According to this concept the profitability measure is affected not by market concentration but by market share, because efficient firms can increase their market share and earn high profits even in a competitive and low-concentration market. This idea implies that the governmental regulation and intervention are inappropriate policies since they might impose penalties on efficient firms and discourage the proper functioning of the market mechanism. We also note that there were no substantial studies that applied the SCP and EH structural models to the Vietnamese banking system. The problem of data collection has made it difficult for researchers to investigate the issue through parametric models or non-parametric methods.
In terms of the empirical contribution to the international research, our study is the first time that the concentration ratio (CR), Herfindahl-Hirschman Index (HHI) and concentration-profitability models (SCP and EH) have been employed to explain the performance of the Vietnamese banking system. We do this by considering a sample of the whole banking
8
CL/CD is negative and statistically significant when the dependent variables are LN(REV/TA) and LN(INT/TA) in the sub-sample 2004-2009, which indicates that loan/deposit ratio has a negative impact on revenue and interest income from 2004 to 2009.
16 system and the following sub-samples: SOCBs and non-SOCBs from 1999 to 2009. Further, we apply all three measures of market share and concentration ratio based upon customer deposits, total assets and customer loans and that use both 3-bank and 5-bank concentration ratios. Previous studies for other countries used just one single concentration ratio variable such as 3-bank (Lloyd-Williams et al., 1994) or 10-bank (Molyneux and Forbes, 1995) measures. Secondly, we model and estimate revenue over total assets, interest income and profit before tax over total assets as the dependent variables. All the previous studies employed only profit before tax over total assets as the dependent variable of the model.
Our empirical results show that the Vietnamese banking industry was substantially less concentrated over the period 1999-2009 as both the CR and HHI fell. This suggests that the banking industry became more competitive. Small and medium banks have performed better in the 2000s but they might not compete against large banks. The increase in the number of banks and decreased market concentration may suggest that banking service choice is increasing. The estimated structural models do not, in general, support either traditional SCP or efficiency hypotheses. It could be that the business strategies of large Vietnamese banks during this period were focussed on raising capital, loans, assets, deposits, branch networks and reducing non-performing loans. Thus, revenue, interest income and profit before tax were not the most propriety missions of banks.
We believe that the SBV needs to strengthen the regulations on the current sources of revenue (securities, credit cards, derivative products etc.) and set up regulations on new services such as securitisations. There is also a need to restructure the banking system where some small banks are not really efficient in the market. Hence, merger and acquisitions may be a popular trend in the coming years. We believe that the SBV needs to have policies for restructuring the system and promoting competition in the banking sector of Vietnam.
Another policy implication concerns the relationship between loan and bank revenue and interest income from 2004 to 2009. We argued that tightening monetary policies starting in 2008 still have a big impact on the banking system in terms of compulsory reserves, loans and deposits. In parallel with the speed of the country’s economic development, the loan
17 growth rate grew dramatically. As the loan growth rate is higher than the deposit growth rate, commercial banks have to use sources such as the inter-bank market to meet borrowing demands. The misuse of this capital resource causes a serious imbalance in the capital structure and implicates high liquidity risk in the banking system. Moreover, when the inflation rate and deficit in trade balance have become more serious, the government used traditional tightening of monetary policy in order to reduce money supply circulation – the main reason for high inflation. Generally, the banking system encounters many difficulties, resulting from loss of balance in the source and use of funds, and the rapid increase in credit growth. This is also supported by our empirical results when customer loans increase, revenue and interest income generally decrease from 2004 to 2009. Thus, the SBV needs to balance the high demand of loans from the public and macroeconomic policies of the government.
Our results for Vietnam contrast with those for the USA and Europe found in previous work. Our results support neither the SCP or EH models for Vietnam whereas the EH is favoured for the USA while the European banking system generally conforms to the SCP approach. Hence, our results add a further interesting contrast by geographical location on this issue.
References
Barth, J.R., Caprio, G. JR. and Levine, R. (2001). The regulation and supervision of banks: Around the world, A new database. In R. Litan, & R. Herring, Integrating emerging market countries into the global financial (pp. 183-240). Brookings-Wharton pap. Finan. Services.
Barth, J.R., Caprio, G. JR. and Levine, R. (2004). Bank regulation and supervision: What works best? Journal of Financial Intermediation, 13(2), 205-248.
Berger, A.N. and Hannan, T.H. (1989). The price-concentration relationship in banking.
Review of Economics and Statistics, 71(2), 291-9.
Brozen, Y. (1971a). Bain's concentration and rates of return revisited. Journal of Law and Economics, 14, 351-369.
Carter, J. (1978). Collusion, efficiency and antitrust. Journal of Law and Economics, 21, 435-444.
18 Claessens, S. and Laeven, L. (2004). What drives bank competition? Some international
evidence. Journal of Money, Credit and Banking, 36(3), 563-583.
Demsetz, H. (1973). Industry structure, market rivalry and public policy. Journal of Law and Economics, 16, 1-9.
Demsetz, H. (1974). Two systems of belief about monopoly. In H. Goldschmid, H. Mann, & J. Weston, Industrial concentration: The new learning. Boston: Little, Brown and Company.
Dinh, T.T.H. and Kleimeier, S. (2007). A credit scoring model for Vietnam's retail banking market. International Review of Financial Analysis, 16, 471-495.
Dufhues, T. (2003). Transformation of the financial system in Vietnam and its implications for the rural market - An updated. Journal of Institutional Innovation, 7, 29-41.
Eckard, E. (1995). A note on the profit-concentration relation. Applied Economics, 27, 219-223.
Evanoff, D.D. and Fortier, D.L. (1988). Reevaluation of the structure-conduct-performance paradigm in banking. Journal of Financial Services Research, 1(3), 277-294.
Goddard, J.A., Molyneux, P. and Wilson, J.O.S. (2001). European banking: Efficiency, technology and growth. Chichester: John Wiley & Sons, Ltd.
Jovanovic, B. (1982). Selection and the evolution of industry. Econometrica, 50(3), 649-670. Kousted, J., Rand, J., Tarp, F., Nguyen, D.T., Nguyen, V.H., Ta, M.T. and Luu, D.K. (2005). From
mono bank to commercial bank: Financial sector reforms in Vietnam. Singapore: Institute of Southeast Asian Studies.
Lloyd-Williams, M., Molyneux, P. and Thornton, J. (1994). Market structure and performance in Spanish banking. Journal of banking and Finance, 18, 433-443.
McGee, J. (1974). Efficiency and economies of size. In H. Goldschmid, H. Mann, & J. Weston,
Industrial concentration: The new learning. Boston: Little, Brown and Company. Molyneux, P. and Forbes, W. (1995). Market structure and performance in European banking.
Applied Economics, 27, 155-159.
Molyneux, P., Altunbas, Y. and Gardener, E. (1996). Efficiency in European banking.
Chichester: John Wiley & Sons.
Molyneux, P., and Thornton, J. (1992). Determinants of European bank profitability: A note.
19 Phillips, A. (1976). A critique of empirical studies of relations between structure and
profitability. Journal of Industrial Economics, 24, 241-249.
Posner, R. (1979). The Chicago school of anti-trust analysis. University of Pennsylvania Law Review, 127, 928-48.
Reder, M. (1982). Chicago economics: permanence and change. Journal of Economic Literature, 20, 1-38.
Rhoades, S. (1985). Market share as a source of market power: implications and some evidence. Journal of Economics and Business, 37, 343-63.
SBV. (2005). Annual Report. Hanoi: SBV. SBV. (2008). Annual Report. Hanoi: SBV. SBV. (2009). Annual Report. Hanoi: SBV.
Schamalensee, R. (1985). Do markets differ much. American Economic Review, 75, 341-351. Smirlock, M. (1985). Evidence on the (non) relationship between concentration and
profitability in banking. Journal of Money, Credit and Banking, 17(1), 69-83. Stigler, G. (1968). The organization of industry. Illinois: Richard D. Irwin, Inc.
VCSC. (2008). Vietnam banking system: Reality and forecast. Ho Chi Minh city: VCSC.
Weiss, L. (1974). The Concentration-profits relationship and antitrust. In H. Goldschmid, H. Mann, & J. Weston, Industrial concentration: The new learning (pp. 184-233). Boston: Little, Brown and Company.
20
Figure 1 Milestones in the development of the Vietnamese banking system
Figure 2 Non-performing loans (per cent of total outstanding loans) from 1996 to 2009
Sources: Koustedet al. (2005: 43); VCSC (2007: 5) and SBV (2009).
Table 1The number of commercial banks from 1990 to 20099
Type of banks 1990 1995 2000 2005 2009
State owned commercial banks (SOCBs) 4 4 5 5 5
Joint stock commercial banks (JSCBs) 0 36 39 37 37
9
Beside these commercial banks, there are also the Social Policy Bank and Vietnam Development Bank which are operating as non-profit institutions. 0 5 10 15 1996 1997 1998 1999 2000 2001 2002 2003 2004 2005 2006 2007 2008 2009
NPLs/TLs
NPLs/TLs 2005 1995 1990 1985 1950 02/1951 SBV was found 1986 Doimoi reforms 2000 1997 Asian Financial Crisis 01/2007 Vietnam became a member of WTO 1997 Laws on the SBV and Financial Institutions (FIs) were issued 2007 Financial crisis hit the bankingsystem 2002 Passage of Banking Reform Plan 09/2008 HSBC, SCB opened wholly owned units in Vietnam 1991 First JSCBs were established
21 Branches of foreign banks (BFBs) 0 18 26 31 48
Joint venture commercial banks (JVCBs) 0 4 5 5 6
Foreign commercial banks (FCBs) 0 0 0 0 5
Total 4 62 75 78 101
Sources: Dufhues (2003: 32); SBV (2005, 2008, 2009) and VCSC (2008).
Table 2CR (3 and 5 banks) and HHIfor the Vietnamese banking system from 1999 to 2009
Concentration ratios Herfindahl-Hirschman
indices
Year No. of
banks CR-CL3 CR-CL5 CR-TA3 CR-TA5 CR-CD3 CR-CD5 HHI-CL HHI-TA HHI-CD
1999 17 0.8021 0.9256 0.6916 0.9175 0.7268 0.9270 0.2270 0.2052 0.2127 2000 22 0.7703 0.9036 0.6856 0.9069 0.6975 0.9107 0.2157 0.1990 0.2006 2001 25 0.7839 0.8963 0.6782 0.8976 0.7023 0.8910 0.2179 0.1942 0.1988 2002 28 0.7542 0.8921 0.5316 0.6944 0.6415 0.8587 0.2134 0.1895 0.1739 2003 29 0.7347 0.8788 0.6772 0.8703 0.6493 0.8583 0.2198 0.1895 0.1767 2004 40 0.7001 0.8522 0.6582 0.8395 0.6422 0.8435 0.2059 0.1780 0.1705 2005 41 0.6741 0.8221 0.6185 0.8076 0.6327 0.8310 0.1886 0.1617 0.1643 2006 41 0.6283 0.7733 0.5770 0.7577 0.5864 0.7940 0.1683 0.1391 0.1480 2007 44 0.5411 0.6891 0.4770 0.6416 0.5278 0.7024 0.1314 0.1019 0.1215 2008 46 0.5427 0.6819 0.4741 0.6372 0.5220 0.6784 0.1302 0.1016 0.1194 2009 46 0.5066 0.6459 0.4089 0.5723 0.4555 0.6073 0.1141 0.0824 0.0972
Note: CR range from 0 to 1; HHI range from 0.02 to 1; Sources: Financial statements of 48 Vietnamese commercial banks.
Table 3 SCP-EH estimations of customer loans for the full sample
3-bank ratios 5-bank ratios
Dependent
variable LN(REV/TA) LN(INT/TA) LN(1+PBT/TA) LN(REV/TA) LN(INT/TA) LN(1+PBT/TA)
Int. -0.00876 (-0.01109) 0.227958 (0.264148) 0.110649** (2.49542) 0.736445 (0.854233) 0.766863 (0.81058) 0.091746* (1.871657) MSCL -2.27129* (-1.81348) -1.52172 (-1.11167) 0.070922 (1.008386) -2.02182 (-1.63068) -1.45793 (-1.07153) 0.048213 (0.683905) CRCL -1.47917*** (-3.3178) -1.85599*** (-3.80902) -0.07293*** (-2.91306) -1.81084*** (-3.92338) -2.03773*** (-4.02317) -0.05635** (-2.14733)
22 TC/TA 0.486087*** (4.450462) 0.474113*** (3.971696) 0.04038*** (6.583556) 0.460158*** (4.218321) 0.458515*** (3.830262) 0.04148*** (6.687754) CL/CD 0.004168 (0.345918) 0.010173 (0.772382) -0.00074 (-1.08687) 0.002035 (0.169411) 0.008691 (0.659231) -0.00067 (-0.98481) LN(TA) -0.11897*** (-2.98007) -0.1281*** (-2.93588) -0.00378* (-1.68516) -0.13555*** (-3.38191) -0.13649*** (-3.10319) -0.00285 (-1.25138) LN(BR) 0.083725* (1.699973) 0.076386 (1.419072) 0.001156 (0.418068) 0.077752 (1.593906) 0.075649 (1.413176) 0.001811 (0.652937) R2 0.512551 0.499378 0.465232 0.512551 0.501861 0.458888 Adj. R2 0.432319 0.416978 0.377211 0.432319 0.419869 0.369823 1 0
H 4.102543*** Reject 3.817154*** Reject 1.624488*** Reject 4.208418*** Reject 3.852561*** Reject 1.565254** Reject
F-sta. 6.388336 6.060381 5.28548 6.55246 6.120869 5.152277
Obs. 376 376 376 376 376 376
Note: All models are estimated using the fixed-effects estimator with cross-sectional fixed-effects (only). R2 denotes the coefficient of determination, Adj. R2 the adjusted coefficient of determination,H01 is an F-test for the significance of the fixed-effects, F-sta. tests the null that R2 is equal to zero and Obs. denotes the number of observations used in estimation. The variables’ coefficients and t-statistics (in brackets) are reported in the table; *** indicates significance at the 1% level, ** significance at the 5% level and * significance at the 10% level. Source for the data are the financial statements of 48 Vietnamese commercial banks.
Table 4 SCP-EH estimations of total assets for the full sample
3-bank ratios 5-bank ratios
Dependent
variable LN(REV/TA) LN(INT/TA) LN(1+PBT/TA) LN(REV/TA) LN(INT/TA) LN(1+PBT/TA)
Int. -1.65102*** (-2.7175) -2.33356*** (-3.48936) 0.03952 (1.175122) -1.65692*** (-2.68334) -2.26849*** (-3.33969) 0.051258 (1.503601) MSTA -1.57601 (-1.40174) -1.26957 (-1.02582) -0.00116 (-0.01861) -1.58309 (-1.40541) -1.22971 (-0.99242) 0.006226 (0.100114) CRTA -0.60241* (-1.8943) -0.36224 (-1.03481) -0.02964* (-1.68398) -0.48961* (-1.8338) -0.33187 (-1.12998) -0.03066** (-2.07998) TC/TA 0.573109*** (5.247869) 0.601891*** (5.006929) 0.043582*** (7.20953) 0.578231*** (5.312729) 0.602083*** (5.02886) 0.043328*** (7.210775) CL/CD 0.007309 (0.599899) 0.016223 (1.209669) -0.00051 (-0.74861) 0.007481 (0.614099) 0.016169 (1.206552) -0.00052 (-0.7791) LN(TA) -0.05701 (-1.50241) -0.03535 (-0.8463) -0.00141 (-0.67276) -0.05491 (-1.4566) -0.0366 (-0.88263) -0.00175 (-0.84113) LN(BR) 0.092115* (1.888787) 0.104564* (1.947792) 0.002791 (1.03392) 0.091437* (1.872354) 0.103469* (1.926077) 0.002637 (0.978185) R2 0.489937 0.468632 0.456293 0.489583 0.468971 0.458777 Adj. R2 0.405982 0.381171 0.366801 0.405571 0.381566 0.369693 1 0
H 3.684576*** Reject 3.470895*** Reject 1.535956** Reject 3.681292*** Reject 3.469094*** Reject 1.541916** Reject
F-sta. 5.835745 5.358178 5.098699 5.827494 5.365469 5.149972
Obs. 376 376 376 376 376 376
23
Table 5SCP-EH estimations of customer deposits for the full sample
3-bank ratios 5-bank ratios
Dependent
variable LN(REV/TA) LN(INT/TA) LN(1+PBT/TA) LN(REV/TA) LN(INT/TA) LN(1+PBT/TA)
Int. -0.65301 (-0.80502) -0.84286 (-0.94872) 0.070327 (1.564452) 0.276912 (0.337812) 0.051229 (0.056954) 0.041071 (0.890419) MSCD -0.79959 (-0.65617) -0.37716 (-0.2826) -0.00179 (-0.02652) -0.33625 (-0.28004) 0.061599 (0.046753) -0.02044 (-0.3025) CRCD -1.34714** (-2.56093) -1.4553** (-2.52601) -0.05449 (-1.8692) -1.59015*** (-3.7907) -1.65446*** (-3.59429) -0.02597 (-1.10031) TC/TA 0.540598*** (4.910592) 0.547763*** (4.543071) 0.042774*** (7.011166) 0.509278*** (4.685357) 0.518012*** (4.34314) 0.043978*** (7.190282) CL/CD 0.005236 (0.429257) 0.013002 (0.973282) -0.00057 (-0.83748) 0.002668 (0.220821) 0.010484 (0.790754) -0.00052 (-0.75783) LN(TA) -0.09078** (-2.21662) -0.08627* (-1.9234) -0.00226 (-0.99619) -0.11992*** (-2.96281) -0.11408** (-2.56863) -0.00122 (-0.53494) LN(BR) 0.08308* (1.692808) 0.087907 (1.635438) 0.002235 (0.821693) 0.070939 (1.461514) 0.076266 (1.431937) 0.002636 (0.965075) R2 0.492568 0.476676 0.457847 0.504351 0.486892 0.454017 Adj. R2 0.409047 0.390539 0.36861 0.422769 0.402437 0.36415 1 0
H 3.734417*** Reject 3.506048*** Reject 1.548419** Reject 3.917612*** Reject 3.624747*** Reject 1.533396** Reject
F-sta. 5.897504 5.533919 5.130719 6.182145 5.765065 5.052111
Obs. 376 376 376 376 376 376
See note to Table 3.
Table 6 Summary of the results from the structural model
Majority Minority Majority Minority Full sample
CR (-)
MS (0)
1999-2003 2004-2009
CR (0) (-) CRCL5 and LN(1+PBT/TA) CR (-) (0) CRCD3; LN(1+PBT/TA) MS (0) (-) CRCL with LN(REV/TA) and
LN(INT/TA)
MS (0)
SOCBs Non-SOCBs
CR (0) CRCD3 CR (-) (0) CRTA; CRCD3 with LN(REV/TA) and LN(INT/TA) MS (-) (0) CRCD and CRCL with
LN(1+PBT/TA)
MS (0)