Experimental Study of DDoS Defense System for Web Service
Namkyun Baik and Namhi Kang
∗Internet Intrusion Response Center Korea Internet & Security Agency,
Dept. of Digital Media Duksung Womens' University*
[email protected], [email protected]*
Abstract
Web services have become major targets of DDoS attacks that can inflict the most serious damage in terms of availability. The DDoS attack is one of the most serious threat to Internet services and further there is no perfect solution to defend against variously modified attacks to heterogeneous Internet services. To solve the problems, several defense mechanisms against DDoS attacks have been proposed in the literature. However it is not easy for a security manager to select solutions suited for his service environments. Under the respect, this paper is intended to classify DDoS defense systems based on the functional design method. Also we show various experimental results of DDoS defense systems by using our proposed classification of defense systems and performance metrics.
Keywords: DDoS attack, DDos defense systems; Internet threats, Web service
1. Introduction
Almost every day various attacks and security threats to Internet service are announced over public media. Such phenomena are increasingly causing more serious problems as the number of smart devices connected to Internet is growing. Especially, attacks that threaten the availability of system resources such as network resource and service capacity result in huge social and economic losses [1].
DoS (Denial of Service) attack is well known and increasingly growing threat to the Internet. DoS attack causes interruption of normal services by using various methods that abuse vulnerabilities of the Internet. DDoS (Distributed DoS) attack, which is a kind of DoS attack, creates a load exceeding the resource capacity supported by the network or system by handling numerous zombie agents simultaneously in a distributed manner. As such, it has more destructive power than conventional DoS attacks [2]. In particular, DDoS attacks on Web server, which fundamentally provide services with lots of random people, is the most serious problem in terms of information security and the influence of infringement [3]. According to the descriptions of [4], HTTP based attacks rank first among DDoS attacks on the application layer in 2010 and 2011.
DDoS attacks have great destructive power that can cause not only economic losses but also social chaos. Many response systems have been proposed to protect system against such attacks, which are becoming intelligent and well organized [5, 6]. However it is still difficult to figure out which of the existing responses is the most effective countermeasure against diverse and complex DDoS attacks. This is mainly due to the fact that the increasing sophistication of attack techniques and the mixture of complex response measures. Inaccurate information about such attacks and inappropriate selection of responses have led to a failure
∗
to effectively defend against DDoS compared to the amount of investment. Furthermore, there are too many classification criteria and a response technique can conform to multiple categories [3].
With the respect, we are intended to classify response techniques based on functional design of the defense techniques in order to provide the reference data needed to establish efficient countermeasures against DDoS attacks. The proposed classification consider on most of commercialized or theoretical defense systems in order to eliminate the difficulties in adopting a systematic approach to defenses that conform to the environment and security level demanded by users. We also use Web service attribute based performance metrics that we proposed in [3] for analyzing results coming from several experimental test of DDoS defense systems.
The experimental test compare and analyze existing leading attack techniques and the corresponding response techniques. The logical background to the deduced measurements is verified to discuss the most effective response to each type of attack.
The remainder of this paper is organized as follows. Section 2 reviews two previous classification approaches for DDoS defense system and their limitations. We propose a new categorization of defense techniques based on functional design of the defenses in Section 3. In Section 4, attribute based performance metrics for Web service is described. Section 5 shows various experimental results and analyses. Finally we conclude the paper in Section 6.
2. DDoS Defense System Categorization and Limitations
Two categorizations of DDoS defense mechanism defined by Mirkovic and Champagne are well known.
Mirkovic categorized the defense system by using level of activity, degree of cooperation, and deployment location [5]. Categorization by 'level of activity' is divided into the defense mechanism for preventing attacks by eliminating risks in advance; the degree of withstanding an attack and the reaction mechanism consisting of the detection method based on pattern/abnormal behavior/third party dependency; and the response method based on the attacker identification/rate limitation/filtering/ environment reconfiguration. Categorization by 'degree of cooperation' consists of autonomous, cooperative, and interdependent items to indicate the level of defense through unilateral operation or in collaboration with other objects. Lastly, categorization by 'deployment location' is divided into the victim, intermediate and source network according to the location of the defense.
Champagne categorized DDoS defense mechanisms by mitigation, prevention, and deterrence [6]. Mitigation of damage by a DDoS attack consists of traffic congestion control, network reconfiguration, signature-based filtering, quality of service (QoS) management, and server security setting. Prevention is divided into filtering to intercept penetration by malicious codes, design of a safe protocol, and elimination of the zombie system. Deterrence is divided into honeypots and forensics based on the attacker identification and attack evidence.
Such defense categorization is not adequate enough to be applied to all DDoS defenses as there are too many categorization criteria, the boundary is too vague, and a response can conform to multiple categories. In particular, the criteria that can be applied to the commercially available defenses are only few in number and should be considered as the categorization in any conceptual approach.
3. Proposed Categorization
Previous DDoS defense techniques proposed until now are mostly based on the theoretical and technical grounds and require additional resources such as interface and configuration change to enable their application to actual networks. As such, it is difficult to predict and select an effective defense for the protection target.
This paper proposes the following four classifications based on a design method to be applied to all commercialized or theoretical defenses in order to eliminate the difficulties in adopting a systematic approach to defenses that conform to the environment and security level demanded by users.
Structural (hierarchical) base Abnormal behavior base Authentication base
Load balancing (redundancy) base
The structure-based defense intercepts illegal access at the root by assigning the privilege to access the resources so as to identify unauthorized users. The defense techniques include ACL (Access Control List), Black/White List, Aging (level-based), etc., [7].
The abnormal behavior-based defense uses the profile of normal behaviors so that the condition exceeding a certain threshold value is responded to. The leading defenses include rate-limiting, CAR (Commit Access Rate) MBA (Micro Behavior Analysis), NBA (Network Behavior Analysis), etc., [8].
The authentication-based defense performs reliability verification at both ends and only allows access upon verification. The leading defenses include SYN proxy, SYN cookies, uRPF (unicast Reverse Path Forwarding), Graphic Puzzle, etc., [9, 10].
The load balancing-based defense involves the concept of parallel processing of the flood of data. The leading defenses include URL redirection, Blackhole/Sinkhole routing, load balancing, traffic shaping, DNS round robin, GSLB (Global Server Load Balancing), CDN (Contents Delivery Network), L4 SLB (Layer 4 Server Load Balancing), etc., [11].
Since the proposed design method based classification for DDoS defense technique characterizes the common attributes of each defense systems, it can uniquely categorize all commercialized and theoretical defenses that currently exist or will be developed in the future. It also eliminates any duplicated defense forms to remedy the weaknesses of the existing categorization. In other words, the characteristics of the defense can be clarified, and thus it can provide information for user selection and a theoretical direction for future studies on defense technology.
4. Performance Evaluation Metric for Web Service
In [3], we have proposed an attribute based performance metrics for evaluating WEB services. This section summarize such metrics since we use the metrics to evaluate the proposed categorization for DDoS defense system.
The metrics is intended to measure the availability of WEB servers by implementing defensive countermeasures against DDoS attacks. Selection of the defense mechanism against a certain type of attack is an important factor in securing Web server when deploying the DDoS defense system in various scenarios [12]. A security manager must consider service availability from various aspects of defense mechanism and then design and deploy the system. There are no proper publically known performance evaluation metrics for measuring the availability of Web servers. Thus security managers have to develop their own evaluation
checklist or can use a modified version of evaluation standards such as ISO/IEC 9126, ISO/IEC 9646, ISO/IEC 12119, IETF RFC 2544 and others. (see [3] in details).
However, using the abovementioned metrics to compare and analyze the DDoS attacks and defenses of the target Web servers require additional work and introduce difficulties in measuring. To solve the problem we have proposed two different evaluation metrics well suited for HTTP based Web services. One is the rate of connected service (CS) and the other is the rate of contents completeness (CC). We use the two metrics in this paper for experiment of the proposed categorization.
A Web server service consists of many sessions. Therefore, the satisfaction level of Web service quality can greatly decrease as load including traffic and computing increases. This is because even one session is omitted or retransfer of the omitted session is requested. Whether users can access all documents at any time can be considered as the availability felt by the Web users. As a result, its evaluation metric can be expressed by the rate of connected service and the rate of contents completeness as follows.
In equation (1) and (2), service is defined as the web page requested by a Web user from the server and requiring one or more contents and contents include one or more sets of static or dynamic data requested by several protocols such as SIP, DIP, Sport, Dport, or TCP/IP.
Service connection rate in Equation (1) represents the ratio of service responses to information request services by Web users from the Web server. The contents completeness rate in Equation (2) represents the rate of a Web page's provision of the required contents to the requesting services.
5. Experimental Result
In this section, we analyze the actual measurements of sixteen cases of leading attacks (i.e., UDP Flooding, Syn Flooding, Http Connect, and SQL query) and deployable defense systems (i.e., ACL, Rate-Limiting, Syn-Proxy, L4 SLB). The Web service attribute-based performance evaluation metrics is used to measure the threat to the availability to select a point of defense as the reference for deploying the DDoS defense system for an effective response. For the defense of all the test items described below, the assumed best case is selected to show the most effective defense technique.
As the basic operation of each defense, the interception list of the attack pattern can be updated one at a time every 10 seconds on average for ACL; only those connections exceeding the threshold value (attacks exceeding the transmission band) can be disposed of, or all connections (others than the attacks exceeding the transmission band) can be disposed of for rate-limiting; all TCP/IP connections are verified without limitations on capacity for Sun-Proxy; and the networks and servers have redundancy for L4 SLB. The test configuration and variables commonly applied to all the test items are described below.
Traffic Generator: BreakingPoint CTM, IXIA, Avalanche STC Measurement Equipment: Omnipliance/ Omnipeek
Attack Time: From 30 sec.
Apache Web Server Configuration: 100 connections (other than excessive application connection attacks), 200 connections (excessive application connection attacks)
Windows Web Server Configuration: XP, MySQL (100 connections)
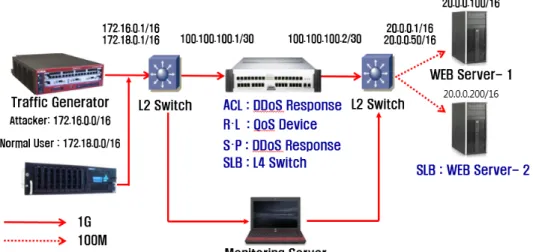
The testing environment, attack, and normal traffic of an excessive transmission band attack (UDP flooding) are shown in Figure 1.
Figure 1. Experimental Test-bed
To test excessive transmission attack (UDP flooding), attacker generates 400Mbps UDP packets with 10 systems (10 different IPs). Normal traffic is generated by 20 services (5 sessions per service) per second toward Web server. Rate limiting threshold value is set to 100Mbps. Experimental results are summarized as follows.
ACL Response
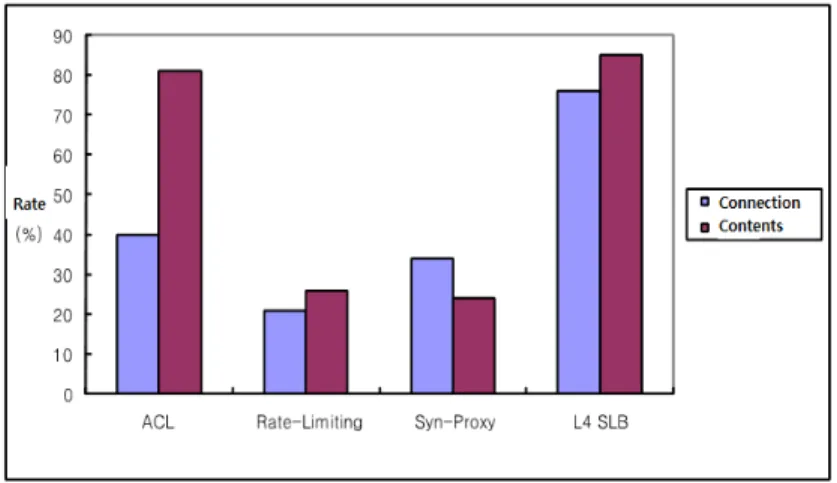
: A service connection rate of 40% and a contents completeness rate of 81% were measured. Since the volume of normal traffic was significantly smaller than the volume of attack traffic, the service was restored only after ACL application was completed. Since the attack traffic had no impact on the connected service, a high level completion rate was maintained.
Rate-Limiting Response
: A service connection rate of 21% and a contents completeness rate of 26% were measured. Since only normal traffic within the threshold value of 100Mbps were connected probabilistically, both the service connection rate and the contents completeness rate showed low values.
Syn-Proxy Response
: A service connection rate of 34% and a contents completeness rate of 24% were measured. Since the response cannot be applied to the attack, both normal traffic and attack traffic must compete in the best case. As such, both the service connection rate and the contents completeness rate showed low values.
L4 SLB Response
: A service connection rate of 76% and a contents completeness rate of 85% were measured. As twice the amount of server resources mitigates competition, both the
service connection rate and the contents completeness rate were two times higher than that of the case (Syn-Proxy) that does not apply the response.
Figure 2. Availability of Web Server in Case of Excessive Transmission Attacks
Experimental results shows that the actual responses show the expected effectiveness, with the exception of ACL. It should be noted that the defense capability of ACL can be significantly degraded if an attack by many IPs (as the actual attack of transmission band requires many IPs), instead of the best case (limited number of IPs), is replayed.
Figure 3. Equipment Screen Shot of Web Server Availability Test
The testing environment, attack, and normal traffic of an excessive login attack (Sync Flooding) are shown below.
Attack Traffic: Generation of 1Mpps TCP SYN packets with 10 systems
Normal Traffic: Generation of 20 services (5 sessions required per service) per second in the Web server
Experimental results are summarized as follows. ACL Response
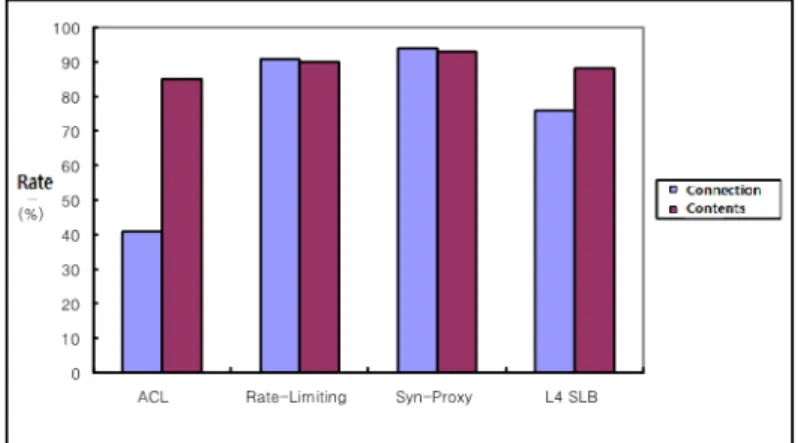
: A service connection rate of 41% and a contents completeness rate of 85% were measured. As in the case of the excessive transmission band attack, the volume of normal traffic was significantly smaller than the volume of attack traffic, and the service was restored only after ACL application was completed. Since the attack traffic had no impact on the connected service, a high level completion rate was maintained.
Rate-Limiting Response
: A service connection rate of 91% and a contents completeness rate of 90% were measured. Since most attack traffic exceeded the threshold value of 100pps per IP and thus were eliminated, both the service connection rate and the contents completeness rate were high.
Syn-Proxy Response
: A service connection rate of 94% and a contents completeness rate of 93% were measured. Since only traffic having TCP/IP connections at both ends was selectively allowed to pass through, it showed the highest service connection and contents completeness rates.
L4 SLB Response
: A service connection rate of 76% and a contents completeness rate of 88% were measured. As in the case of the excessive transmission band attack, the service connection rate and the contents completeness rate were proportional to the effect of mitigating competition by the best case with twice the server resources.
Figure 4. Availability of Web Server in Case of Excessive Login Attacks
Experimental results indicates that the actual response systems showed almost the expected effectiveness. In particular, it indicates that the authentication based response system, which requires reliability at both end systems, was the most effective.
The testing environment, attack, and normal traffic of an excessive server capacity attack (Http Connect) are shown below.
Attack Traffic: Generation of 100 Web services with 10 IPs
Normal Traffic: Generation of 20 services (5 sessions required per service) per second in the Web server
Experimental results are summarized as follows. ACL Response
: A service connection rate of 90% and a contents completeness rate of 98% were measured. Since the volume of attack traffic was not that large, unlike the excessive transmission band attack, normal traffic could probabilistically compete even before all ACLs were applied, and thus the service connection rate was high. The high completion rate was maintained because the attack traffic had no impact after completion of ACL application.
Rate-Limiting Response
: A service connection rate of 72% and a contents completeness rate of 95% were measured. Since most attack traffic was within the threshold value of 100pps per IP and thus not eliminated, the normal traffic and attack traffic coexisted for competition, similar to the case prior to ACL application. Therefore, the service connection rate was lower. However, the contents completeness rate was high because the services had no competition once they had been connected.
Syn-Proxy Response
: A service connection rate of 74% and a contents completeness rate of 98% were measured. Since the excessive server capacity attack is based on TCP/IP connection, normal traffic and attack traffic cannot be distinguished. Therefore, it showed similar service connection and contents completeness rates to rate-limiting.
L4 SLB Response
: A service connection rate of 95% and a contents completeness rate of 98% were measured. It showed high service connection and contents completeness rates since twice the server resources are sufficient capacity to handle both attack traffic and normal traffic.
The actual response was somewhat different from the expected level. The ACL response showed a relatively better effect because the traffic volume used in the excessive server capacity attack was significantly smaller than that used in the excessive transmission band and excessive login attacks. In other words, high traffic transmission after TCP/IP connection is a burden from the attacker's perspective, and the attack generates a relatively smaller load since its purpose is to exceed the number of connections in the target server. Moreover, since the pattern of the data domain can be added to the header field, it can control access more precisely. Therefore, redundancy can be considered as the highest priority response against this type of attack, and the ACL response based on the detail list can be considered next.
The testing environment, attack, and normal traffic of an excessive application connection attack (SQL Query) are shown below.
Application Connection Attack
Attack Traffic: Generation of 100 SQL queries with 10 IPs
Normal Traffic: Generation of 20 services (5 sessions required per service) per second in the Web server
Rate-Limiting Threshold Value: 100pps per IP Experimental results are summarized as follows. ACL Response
: A service connection rate of 90% and a contents completeness rate of 99% were measured. A high level completion rate was maintained for the same reason as the excessive server capacity attack.
Rate-Limiting Response
: A service connection rate of 69% and a contents completeness rate of 98% were measured. Although the service connection rate was somewhat lower for the same reason as the excessive server capacity attack, the contents completeness rate was high because the connected services had no competition.
Syn-Proxy Response
: A service connection rate of 72% and a contents completeness rate of 98% were measured. They were similar to the rate-limiting response for the same reason as the excessive server capacity attack.
L4 SLB Response
: A service connection rate of 96% and a contents completeness rate of 99% were measured. Since twice the amount of server resources was sufficient capacity to handle both normal traffic and attack traffic, both the service connection rate and the contents completeness rate were high.
The actual responses were the same as the expected effect. In the case of ACL response, the pattern of the application program can be additionally configured and a more precise access control list established, so a better effect can be expected for the same reason as the excessive server capacity attack. The redundancy-based response again showed a good effect compared to the additional resources required.
6. Conclusion
The results of this study are expected to facilitate the development of an objective and index-oriented efficient DDoS defense system to improve Web service availability by minimizing the damages. Additionally, a multi-step defense policy involving the administrator's procedural involvement and a policy response to the availability infringement and minimum level of threshold, by recognizing the limitations of the various responses as a vulnerability is needed.
Acknowledgements
This research was supported by Basic Science Research Program through the National Research Foundation of Korea(NRF) funded by the Ministry of Science, ICT & Future Planning(No. 2013023700). Also, this research was supported by the MSIP(Ministry of Science, ICT&Future Planning), Korea, under the ITRC(Information Technology Research Center)) support program (NIPA-2013-H0301-13-1003) supervised by the NIPA(National IT Industry Promotion Agency).
References
[1] C. Derrick Huang and R. S. Behara, “Economics of information security investment in the case of concurrent heterogeneous attacks with budget constraints”, Production Economics, vol. 141, no. 1, (2013) January. [2] M. Bailey, E. Cooke, F. Jahanian, Y. Xu and M. Karir, “A Survey of Botnet Technology and Defenses”,
Proceedings of the International Conference of CATCH, Washington, DC, USA, (2009) March 3-4.
[3] B. Namkyun, S. Ahn and N. Kang, “Effective DDoS attack defense scheme using web service performance measurement”, Proceedings of the International Conference of ICUFN, Phuket Thailand, (2012) July 4-6.
[4] E. Alomari, S. Manickam, B. B. Gupta, S. Karuppaya and R. Alfaris, “Botnet-based Distributed Denial of Service (DDoS) Attacks on Web Servers: Classification and Art”, Computer Applications, vol. 49, no. 7,
(2012) July.
[5] J. Mirkovic and P. Reiher, “A taxonomy of DDoS attack and DDoS defense mechanisms”, ACM SIGCOMM. Computer Communication Review, (2004) April.
[6] D. Champagne and R. B. Lee, “Scope of DDoS Countermeasures: Taxonomy of Proposed Solutions and Design Goals for Real-World Deployment”, Princeton Univ. Tech Report, (2005).
[7] I. van Beijnum, “How to Get Rid of Denial of Service Attacks”, http://www.bgpexpert.com/antidos.php. [8] CISCO, QPM Command Reference, http://www.cisco.com.
[9] CISCO, Unicast Reverse Path Forwarding (uRPF) Enhancements for the ISP-ISP Edge, http://www.cisco.com.
[10] S. Kandula, D. Katabi, M. Jacob and A. Berger, “Botz-4-Sale: Surviving Organized DDoS Attacks That Mimic Flash Crowds”, Proceedings of the International Conference of NSDI, Boston, Massachusetts, USA,
(2005) May 2-4.
[11] BlackHole Route Server and Tracking Traffic on an IP Network, http://www.ietf.org/rfc/rfc2616.
[12] E. Cambiaso, G. Papaleo and M. Aiello, “Taxonomy of Slow DoS Attacks to Web Applications”, Proceedings of the International Conference on SNDS, Trivandrum, India, (2012) October 11-12.
Authors
Namkyun Baik received B.E. and M.S. and Ph. D. degrees in electrical & communication engineering from Soongsil Univ., Korea, in 1998 and 2001 and 2011, respectively. Since 2000, he has been a senior research engineer in Internet Intrusion Response Center Korea Internet & Security Agency.
Namhi Kang received B.E. and M.S. degrees in information communication engineering from Soongsil University, Korea, in 1999 and 2001, resp. He received a Ph.D. in information communication engineering from Siegen University, Germany, in December 2004. Since 2009, he has been a professor in the Dep. of Digital Media, Duksung Women's University.