Effect of Ownership Structure on Financial Performance of Listed Insurance Firms in Nigeria
Ohiani Danjuma Lawala Eniola Samuel Agbib Lateef O. Mustaphac
a Corresponding Author, Department of Accounting and Management, Nigerian Defence
Academy, Kaduna, Nigeria, ohianidanjuma@gmail.com
b Department of Accounting and Management, Nigerian Defence Academy, Kaduna, Nigeria c Department of Accounting and Management, Nigerian Defence Academy, Kaduna, Nigeria Keywords Ownership Structure, Financial Performance, Insurance Firms, Nigerian Stock Exchange. Jel Classification G32. Abstract
The study examines the effect of ownership structure on financial performance of listed insurance firms in Nigeria. Data was collected from the annual reports of 28 insurance firms listed in the Nigerian Stock Exchange for the periods of 2011 to 2016. The ex-post facto was employed by the study to examine the effect of ownership structure on financial performance of listed insurance firms in Nigeria. In addition to the descriptive statistics and correlation, multiple regression technique through panel data methodology was applied for model estimation. Data were subjected to pooled General Least Square, Fixed Effects, and Random Effects regression model to test the hypotheses of the study. Ownership structure proxied by managerial ownership, institutional ownership, and ownership concentration were adopted as independent variables. Firm financial performance as the dependent variables was proxied by Book value per Share. This study found ownership structure having significant positive effect on financial performance of the listed insurance firms except concentrated ownership with negative effect. However, in respect of size and growth of the firms, which form the control variables of the study, there were mixed evidence of their effects on financial performance. The study recommends that in order to enhance the financial performance, insurance firms in Nigeria should increase management equity-holding in the firms as this can stimulate the managers to maximize their efficiency and create more wealth for stakeholders.
1. Introduction
The financial performance of many organizations has been largely linked to their ownership structure over time as it provides funding through owner’s equity. Normally, every business organization is saddled with the responsibility of making returns. This responsibility is important since the ability of a firm to make returns in the competitive market determines to a large extend its ability to survive in the future. Jensen and Meckling (1976) defined financial performance as a tool that measures how well a company uses its resources in generating profit thus make it a vital tool to several stakeholders in a company. Financial performance therefore is crucial to any business organization’s survival and continuous patronage by investors, potential investors, creditors, and other stakeholders in the business world.
However, the type of ownership structure a firm adopts is engineered by the vision of the company. According to Jensen and Meckling (1976), ownership structure is defined by the distribution of equity with regards to votes and capital as well as the identity of the equity owners. Therefore, ownership structure of any company has been a serious factor for company’s financial performance. The effect of managerial, institutional, and concentrated ownership on firm’s financial performance measured by Book value per Share has been issue the researcher in the existing literature with mixed results. This has been widely tackled in the developed climes and more recently in emerging economies, but was less discussed in Nigeria context.
On top of the conflicting viewpoint, there has been very little interest on the ownership structure on financial performance of the insurance firms in Nigerian. The few studies in this area in Nigeria are those of Ibrahim (2012) and Benjamin, Love and Dandago (2014) that focused on the effect of managerial and institutional shareholding components of ownership structure on financial performance of the listed insurance firms between the periods 2001-2010. This study, however fill gap in literature by not only adding concentrated ownership on financial performance measured by Book value per Share of the listed insurance firms in the Nigerian Stock Exchange but also extend the work to cover most recent years of 2011-2016. This study therefore examines the effect of ownership structure on financial performance of the listed insurance firms in Nigeria from the period
of 2011 to 2016. In order to achieve this objective, the following stated null hypothesis is formulated and tested:
Ho1: Managerial ownership has no positive effect on the financial performance of the listed insurance firms in Nigeria.
Ho2: Institutional ownership has no positive effect on the financial performance of the listed insurance firms in Nigeria.
Ho3: Ownership concentration has no positive effect on the financial performance of the listed insurance firms in Nigeria.
Section 2 of this study reviews previous empirical literature on the effect of ownership structure on financial performance, the third section deals with the methodology that was adopted for the study. Section 4 presents the analysis of results, while the fifth section covers the conclusion and recommendations made by the researchers.
2. Literature Review
Concept of Ownership Structure
According to Jensen and Meckling (1976), ownership structure is described by the distribution of equity with respect to votes, capital, and also by the equity owners’ identity. This was referenced in their study on how the nature of agency costs relates with equity where they aimed at incorporating concepts into the beginnings of a theory of corporate ownership structure. In the recent years, there have been renewed interests on ownership structures due to the increased dynamics of corporate ownership portfolios. Ownership structure, as a mechanism in corporate governance to facilitate increased efficiency of a firm, has been believed to have affected firm performance. For example, Adam Smith (1776) points out that the joint-stock companies are less efficient than private co-partner companies because the directors would not watch over other people’s money‟ with the same anxious vigilance” as their own. Transaction cost theory considers a firm as an offer of contracts where the activities are cheaper internal than external. However, inside of the firm, there are conflicts between different parties. The principal-agent theory mentions the conflict between shareholders and management. The conflict is led by the different agendas of shareholders and managers, more specifically, the divergence between the control right and cash flow right. Therefore, ownership structure in this study includes managerial, institutional, and concentrated ownership.
i. Managerial Ownership
Managerial ownership refers to an ownership fraction or stake in a firm that is held by managers. Managerial ownership is not only meant to increase the equity of the organization but also to serve as incentives to managers to align managers’ interests with those of the interests of the organization. Managerial ownership is measured by natural logarithm of equity held by managers as shareholders in a firm.
ii. Institutional Ownership
Institutional ownership refers to an ownership fraction or stake in a firm that is held by large financial organizations, pension funds or endowments. Institutions generally purchase large blocks of a firm’s outstanding shares and can exert considerable influence upon its management. Therefore, institutional shareholders are usually professionals and they normally use their expertise in monitoring the management in ensuring that their interests align with those of the organization’s interests. Institutional ownership is measured by natural logarithm of equity held by various institutions as investors in the firm.
iii. Ownership Concentration
Ownership concentration refers to an ownership fraction or stake in a firm that is held by shareholders with the controlling interest or with large stake. Ownership concentration affords the shareholders the motivation and ability to monitor and control management decisions. Therefore, concentrated shareholders use their large stake in reducing conflicts between managers and the organization by being more proactive in monitoring and protecting their investments. Ownership concentration is measured by natural logarithm of equity held by block holders as investors in the firm.
Concept of Financial Performance
Financial performance measures how well a firm uses its resources to make a profit and it is a vital tool to several stakeholders in a firm. These stakeholders include trade creditors, bond holders, investors, employees, and management. Each group has its own interest in tracking the financial performance of a firm. Analysts learn about financial performance from published annual reports. The report is a required legal document that must be published by all public firms. The purpose of the report is to provide stakeholders with accurate and reliable financial statements that provide an overview of the firm’s financial
performance. Financial performance can be measured in several ways. Some of them are Book Value per Share, Earnings per Share, Return on Assets, Dividend per Share, Return on Equity, etc. Therefore, financial performance in this study is measured in term of Book Value per Share. The justification for chosen Book Value per Share as measure of financial performance by this study is because effect of ownership structure has been tested on several other financial indicators as mentioned earlier on insurance firms in Nigeria with the exception of BPS.
Book Value per Share (BPS)
BPS is the shareholders’ fund divide by the ordinary shares in issue and is expressed in naira or kobo. It indicates how much shareholder’s fund attributable to every share of the firm. Shareholders’ fund is a function of how effective and efficient money invested in the firm by shareholders are utilized. It helps in evaluating management commitment to wealth creation for shareholders. BPS is a combination of share capital, share premium, retained earnings, general reserve, and deposit for share.
Empirical Literature
The effect of ownership structure on financial performance has been widely researched and it produced very interesting debate in financial literature. The study focuses on some of the empirical studies conducted both locally and internationally on the effects of ownership structure on financial performance. Mwathi (2009) studied on the effects of commercial banks’ financial performance and their ownership structure. She categorized them as private banks, government banks, foreign banks, and domestic banks. Using regression analysis, the study was centered on banks where the top 10 shareholders hold more than 50% of the shares for the period between 2004 and 2008 in Kenya. Using ROA as the financial performance measure, the study revealed that bank ownership structure had an insignificant positive influence on financial performance. The findings also showed that both private and state owned banks had a negative correlation with performance. She underscored that both banks that are foreign owned and those owned domestically had a positive correlation with performance. The study hypothesized that commercial banks owned by states perform dismally than the foreign or domestic commercial banks. The study concluded that widely held banks perform well than closely held ones.
Demsetz and Lehn (1985) provided evidence of the endogeneity of large US firm’s ownership structure using a linear regression of an accounting measure of profit. In that model, the accounting measure of profit rate was assumed as a fraction of shares owned by the five largest shareholding interests and on a set of control variables in which ownership structure is treated as an endogenous variable. Their empirical study found no evidence of the relationship between profit rate and ownership concentration. Morck, Shleifer, and Vishny (1988) ignored the endogeneity issue altogether and re-examined the relation between corporate ownership structure and performance using Tobin’s Q and accounting profit rate as alternative measures of performance. They found no significant relation in the linear regressions they estimated.
Demsetz and Villanonga (2001) in a research titled "ownership structure and firm performance," examined the effect of ownership structure of shareholders and firm performance in a sample including 233 companies in the United States. Demsetz and Villanonga hypothesized that the ownership is considered as multidimensional and as an endogenous variable, found no meaningful statistical relation between the ownership structure and performance of the firm. As it is said by these researchers, the results of this research conformed to this point of view that, while the unfocused ownership may lead to aggravate the agency problem but it has benefits which may solve too much problems (Demsetz & Villanonga, 2001). Lemmon and Lins (2003) used a sample of 800 firms in eight East Asian countries to study the effect of ownership structure on value during the region’s financial crisis. The crisis negatively impacted firm’s investment opportunities, raising the incentives of controlling shareholders to expropriate minority investors. The evidence is consistent with the view that ownership structure plays an important role in determining whether insiders expropriate minority shareholders.
Additionally, using a sample of 144 Israeli firms, Lauterbach and Tolkowsky (2004) found that Tobin's Q is maximized when control group vote reaches 67%. This evidence is strong when ownership structure is treated as exogenous and weak when it is considered endogenous. Kaserer and Moldenhauer (2005) addressed the question whether there is any empirical relationship between corporate performance and insider ownership. Using a data set of 245 Germen firms for the year 2003, they found evidence for a positive and significant relationship between corporate performance, as measured by stock price
performance as well as by Tobin’s Q and insider ownership. Mueller and Spitz (2006) analyzed the relationship between managerial ownership and performance of German SMEs with motivational hypothesis testing in their research. They used a sample of 356 firms in services sector that are associated with business in their research, for the years 1997 to 2000. The findings showed that performance of companies with managerial ownership percentage, above 40 percent, is being improved (Mueller & Spitz, 2006).
Karamu (2008) in the research entitled "Relationship between institutional owners and informational content of profit" collected evidences in connection with the supervisory role of institutional investors from the perspective that whether institutional ownership as effect on the informational content of reported profit. In this research, the different attitudes (the active monitoring hypothesis and the self-interest hypothesis) were examined about institutional investors. To test the relationship between informational content of corporate profit and institutional ownership, two models of multiple linear regressions were used. Based on the results of this research, the number of institutional ownership does not increase informational content of profit and may also degrade it, while the level of institutional ownership does not reduce the informational content of profit, but it is also possible to increase it (Karamu, 2008).
Numazu and Karamu (2008) analyzed the "impact of ownership structure on corporate performance of listed companies in Tehran Stock Exchange (TSE)". The main hypothesis of this research emphasized the existence of a significant relationship between ownership structure and performance. Research sample included 66 companies during 1382 and 1386. Statistical method used to test hypotheses in this research was "panel data". In this research, the ownership structure is divided into two institutional and private ownership categories that the private ownership also is divided into three categories including corporate, management, and external shareholders. The findings of this research indicated that there is a negative and meaningful relation between institutional ownership and firm performance and a positive and meaningful relation between the corporate ownership and firm performance. Managerial ownership has a negative meaningful influence on the performance and in the case of private ownership, no information indicating the ownership of external investors was observed in the sample companies. In the private ownership, it is also better that the main part of ownership is held by corporate investors. In general, there
is a meaningful relation between the ownership structure and performance of the companies (Namazu & Karamu, 2008).
Alireza, Ali, and Kazem (2011) examined the effect of ownership structure on firm performance of listed firms in Tehran Stock Exchange between the period of 2001 and 2006. Using regression analysis, the study found that ownership concentration doesn’t have any significant effect on firm performance but the effects of two other variables are significant: institutional ownership has positive and significant effect on firm performance whereas concentrated institutional ownership is negative. Abosede and Kajola (2011) investigated the relationship between firms’ ownership structure and financial performance of listed companies in Nigeria between 2001 and 2008 respectively. Employing pooled OLS as a method of estimation and after controlling for four firm-specific characteristics, they found negative and significant relationship between ownership structure (director shareholding) and firm financial performance measured by ROE.
Ibrahim (2012) examined the effects of ownership structure on the financial performance of listed companies on the Nigerian Stock Exchange with the first finding showing a significant negative relationship between institutional ownership and firm financial performance measured in term of ROA and BPS and of course the second finding showed a significant positive effect between insider ownership and firm performance with firm growth as control variable having negative effect. Davis (2014) evaluated the effects of ownership structure on the financial performance of commercial banks in Kenya for the period 2009 and 2013. Using regression analysis, the study found that ownership structure positively affects the financial performance of commercial banks in Kenya.
Benjamin, Love, and Dandago (2014) examined the impact of ownership structure on the financial performance of listed insurance firms in Nigeria and they found a positive relationship between ownership structure and firm’s performance measured by ROA and ROE for the period 2001 and 2010. Anthony (2014) investigated the effect of ownership structure on financial performance of listed companies in the Nairobi Securities Exchange during the period 2008 to 2013. Employing linear regression analysis, the study found a positive effect of ownership concentration on financial performance measured by ROE. Also, a positive effect of ownership identity on financial performance was identified.
Reem, Allam, and Wajeeh (2015) assessed the relationship between ownership structure dimensions and corporate performance of 42 out of 48 listed companies in Bahrain for the period 2007 and 2011. The first finding showed that ownership concentration has a negative relationship on company’s performance measured by ROA and Tobin’s Q. Second finding showed that institutional ownership has a positive relationship on company’s performance. While the third finding showed that managerial ownership found a significance positive relationship with company’s performance.
Stanley (2015) assessed the impact of ownership structure on financial performance of listed Chinese banks between the periods 2005-2013. Using correlation analysis, the results revealed that there is no significant difference in performance between the two types of ownership structure (state-owned and joint venture).Helen and Bature (2016) evaluated the impact of ownership structure on the financial performance of listed conglomerate firms in Nigeria from the year 2004 to 2013. Using regression analysis, they found a negative impact of both managerial and foreign ownership and financial performance measured by Earning per Share (EPS) within the study period, while firm size as control variable positively impacted the firms Earnings per Share.
Abdul (2016) examined the impact of ownership structure on firm performance in India in terms of textiles, oil marketing and distribution, and movies and entertainment industries registered in Bombay Stock Exchange (BSE). The research was carried out on 50 companies listed under BSE covering the period of 2011-2015. Using correlation statistical analysis, the study found that ownership structure measured by managerial, concentrate, institutional, and foreign shareholding has influence on companies’ financial performance measured by ROA. Saseela and Thirunavukkarasu (2017) investigated the relationship between ownership structure and financial performance of listed beverage food and tobacco companies in Sri Lanka from the period of 2010 to 2015. The study also examined the impact of ownership structure on financial performance. Using Pearson’s correlation and regression analysis, the results revealed that the ownership concentration and foreign ownership structure are positively correlated with the financial performance of the companies measured by Return on Equity (ROE). The study also found a significant impact of foreign ownership structure on financial performance.
Finally, the findings of the foreign studies are very vital only that, differences in political and economic conditions among the nations may hardly allow their findings applicable to Nigeria. However, the last review on this area was those of Benjamin, Love, and Dandago (2014) with a dataset ranges from 2001-2010, whereas this study is considering the review from 2011-2016 which earlier identified as gap in chapter one to be filled by this study by extending the year of assessment to 2016, a period considered most relatively current. Theoretical Review
The Agency Theory
The agency theory was developed by Jensen and Meckling (1976). The theory states the relationship between principals such as shareholders, and agents such as a firm’s senior managers. The principal delegates work to an agent. The theory attempts to deal with first, the agency problem where there is a conflict of interests between a firm's managers and firm's stockholders, and second, that the principal and agent settle for different risk tolerances. Therefore, there are two main agency relationships in a firm that are normally in conflicts; those between the firm’s managers and stockholders and between the stockholders and the debt-holders. These agency conflicts have implications on corporate governance and business ethics. Such relationships have expensive agency costs that are incurred so as to sustain an effective agency relationship. Incentive fees paid to agents to encourage behavior consistent with the principal’s goals are common examples of agency costs (Bowie & Edward, 1992).
One of the ways of reducing agency problems is debt financing which helps those problems that are normally related to free cash-flow and asymmetric information problems especially in the case of privately held debt. Secondly, conflicts of interests between managers and shareholders also arise from the divisions between ownership and control. Managerial ownership can align the interests between them and owners, hence; reduce the total agency costs. The relationship between managerial ownership and agency costs is linear and the optimal point for the firm is achieved when the managers acquire all of the shares of the company according to Jensen and Meckling (1976). Thirdly, ownership concentration is the other option of reducing agency costs by shareholders proactively taking active roles in monitoring. This is however dependent on the amounts of their equity
stakes. The more the investor’s stake, the more motivated they are to monitor and protect their investment according to Gilson and Lang (1990).
According to Aggrawal and Knoeber (1996), agents such as company managers will highly unlikely venture into behaviors that are strictly profit maximizing where shareholders are not strictly monitoring their activities. The implication therefore is that, if owner-controlled firms are highly performing than manager-owner-controlled firms, the assumption is that concentrated ownership of insurance firms provides better monitoring which leads to better performance. Among the previous studies that adopted agency theory in explaining the effect of ownership structure on financial performance are those of Jensen and Meckling (1976), Benjamin, Love, and Dandago (2014), Helen and Bature (2016).
3. Methodology
The study adopts ex-post factor research design to examine the effect of ownership structure on financial performance of listed insurance firms in Nigeria. The population of this study is the listed insurance firms on the Nigerian Stock Exchange as at 31st December, 2016. As at the time of this study, there are 28 listed insurance firms in Nigeria. The entire population of the study was used based on the condition that the firms have complete data in their published annual reports for the periods under study. Multiple regression technique is used to analyze the panel data gathered for ownership structure and financial performance of listed insurance firms in Nigeria by means of STATA 12. A regression shows the effects one variable called independent has on the other variable called dependent which can either be positive or negative. The GLS regression is run to produce statistics for the coefficient of determination and f-test as well as t-test for results interpretation. The coefficient of determination (R2) measures the explanatory power of the Independent Variables on the Dependent Variables. T-Test measures the individual significance of the estimated Independent Variables, while F-Test measures the overall significance.
Hausman’s test is used to decide between the fixed effect and random effect estimates of the coefficients when there is present of heteroscedasticity in the results. Diagnostics test conducts by the study includes variance inflation factor (VIF) to test for multicolinearity which could mislead the results of the study. Hettest to test the error variances among variables so as the disturbances that could be appearing in the sampled firms are homoscedastics. The multiple regression model employed to determine the effect of
ownership structure on the financial performance of listed insurance firms in Nigeria is as shown below:-
BPSit = α0 + β1MGROWNit + β2INSTOWNit + β3OWNCONCit + β4SIZEit + β5GROWTHit + μit
MGROWN = Managerial Ownership, measured by natural log of equity held by managers.
INSTOWN = Institutional Ownership, measured by natural log of equity held by
institutions.
OWNCONC = Ownership Concentration, measured by natural log of equity held by
individuals with block vote.
SIZE = Firm Size, measured by natural log of total assets.
GROWTH = Firm Growth, measured by natural log of increase in total assets.
BPS = Book Value per Share, measured by shareholder’s fund divided by ordinary shares.
α0= Constant or Intercept;
β1 – β3= Coefficient of the explanatory Variables; β4 – β5= Coefficient of control variables;
μit = error term of firm i for time period t; it = firm i for time period t.
A priori expectations are β1, β2, β3, β4, ……… β5.
Theoretically, there are expectations of MGROWN, INSTOWN, OWNCONC, SIZE, and GROWTH, having no positive effect on BPS respectively.
4. Results and Discussion
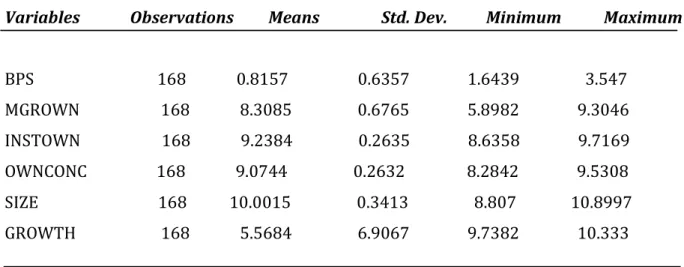
Table 1 below presents the descriptive statistics of all the variables. The MGROWN, INSTOWN, and OWNCONC which are the proxies of ownership structure, range between minimum of 5.8982, 8.6358, 8.2842 and maximum of 9.3046, 9.7169, 9.5308 within the timeframe.
Table 1: Summary of Descriptive Statistics of the Variables
Variables Observations Means Std. Dev. Minimum Maximum
BPS 168 0.8157 0.6357 1.6439 3.547 MGROWN 168 8.3085 0.6765 5.8982 9.3046 INSTOWN 168 9.2384 0.2635 8.6358 9.7169 OWNCONC 168 9.0744 0.2632 8.2842 9.5308 SIZE 168 10.0015 0.3413 8.807 10.8997 GROWTH 168 5.5684 6.9067 9.7382 10.333
Source: Descriptive Statistic Results Using STATA 12
From the Table above, the mean BPS of the firms over the year amounted to about N82 with minimum value of N164 and maximum value of N355 respectively. The standard deviation of about N64 shows the wide disparity in terms of ownership of the firms over the years. The table shows that the firms have a mean SIZE of about N1000 over the years under investigation. This shows that firms have enough assets to generate profit for the firms and owners of equity. The standard deviation of 34% indicates that there is considerable variation in the financial performance of the firms during the period under investigation. While some firms performed well and consistently reported good results, others performed poorly as they reported losses for some years. Also, the table shows that firms enjoy a mean GROWTH of about 6% over the period under study with a standard deviation of 7% showing the variation in the financial performance.
Table 2 shows the correlation between the dependent and independent variables. As evidenced from the table, the correlation coefficients are averagely good with highest 0.5232, which is the correlation between firm size and financial performance.
Table 2: Summary of Correlation Matrix of the Variables
BPS MGROWN INSTOWN OWNCONC SIZE GROWTH
BPS 1.0000 MGROWN 0.0512 1.0000 INSTOWN 0.0900 0.2037 1.0000 OWNCONC 0.0779 0.4119 0.6372 1.0000 SIZE 0.5232 0.4267 0.4072 0.5381 1.0000 GROWTH 0.3802 0.1815 0.3047 0.2762 0.4401 1.0000
Source: Correlation Matrix Results Using STATA 12
Table 2 displays the correlation values between dependent and independent variables and also the relationship within the independent variables themselves. The values were gotten from the Pearson correlation.
The Table shows that there are positive relationships between the dependent variables measured by Book value per Share (BPS) and the independent variables measured by managerial ownership (MGROWN), institutional ownership (INSTOWN), and Ownership Concentration (OWNCONC). Positive relationships also occur within the independent variables themselves. Positive relationships equally found between the control variables and other variables of the study.
The Table 3 below presents the regression results. The coefficients of the independent variables (MGROWN, INSTOWN, OWNCONC, SIZE, GROWTH) which explain the power of ownership structure on financial performance alongside the probability values are provided in the table. The table also provides the analysis on the relationships between the dependent and the independent variables. The relationships within the variables themselves were also shown on the table as well as the overall relationship.
Table 3: Summary of Regression Results Variables Coefficients Standard Error t-test Significant values Constant -5.1688 2.5269 -2.05 0.043 MGROWN 0.0324 0.1512 0.21 0.831 INSTOWN 1.7281 0.6775 2.55 0.012 OWNCONC -1.3391 0.6216 -2.15 0.033 SIZE 0.1870 0.1896 0.99 0.326 GROWTH 0.0058 0.0044 1.31 0.191 R-Squared 0.3843 Adjusted R-Squared 0.3653 Durbin Watson 1.65 F-Statistic 0.0000
Source: Output of data analysis by author using STATA 12
The cumulative R2 Overall (0.3843) which is the multiple coefficient of determination gives the proportion of the total variation in the dependent variable explained by the independent variables jointly. Hence, it signifies that 38% of the total variation in Book value per Share of listed insurance firms in Nigeria was caused by their managerial, institutional, and concentrated ownership respectively. Also, the regression results provided that Adjusted R2 is 0.3653 (see appendix I). This means that ownership structure of the listed insurance firms contributes about 37% to firm’s financial performance measured by BPS of the organization. This finding provides valid support of the contention that ownership structure can bring about a competitive advantage for a firm.
Discussion of Regression Results
Managerial Ownership and Financial Performance: The regression results revealed that
the managerial ownership as depicted in Table 3 has a coefficient value of 0.0324 with a p-value of 0.831 which is insignificant at 5%. This indicates that managerial ownership though positive but insignificantly affected the Book value per Share of the listed insurance firms in Nigeria. This implies that for every one naira proportionate increase in managerial
ownership of the firms, the BPS of the listed insurance firms in Nigeria will increase by 0.03 naira. This finding is in line with the studies of Benjamin, Love, and Dandago (2014).
Institutional Ownership and Financial Performance: The institutional ownership as
depicted in table 3 above has a beta value of 1.7281 with a p-value of 0.012 which is significant at 5% significant level. This indicates that institutional ownership has positively and significantly affected the BPS of the listed insurance firms in Nigeria. This implies that for every one naira proportionate increase in institutional ownership of the firms under investigation, the BPS will increase by 1.73 naira. This finding is however in line with those of Reem, Allam, and Wajeeh (2015) and Numazu and Karamu (2008).
Ownership Concentration and Financial Performance: The concentrated ownership as
depicted in table 3 above has a coefficient value of -1.3391 with a p-value of 0.033 which is significant at 0.05 level of significant. This indicates that institutional ownership is negatively and significantly affected the BPS of the listed insurance firms in Nigeria. This implies that for every one naira proportionate increase in ownership concentration of the firms under investigation, the BPS will decrease by 1.34 naira. This finding is however in line with those of Reem, Allam, and Wajeeh (2015) and Numazu and Karamu (2008).
The Hausman test: In ensuring greater results credibility and reliability, Hausman test was conducted by the researcher to decide between fixed effect and random effect. The results obtained from the Hausman test conducted indicate that fixed effect was decided against random effect (See Appendix I for the results).
5. Conclusion and Recommendations
Based on the empirical analysis, the researchers conclude that both managerial and institutional shareholding should be prioritized against block-holding (concentrated ownership) by insurance firms in Nigeria as this can increase the financial performance of the firms under investigation. This confirms to economic criterion, and could be supported by the work of Ibrahim (2012); he opined that an increase in managerial and institutional ownership could lead to an increase in the financial performance of an organization due to positive effects shown by his empirical analysis. It is therefore concluded that, organization's financial performance is dependent upon its managerial and institutional ownership structures as high managerial shareholding can stimulate management of an organization towards increased efficiency. Therefore, ownership by managers may be seen
as a system of aligning the interests of managers with those of the shareholders in a way that enhances corporate performance.
However, this form of managerial ownership can also lead to entrenchment of managers, which is costly when they chose to pursue their self interests against the interest of the organization. It has been argued that the overall effect of managerial ownership on firm performance depends on how well the entrenchment effect and incentive alignment are balanced (Cubbin & Leech, 1982; Hansmann, 1988, 1996; Hill & Jones, 1982; Nickel, 1997). The findings therefore, suggest that when managers also double up as shareholders, they are motivated to work towards realization of the wealth creation objective of the shareholders of whom they are part. On the other hand, managers who are not shareholders are more likely to engage in insider dealings as a way of enhancing their personal wealth and prestige. The institutional ownership which has also been identified in the study to have shown positive effect on firms’ financial performance was as a result of the fact that institutional investors are more sophisticated than other shareholders because they are more professional regarding capital markets, industries, and businesses and they are better informed. Apart from that, institutional shareholders have higher capabilities in taking actions and can therefore monitor managers more effectively and less costly (Hand, 1990).
From the conclusion drawn, it is imperative to recommend that:
1) there is dire need to reasonably increase managers’ shareholding of the listed insurance firms in Nigeria as not only meant to increase the equity of the firms but as a way of motivating them towards increasing their operational efficiency. At the same time, the managers should be protected by the Board of Directors from unnecessary direct interference by other shareholders.
2) the institutional ownership is one of the identified ownership structures that has proven empirically positive to firm’s financial performance in this study. This was linked by the researcher to the fact that institutional owners frequently deploy their professionalism and wealth of experience to the firms towards meeting corporate goals. Therefore, the institution ownership should be increased against concentrated ownership for better performance.
References
Abdul B. (2016). An assessment of the impact of ownership structure on firm performance in India. Journal of Accounting and Financial Reporting, 4, 345-476.
Abosede, A. J. & Kajola, S. O. (2011). An examination of the relationship between firms’ Ownership structure and financial performance of listed companies in Nigeria. Journal of Corporate Ownership and Control, 8, 276-400.
Agrawal, A., & Knoeber, C. R. (1996). Firm performance and mechanisms to control agency problems between managers and shareholders. Journal of Financial and Quantitative Analysis, 3, 377-469
Alireza, F., Ali, T. H. & Kazem, M. (2011). An examination of effect of ownership structure on performance of listed firms in Tehran Stock Exchange. Journal of Business and Management, 6, 112-265
Anthony A. (2014). An investigation of effect of ownership structure on financial performance of listed companies in Nairobi Securities Exchange. Journal of Accounting and Financial Reporting, 5, 213-369
Benjamin, K. G., Love, O. A., & Dandago, K. I. (2014). The impact of ownership structure on the financial performance in Nigerian Insurance Firms. Journal of Academic Research in Accounting, Finance, and Management Sciences, 4, 409-416.
Berle, A. A., & Means, G. C. (1932). The Modern Corporation and Private Property. New York: Macmillan.
Cho, M. H. (1998). Ownership structure, investment and the corporate value: An empirical analysis. Journal of Financial Economics, 47, 103-121.
Claessens, S., & Djankov, S. (1999). Ownership concentration and corporate Performance in the Czech Republic. Journal of Comparative Economics, 4, 498-513.
Claessens, S., Djankov, S., & Lang, L. H. P. (2000). The separation of ownership and control in East Asian corporations. Journal of Financial Economics, 58, 81-112.
Coffee, J. C. (2005). A theory of corporate scandals: Why the U.S. and Europe differ.
Columbia Law and Economics Working Paper No. 274.
Cubbin, & Leeh (1983). Manager-and owner-controlled companies and profitability. Journal of Corporate Finance, 5, 122-231.
Cyrus, W.N. (2013). Determinants of commercial banks profitability in Kenya: the case of Kenyan quoted banks. Unpublished MBA Project, University of Nairobi.
Davis, O. O. (2014). The effects of ownership structure on the financial performance of Kenyan listed commercial banks. Unpublished Research Project, University of Nairobi. Dadson, S. (2012). Concentrated share ownership and financial performance of listed
companies in Ghana. Journal of corporate finance, 38, 235-364.
Demsetz, H. (1983). The structure of ownership and the theory of the firm. Journal of Law and Economics, 26, 375-390.
Demsetz, H., & Villalonga, B. (2001). Ownership structure and corporate performance Journal of Corporate Finance, 7, 209-233.
Demsetz, H., & Lehn, K. (1985). The structure of corporate ownership: Causes and consequences. Journal of Political Economy, 93, 1155-1177.
Denis, D. K., & McConnell, J. J. (2003). International corporate governance. Journal of Financial and Quantitative Analysis, 38, 1-36.
Dlugosz, J., Fahlenbrach, R., Gompers, P., & Metrick, A. (2006). Large blocks of stock: Prevalence, size, and measurement. Journal of Corporate Finance, 12, 594-618.
Earle, J. S., Kucsera, C., & Telegdy, Á. (2005). Ownership concentration and corporate performance on the Budapest Stock Exchange: Do too many cooks spoil the goulash. Corporate Governance, 13, 254-264.
Ezazi, R. (2011). The effect of ownership structure on share price volatility of listed firms in Tehran Stock Exchange. Journal of Corporate Finance, 4, 122-231.
Fama, E. F., & Jensen, M. C. (1983). Separation of ownership and control. Journal of Law and Economics, 26, 301-325.
Grossman, S. J., & Hart, O. D. (1986). The costs and benefits of ownership: A theory of vertical and lateral integration. Journal of Political Economy, 94, 691-719.
Helen, A. A., & Bature, M. D. (2016).The impact of ownership structure on the financial performance of Nigerian listed conglomerate firms. Unpublished research paper in Kaduna State University. The Business and Management Review, 7,110-216.
Himmelberg, C. P., Hubbard, R. G., & Palia, D. (1999). Understanding the determinants of managerial ownership and the link between ownership and performance. Journal of Financial Economics, 53, 353-384.
Holderness, C. G. (2003). A survey of block-holders and corporate control. FRBNY Economic Policy Review, 9, 51-64.
Holderness, C. G., Kroszner, R. S., & Sheehan, D. P. (1999). Were the good old days that good? Changes in managerial stock ownership since the great depression. Journal of Finance, 5, 435-469.
Holderness, C., & Sheehan, D. (1988). The role of majority shareholders in publicly held corporations: An exploratory analysis. Journal of Financial Economics, 20, 317-346. Ibrahim, R. (2012).The effect of ownership structure on the financial performance of listed
companies in Nigeria. Journal of Accounting and Finance, 5, 213-298.
Jensen, M., & Meckling, W. (1976). Theory of the firm: Managerial behavior, agency costs, and ownership structure. Journal of Financial Economics, 3, 305-360.
Jensen, M. (1986). Agency costs of free cash flow, corporate finance and takeovers, American Economic Review, 76, 323-492.
Johnson, S., La Porta, R., Lopez-de-Silanes, F., & Shleifer, A. (2000). Tunneling. American Economic Review, 90, 22-27.
Karamu,K. (2008). Institutional ownership and profitability of listed Tehran firms in Tehran Stock Exchange. Journal of Accounting and Finance, 4, 213-237.
Kaserer, & Moldenhaner (2005). Insider ownership and corporate performance of listed German firms. Journal of Corporate Finance, 4, 101-214.
Kiruri, J. (2013). The effect of ownership structure on banks profitability in Kenya. Journal of Accounting and Finance, 6, 112-186.
Kole, S. R. (1995). Measuring managerial equity ownership: A comparison of sources of ownership data. Journal of Corporate Finance, 1, 413-435.
La Porta, P., Lopez-de-Silanes, F., & Shleifer, A. (1999). Corporate ownership around the world. Journal of Finance, 54, 471-517.
Lehmann, & Weigand (2000). Effect of large shareholders on profitability in Germany. An empirical analysis. Journal of Accounting and Finance, 8, 342-376.
Lins, K. (2002).Equity ownership and firm value in emerging markets, working paper, University of Utah.
Mueller, & Spitz (2006). Managerial ownership and financial performance of listed German SMEs. Journal of Corporate Finance, 2, 231-253.
Mwathi, H. (2009). Effect of commercial banks’ financial performance and their ownership structure in Kenya. Journal of Corporate Finance, 3, 126-265.
McConnell, J., & Servaes, H. (1990). Additional evidence on equity ownership and corporate value. Journal of Financial Economics, 27, 595-612.
Morck, R., Shleifer, A., & Vishny, R. (1988). Management ownership and market valuation An empirical analysis. Journal of Financial Economics, 20, 293-315.
Numan, & Karamu (2008). Impact of ownership structure on corporate performance of listed companies in Tehran Stock Exchange, Tehran. Journal of Corporate Finance, 2, 123-214.
Ongore, Obonyo, & Martin (2011). The implication of shareholder types on the financial performance. Journal of Accounting and Finance, 2, 101-211.
Pedersen, T., & Thomsen, S. (2000). The causal relationship between insider ownership owner identity and market valuation among the largest European companies. Copenhagen Business School, working paper.
Reem, Allam, & Wajeeh (2015). The relation between ownership structure dimensions and corporate performance of listed companies. Evidence from Bahrain. Australasian Accounting, Business, and Finance Journal, 9, 38-56.
Sadegbi, Sharif, & Bahadori (2009). Investigating the effect of ownership structure on dividend pay-out ratio of listed companies in Tehran Stock Exchange, Tehran. Journal of Corporate Finance, 3, 212-215.
Saseela, B. & Thirunavukkarasu, V. (2017). An investigation of the relationship between ownership structure and financial performance of the listed Beverage Food and Tobacco companies in Sri Lanka. Journal of Accounting and Financial Reporting, 7, 119-278.
Short, & Keasy (1999). Managerial ownership and financial performance of listed firms in Britain. Journal of Corporate Finance, 9, 235-311.
Shleifer, A., & Vishny, R. W. (1986). Large shareholders and corporate control. Journal of Political Economy, 94, 461-488.
Shleifer, A., & Vishny, R. W. (1997). A survey of corporate governance. Journal of Finance, 52, 737-783.
Stanley, J. I. (2015). An assessment of the impact of ownership structure on financial Performance of listed Chinese Banks. Journal of Management Science and Business Administration, 1, 26-33.
Stulz, R. (1988). Managerial control of voting rights. Journal of Financial Economics, 20, 25-59.
Thuku, T. (1992). The relationship between ownership structure and banks financial performance in Kenya. Journal of Accounting and Finance, 1, 98-121.
Xu, X., & Wang, Y. (1999). Ownership structure, corporate governance in Chinese stock companies. China Economic Review, 10, 75-98.
Zeitun, & Tian (2007). The effects of Ownership concentration on firm’s performance. Literature of finance.
Zhou, X. (2001). Understanding the determinants of managerial ownership and the link between ownership and performance: Comment. Journal of Financial Economics, 62, 559-571.
DEMOGRAPHY DEPT OAU Licensed to: DR BAMIWUYE OLUSINA Serial number: 40120570128 Single-user Stata perpetual license:
979-696-4601 (fax)
979-696-4600 stata@stata.com 800-STATA-PC http://www.stata.com Special Edition College Station, Texas 77845 USA 4905 Lakeway Drive
Statistics/Data Analysis StataCorp
___/ / /___/ / /___/ 12.1 Copyright 1985-2011 StataCorp LP /__ / ____/ / ____/
growth 168 5.568394 6.906723 -9.7382 10.333 size 168 10.00152 .3412885 8.807 10.8997 ownconc 168 9.074395 .2632442 8.2842 9.5308 instown 168 9.23841 .263507 8.6358 9.7169 mgrown 168 8.308446 .6764584 5.8982 9.3046 bps 168 .8156643 .6356879 -1.6439 3.547 Variable Obs Mean Std. Dev. Min Max . summarize bps mgrown instown ownconc size growth
growth 168 0.0000 0.2355 31.95 0.0000 size 168 0.0024 0.0013 16.06 0.0003 ownconc 168 0.0219 0.1218 7.13 0.0283 instown 168 0.8541 0.3174 1.05 0.5926 mgrown 168 0.0000 0.0000 45.80 0.0000 bps 168 0.3131 0.0000 17.63 0.0001 Variable Obs Pr(Skewness) Pr(Kurtosis) adj chi2(2) Prob>chi2 joint Skewness/Kurtosis tests for Normality
. sktest bps mgrown instown ownconc size growth
growth 0.3802 0.1815 0.3047 0.2762 0.4401 1.0000 size 0.5232 0.4267 0.4072 0.5381 1.0000 ownconc 0.0779 0.4119 0.6372 1.0000 instown 0.0900 0.2037 1.0000 mgrown 0.0512 1.0000 bps 1.0000 bps mgrown instown ownconc size growth (obs=168)
_cons -3.838051 1.714185 -2.24 0.027 -7.223078 -.4530237 growth .0188744 .0063991 2.95 0.004 .006238 .0315109 size 1.2002 .1514503 7.92 0.000 .9011286 1.499271 ownconc -.5346214 .2180699 -2.45 0.015 -.9652476 -.1039953 instown -.1489436 .1973717 -0.75 0.452 -.5386967 .2408095 mgrown -.1477818 .0664148 -2.23 0.027 -.2789322 -.0166315 bps Coef. Std. Err. t P>|t| [95% Conf. Interval] Total 67.4845449 167 .404099071 Root MSE = .50646 Adj R-squared = 0.3653 Residual 41.55298 162 .256499877 R-squared = 0.3843 Model 25.9315649 5 5.18631298 Prob > F = 0.0000 F( 5, 162) = 20.22 Source SS df MS Number of obs = 168 . regress bps mgrown instown ownconc size growth
Mean VIF 1.65 growth 1.27 0.786296 mgrown 1.31 0.760955 size 1.74 0.574893 instown 1.76 0.567827 ownconc 2.15 0.466081 Variable VIF 1/VIF . vif
Prob > chi2 = 0.0033 chi2(1) = 8.64 Variables: fitted values of bps Ho: Constant variance
Breusch-Pagan / Cook-Weisberg test for heteroskedasticity . hettest
delta: 1 unit
time variable: year, 2011 to 2016 panel variable: firms (strongly balanced) . xtset firm year
F test that all u_i=0: F(27, 135) = 14.24 Prob > F = 0.0000 rho .83628728 (fraction of variance due to u_i)
sigma_e .28283557 sigma_u .63924974 _cons -5.168761 2.526878 -2.05 0.043 -10.16615 -.1713731 growth .0058136 .0044282 1.31 0.191 -.002944 .0145713 size .1869576 .1895645 0.99 0.326 -.1879427 .5618579 ownconc -1.339104 .6215905 -2.15 0.033 -2.568418 -.1097888 instown 1.72805 .6774646 2.55 0.012 .3882332 3.067866 mgrown .0324149 .1511756 0.21 0.831 -.2665639 .3313936 bps Coef. Std. Err. t P>|t| [95% Conf. Interval] corr(u_i, Xb) = -0.4165 Prob > F = 0.0443 F(5,135) = 2.35 overall = 0.0292 max = 6 between = 0.0272 avg = 6.0 R-sq: within = 0.0800 Obs per group: min = 6 Group variable: firms Number of groups = 28 Fixed-effects (within) regression Number of obs = 168 . xtreg bps mgrown instown ownconc size growth, fe
rho .67638039 (fraction of variance due to u_i)
sigma_e .28283557 sigma_u .40889529 _cons -4.12958 2.092101 -1.97 0.048 -8.230023 -.0291379 growth .0065025 .0045031 1.44 0.149 -.0023235 .0153284 size .5226529 .1707322 3.06 0.002 .188024 .8572818 ownconc -.5188548 .3573183 -1.45 0.146 -1.219186 .1814762 instown .4560684 .3565179 1.28 0.201 -.2426938 1.154831 mgrown .0212628 .1028113 0.21 0.836 -.1802436 .2227692 bps Coef. Std. Err. z P>|z| [95% Conf. Interval] corr(u_i, X) = 0 (assumed) Prob > chi2 = 0.0033 Wald chi2(5) = 17.76 overall = 0.2699 max = 6 between = 0.3336 avg = 6.0 R-sq: within = 0.0442 Obs per group: min = 6 Group variable: firms Number of groups = 28 Random-effects GLS regression Number of obs = 168 . xtreg bps mgrown instown ownconc size growth, re
(V_b-V_B is not positive definite) Prob>chi2 = 0.0002
= 24.17
chi2(5) = (b-B)'[(V_b-V_B)^(-1)](b-B) Test: Ho: difference in coefficients not systematic
B = inconsistent under Ha, efficient under Ho; obtained from xtreg b = consistent under Ho and Ha; obtained from xtreg growth .0058136 .0065025 -.0006888 . size .1869576 .5226529 -.3356954 .0823726 ownconc -1.339104 -.5188548 -.8202487 .508624 instown 1.72805 .4560684 1.271981 .5760671 mgrown .0324149 .0212628 .0111521 .1108328 fe re Difference S.E. (b) (B) (b-B) sqrt(diag(V_b-V_B)) Coefficients . hausman fe re