32
/2014
Discussion Paper
The Innovation Path of the
Chinese Wind Power Industry
Yixin Dai
Yuan Zhou
Di Xia
Mengyu Ding
Lan Xue
Joint project with
:
Tsinghua University
The innovation path of the Chinese
wind power industry
Yixin Dai Yuan Zhou Di Xia Mengyu Ding Lan Xue Bonn 2014
Discussion Paper / Deutsches Institut für Entwicklungspolitik ISSN 1860-0441
Die deutsche Nationalbibliothek verzeichnet diese Publikation in der Deutschen Nationalbibliografie; detaillierte bibliografische Daten sind im Internet über http://dnb.d-nb.de abrufbar.
The Deutsche Nationalbibliothek lists this publication in the Deutsche Nationalbibliografie; detailed bibliographic data is available at http://dnb.d-nb.de.
ISBN 978-3-88985-658-6
Yixin Dai is an assistant professor in the School of Public Policy and Management at Tsinghua University.
E-mail: [email protected]
YuanZhou is an assistant professor in the School of Public Policy and Management at Tsinghua University.
E-mail: [email protected]
Di Xia is a doctoral student in the School of Public Policy and Management at Tsinghua University.
E-mail: [email protected]
MengyuDing is a doctoral student in the School of Public Policy and Management at Tsinghua University.
E-mail: [email protected]
LanXue is the dean and professor in the School of Public Policy and Management at Tsinghua University. E-mail: [email protected]
© Deutsches Institut für Entwicklungspolitik gGmbH Tulpenfeld 6, 53113 Bonn
+49 (0)228 94927-0 +49 (0)228 94927-130 E-Mail: [email protected] www.die-gdi.de
Abstract
The Chinese wind energy sector has undergone rapid development over the past 30 years, yet its path has differed from that of its European counterparts. There is much discussion in the literature on what the path of innovation is for the Chinese wind energy sector and where this path will lead. This research contributes to the literature by attempting to answer three questions: What is the technological path of innovation in China’s wind sector? How did this path of innovation emerge? What are the determinants of this path? To fully understand the Chinese wind energy innovation path, this research first summarises the history of the development of wind energy technology from the perspectives of both core technology innovation and deployment technology. The core technology innovation involved a change in strategy from preferring lower prices to preferring higher quality, from small-turbine to large-turbine technology and from imported technology to indigenous technology, while wind energy deployment experienced a path change from a centralised deployment pattern with a partial production chain to a de-centralised pattern with a whole-production-chain strategy.
Against these background features, this paper presents three individual cases of a wind turbine producer, a wind farm and a wind blade producer to illustrate how foreign collaboration and technology, choice of deployment strategy, and government policy have influenced the sector to continually improve its technology.
The findings indicate that foreign technology and collaboration have had a significant role in helping wind energy technology to develop in China, and were also key elements in stimulating indigenous innovation when high prices held the domestic wind market back from massive expansion. While public policy has played a key role in many aspects of the development of the innovation path, the long-term, enduring goal of developing the required technology was the essential driver. The development of the wind sector occurred alongside the economic development and social improvement of the nation. Thus, while it may be too soon to predict the future path of innovation for Chinese wind energy technology, an emphasis on research and development and increasing international competition is a trend that is likely to continue.
Preface
Mitigating climate change by reducing carbon emissions is one of the biggest and most complex issues the world has ever faced. Technological innovation plays a major role in taking on this challenge. Old and new industrial powers alike are increasingly reforming their policy frameworks to encourage low-carbon investment and innovation.
Evolutionary economics has demonstrated how initial choices of technologies and institutional arrangements preclude certain options at later stages; hence, innovations evolve in an incremental and cumulative way, resulting in context-specific technological pathways. Such path dependency implies that technologies and institutions do not progressively converge toward a unique best practice, as neoclassical equilibrium models might suggest. The historical and social embeddedness of such evolutionary processes instead results in a variety of very different technologies and institutions across countries.
The starting assumption of our research was that low-carbon technologies depend to a high degree on politically negotiated policies, mainly due to the failure of markets to reflect environmental costs. The way national governments and industries deal with the low-carbon challenge varies greatly depending on levels of environmental ambition, technological preferences (such as different attitudes towards nuclear energy, shale gas, carbon capture & storage), the ways markets are structured, and the importance attached to expected co-benefits (such as green jobs or energy security). Consequently, low-carbon technologies are more likely to evolve along diverging pathways than other technologies whose development is more market-driven.
To test this assumption we conducted the international research project “Technological trajectories for low-carbon innovation in China, Europe and India”. The project explored to what extent, how and why technological pathways differ across countries. Case studies were conducted in two technological fields, electromobility and wind-power technologies, in China, India and leading European countries. Whether a diversity of pathways emerges or a small number of designs becomes globally dominant has important implications. From an environmental perspective, diversity may help to mobilise a wide range of talents and resources and deliver more context-specific solutions. Convergence, on the other hand, might help to exploit economies of scale and thereby bring about bigger and faster reductions in the cost of new technologies. From an economic perspective, diversity may provide niches for many firms, whereas a globally dominant design is likely to favour concentration in a small number of global firms – which may or may not be the established ones. Comparing European incumbents with Asian newcomers is particularly interesting, because China and India might well become the gamechangers – responsible for most of the increase of CO2 emissions but also leading investors in green technology. In addition, the
project explored lessons for international technology cooperation, emphasising ways to navigate the trade-offs between global objectives to mitigate climate change effects and national interests to enhance competitiveness and create green jobs locally.
The project was carried out between 2011 and 2014 as a joint endeavour of four institutions: the German Development Institute / Deutsches Institut für Entwicklungspolitik (DIE), the Institute of Development Studies (IDS) Brighton, the Indian Institute of Technology (IIT) Delhi and the School of Public Policy at Tsinghua University, with additional collaborators from the Universities of Aalborg, London and Frankfurt. The project was truly
collabo-rative, to the extent that international teams jointly conducted interviews in China, India and Europe which helped to build common understanding.
Eight reports have been published in, or are currently being finalised for, the DIE Discussion Paper series:
(1) Altenburg, Tilman (2014): From combustion engines to electric vehicles: a study of technological path creation and disruption
(2) Bhasin, Shikha (2014): Enhancing international technology cooperation for climate change mitigation: lessons from an electromobility case study
(3) Chaudhary, Ankur (2014): Electromobility in India: attempts at leadership by businesses in a scant policy space
(4) Lema, Rasmus / Johan Nordensvärd / Frauke Urban / Wilfried Lütkenhorst (2014): Innovation paths in wind power: insights from Denmark and Germany
(5) Schamp, Eike W. (2014): The formation of a new technological trajectory of electric propulsion in the French automobile industry
(6) Ling, Chen / Doris Fischer / Shen Qunhong / Yang Wenhui (forthcoming): Electric vehicles in China: bridging political and market logics
(7) Dai, Yixin / Yuan Zhou / Di Xia / Mengyu Ding / Lan Xue (2014): The innovation path of the Chinese wind power industry
(8) Narain, Ankita / Ankur Chaudhary / Chetan Krishna (forthcoming): The wind power industry in India.
On the basis of these case studies, the team is currently working on a series of cross-country comparative analyses to be published in academic journals.
The research team is very grateful for generous funding and the very supportive attitude of the Swedish Riksbankens Jubileumsfond under a joint call with the Volkswagen Foundation and Compagnia de San Paolo.
Contents
Abbreviations
1 Introduction 1
1.1 Key research questions 2
1.2 Research methodology 3
2 Wind power development in China 4
2.1 Contextual background of the development of wind energy technology
worldwide 4
2.2 Development of the Chinese wind energy industry 8
2.2.1 Contextual background of wind energy development in China 8
2.2.2 Rapid development of the Chinese wind energy sector 8
2.2.3 Booming wind market at a transition point 10
2.3 The policy framework for wind energy innovation in China 12
3 The innovation path for Chinese wind energy development 15
3.1 The innovation path for core wind energy technology 15
3.1.1 Moving from a strategy of ‘preferring lower prices’ to one of ‘preferring
higher quality’ 15
3.1.2 Moving from ‘small turbine’ to ‘large turbine’ technology 15
3.1.3 Moving from ‘imported technology’ to ‘indigenous technology’ 16
3.2 The innovation path for wind energy deployment 17
3.2.1 The shift from a centralised deployment pattern to a de-centralised pattern 17
3.2.2 The shift from a partial production chain to a whole production chain
strategy 18
4 A description of specific cases of innovation 21
4.1 GoldWind 1.2 MW turbine technology development 21
4.1.1 Background information 21
4.1.2 Technological innovation event of the 1.2 MW wind turbine 21
4.1.3 Summary and conclusions 23
4.2 Jiuquan wind farm construction – a large-scale deployment project in China 23
4.2.1 Background information 23
4.2.2 The innovation path for deployment at the Jiuquan Wind Base 24
4.2.3 Technological difficulties at the Jiuquan Wind Base 24
4.2.4 Summary and conclusions 25
4.3.1 Background information 25
4.3.2 Key elements of HT’s technological innovation path 26
4.3.3 Summary and conclusions 28
5 Key elements of the formation of the Chinese wind energy innovation
path 29
5.1 The role of foreign products and imported technology 29
5.1.1 Stage One: Foreign donated wind farms served to ‘jump-start’ the
development of Chinese wind energy technology in the 1980s 29
5.1.2 Stage Two: Imported products and collaborative R&D advance the
development of Chinese wind energy technology from the late 1990s to the
early 2000s 29
5.1.3 Stage Three: Foreign firm acquisition improves the indigenous innovation
capacity of the Chinese wind energy sector around 2008 30
5.2 The role of public policy 31
5.2.1 Long-term wind energy policy guarantees continuous technology
innovation 31
5.2.2 Deployment policy influences formation of the technology innovation path 31
5.2.3 Assorted policy instruments jointly influence indigenous innovation 32
5.2.4 Administrative changes to influence the future of wind energy innovation 33
5.3 The role of economic development and internationalisation 33
5.3.1 Internationalisation as the main mechanism influencing the path of
innovation 33
5.3.2 National economic paradigm influenced wind energy innovation path 34
Figures
Figure 1: Cumulative world total installed wind power capacity, 1997–2011
(MW) 5
Figure 2: World new installed wind power capacity, 1997–2011 (MW) 5
Figure 3: Top 10 countries by cumulative installed wind power capacity 6
Figure 4: Top 10 countries by growth rate of wind energy (%): markets bigger
than 200 MW 7
Figure 5: Change in the Chinese installed wind energy capacity, 2001–2011 9
Figure 6: Market share of top manufacturers in China 11
Figure 7: Development trend of the average unit capacity of wind turbines 16
Tables
Table 1: Top-ranking countries for wind energy deployment (2011) 4
Table 2: Planned capacity of main wind bases 9
Table 3: Provincial cumulative installed capacity in 2011 10
Table 4: Key wind energy policies in China 13
Table 5: New installed capacity and cumulative capacity (MW) of the Top 15
manufacturers in China 16
Table 6: Four types of wind farm operator in China 19
Table 7: Top 10 wind farm enterprises with the largest new installed capacity in
2011 20
Table 8: Top wind farm enterprises with the largest grid-connection capacity in
2011 20
Abbreviations
BMUB Bundesministerium für Umwelt, Naturschutz, Bau und Reaktorsicherheit (Federal Ministry for the Environment, Nature Conservation, Building and Nuclear Safety, Germany)
BMWi Bundesministerium für Wirtschaft und Energie (Federal Ministry for Economic Affairs and Energy, Germany)
CAE Chinese Academy of Engineering CO2 Carbon dioxide
CPI China Power Investment Corporation CTC Climate Technology Network, Netherlands
EU European Union
GDP Gross domestic product GHG Greenhouse gas
GW Gigawatt
GWh Gigawatt hour
HT Hui Teng
IEA International Energy Agency
KV Kilovolt
kW Kilowatt
kWh Kilowatt hour
kW/km2 Kilowatt per square kilometre LVRT Low voltage ride through M&A Mergers and acquisitions
MoFTE Ministry of Foreign Trade and Economic Cooperation, China MoST Ministry of Science and Technology, China
MW Megawatt
NDRC National Development and Reform Commission, China
NOx Nitrogen oxide
NPC National People’s Congress, China
OECD Organisation for Economic Co-operation and Development OEM Original equipment manufacturer
PMDD Permanent magnet direct drive R&D Research and development REL Renewable Energy Law, China
SDIC State Development and Investment Corporation, China SERC State Electricity Regulatory Commission, China SO2 Sulphur dioxide
TWH Terawatt-hours UHV Ultra-high voltage
US United States
USD United States dollars VAT Value-added tax
W Watts
The innovation path of the Chinese wind power industry
German Development Institute / Deutsches Institut für Entwicklungspolitik (DIE) 1
1 Introduction
Climate change is becoming one of the most important issues in human development. Countries, states and cities are searching for ways in which to reduce greenhouse gas (GHG) emissions by changing modes of human development. The widely discussed philosophy of ‘low-carbon development’ is accepted as the future developmental mode for reducing carbon dioxide emissions while preserving economic growth. There is a consensus that technological innovation and development may help humans to fulfil the goal of low-carbon development. The Kyoto Protocol, for example, states that to fulfil their responsibilities in reducing GHG emissions, Annex I countries should undertake
“research on, and promotion, development and increased use of, new and renewable forms of energy, of carbon dioxide sequestration technologies and of advanced and innovative environmentally sound technologies”. As the first agreement made in response to climate change, the Kyoto Protocol considered developing countries (those not in Annex I) mainly as receivers of technology.
In practice, various countries are encouraging multiple technology developments. The European Union has taken a leading position in response to climate change, in terms of both equipment production and technology deployment. Technologies such as renewable energy, electronic mobility, power storage, fuel cells and energy efficiency technology have been strongly promoted in the recent national strategy plans of countries such as Denmark, Germany, France and the United Kingdom (BMWi / BMUB 2010).
World economic development and the distribution of GHG emissions have changed since 1997. Emerging powers have high rates of economic development and increasing amounts of GHG emissions. Although they were not included in the Kyoto Protocol China, India, Russia and Brazil have become important players in the global climate strategy.
Having maintained its economic development at the high rate of 8-10% for almost a decade, China has not only experienced rapid economic and social development, but has also incurred heavy environmental costs. China has become the world’s largest emitter, overtaking the United States (IEA 2007). In 2013, the number of smog days with heavy air pollution exceeded 51% in Beijing.1 Faced with international pressure to reduce GHG emissions and improve its poor domestic environment, China has put much effort into drawing up a climate change strategy and gearing its economic development to a low-carbon mode. For example, China now has a large share of the wind turbine market. Its increasing market share and the high growth rate of this industry positions China as a potential competitor for developed countries in the area of wind energy.
During the process of developing its wind energy industry, China followed a different path of technological innovation that attracted much attention from academics. Having relatively small R&D (research and development) capacities, Chinese firms forged ahead by importing production lines, gaining technological licenses through acquisition, and purchasing intellectual property. China’s strong manufacturing base, low labour costs and extensive investment in the industry resulted in Chinese wind energy technology taking a different path from that of its EU counterparts.
1 Data source: calculated from Beijing air-quality monitoring station data, http://www.bjmemc.com.cn/ g372.aspx.
Yixin Dai et al.
2 German Development Institute / Deutsches Institut für Entwicklungspolitik (DIE)
First, China experienced rapid development in the manufacture of wind energy equipment. In 2011, 29 major wind turbine manufacturers were producing parts, equipment and wind turbine systems in China. Having installed 17.63 GW of wind turbine capacity in 2011, China became the global leader in terms of both annual installed capacity and total installed capacity, with the total capacity reaching 62.36 GW and accounting for 40% of global installed capacity.
Second, the speed of wind energy deployment was also rapid despite severe grid connection problems (Wang 2010). In 2012, grid-connected wind energy provided 100,800 GWh (millions of kilowatt hours), equivalent to 2% of China’s total electricity production. However, the national annual average for hours of use decreased from 1920 hours in 2011 to 1890 hours in 2012. East Inner Mongolia and Jilin experienced the most severe wind energy curtailment, which exceeded 50% during the cold season. West Inner Mongolia, Jiuquan in Gansu, and Zhang Jiakou also had averages of 20% wind energy curtailment (Zhang 2014).
Third, China set a goal of increasing its indigenous R&D capacity regarding large wind turbines. Starting with the Renewable Energy Law of 2006, China has consistently emphasised the importance of indigenous innovation. In the wind energy sector, national science and technology programmes, such as Numbers 863 and 973, have designed wind projects. However, the question of whether the R&D capacity of Chinese wind energy firms is sustainable remains (Wang / Qin / Lewis 2012). Will innovation continue after the recent spate of acquisitions?
Now that the Chinese wind energy sector has gone through the stages of ‘low-cost manufacturing’, ‘spate of acquisitions’ and ‘intended indigenous R&D’, it is time to re-examine the sector from the perspective of the many unique aspects of wind energy in China but within the context of the broader lessons learned from other societies. The big question to be answered is: Does the development of Chinese wind energy technology represent a different path of innovation, and is this path of innovation sustainable?
1.1 Key research questions
Our overall research question can be sub-divided into the following independent, yet interrelated, research questions:
1) What is the path of technological innovation in China in response to climate change?
2) How did this path of innovation emerge?
3) What are the determinants of this path of innovation?
To summarise the development of the wind energy sector over the past 30 years, a detailed description of the sector’s development, with specific focus on the unique contextual changes, is first required. The Chinese wind energy sector did not develop in isolation. It learned about possible directions for technology and policy from leading firms and countries in the sector and had several opportunities to move ahead during technological development. Understanding how these international contexts shaped the Chinese wind energy sector is essential to explaining the key determinants of the path of innovation. Additionally, the Chinese wind energy sector has also been influenced by the national
The innovation path of the Chinese wind power industry
German Development Institute / Deutsches Institut für Entwicklungspolitik (DIE) 3 industrialisation process. Key changes in policy and the national development paradigm have affected all sectors, with the wind energy sector being no exception. Analysis of these effects would help us to understand how Chinese wind energy technology has developed along a concurrent path of innovation, and would guide policymakers in making the adjustments required to continue to stimulate the development of the sector.
1.2 Research methodology
To illustrate the overall country–sector–technology aspects, this research used case studies to explain the specific innovation path taken by China.
We first explored different cases to identify the innovation path and its changes. This paper defines ‘innovation case’ as ‘any event that has made an impact or has the potential to make an impact on the climate change mitigation potential of the technology.’2
To discover key cases, the research team began by interviewing the key stakeholders involved in the development of wind energy technology in China, including government officials, technological experts and enterprises (manufacturers and wind farms), to identify initial innovation cases that might have influenced the innovation path of the industry. Further interviews were then conducted using the ‘snowball’ strategy to extend the potential pool of technological innovation cases.
From all of the cases identified, three key cases were selected for further exploration according to two selection criteria. First, only innovations that had reached the stage of commercial success were considered. Second, due to the enormous number of innovation cases in the wind energy sector, only major innovations that could potentially shape a national technological path were selected. Thus, the research did not focus on single, incremental technological improvements conducted by different players in the industry. To take the continuity of any innovation case into consideration, attempts were made to set up a relatively clear boundary for each case by identifying the type of innovation and the players, and thus permitting the path of technological innovation of each case to be illustrated.
The key factors influencing each innovation case were also addressed, with a particular focus on policy factors, a firm’s competition strategy, and international collaboration. Questions were asked as to whether and how innovation capabilities arose, and what direction the innovation path took. Interview questions were adjusted for each case so that the views, interests and actions of the various different stakeholders could be recorded for further analysis.
The remainder of this paper is organised as follows: Section 2 provides a broad review of the industrial development of wind energy worldwide and the rapid growth in the Chinese wind energy industry. The trends of the innovation paths for core technology and deployment are described in Section 3. Section 4 describes three cases that illustrate the key factors influencing the changes in the Chinese wind innovation path. A discussion and conclusions are presented in Section 5.
2 This definition is taken from the collaborative research project ‘Technological Trajectories for Climate Change Mitigation in China, Europe and India’.
Yixin Dai et al.
4 German Development Institute / Deutsches Institut für Entwicklungspolitik (DIE)
2 Wind power development in China
2.1 Contextual background of the development of wind energy technology worldwide
Wind energy is an important renewable resource that has seen dramatic development globally since the late 1970s. Two factors drove this development: the energy crisis of the early 1970s that fostered wind power as a global industry based on technological evolution, and the later concern over global climate change, in particular the implementation of the Kyoto Protocol, that opened up world markets for renewable energy. As the pressure to reduce GHG emissions continued to increase, wind energy contributed an increasingly greater share of the world’s energy consumption. In 2008, wind energy provided nearly 20% of the electricity consumed in Denmark, more than 11% of that in Portugal and Spain, 9% of that in Ireland, nearly 7% of that in Germany, more than 4% of all European Union (EU) electricity, and nearly 2% of that in the United States (IEA 2009). The total installed wind power capacity increased from 7,480 MW in 1997 to 237 GW in 2011, an increase of 31 times the 1997 amount. Altogether, wind power provided 500 TWH (terawatt-hours) per annum, equivalent to 3% of global electricity consumption (IEA 2009).
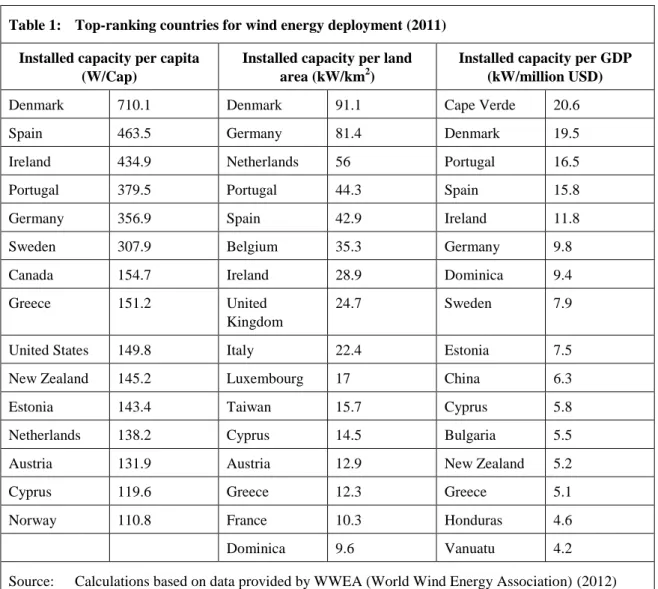
Table 1: Top-ranking countries for wind energy deployment (2011) Installed capacity per capita
(W/Cap)
Installed capacity per land
area (kW/km2)
Installed capacity per GDP (kW/million USD)
Denmark 710.1 Denmark 91.1 Cape Verde 20.6
Spain 463.5 Germany 81.4 Denmark 19.5
Ireland 434.9 Netherlands 56 Portugal 16.5
Portugal 379.5 Portugal 44.3 Spain 15.8
Germany 356.9 Spain 42.9 Ireland 11.8
Sweden 307.9 Belgium 35.3 Germany 9.8
Canada 154.7 Ireland 28.9 Dominica 9.4
Greece 151.2 United
Kingdom
24.7 Sweden 7.9
United States 149.8 Italy 22.4 Estonia 7.5
New Zealand 145.2 Luxembourg 17 China 6.3
Estonia 143.4 Taiwan 15.7 Cyprus 5.8
Netherlands 138.2 Cyprus 14.5 Bulgaria 5.5
Austria 131.9 Austria 12.9 New Zealand 5.2
Cyprus 119.6 Greece 12.3 Greece 5.1
Norway 110.8 France 10.3 Honduras 4.6
Dominica 9.6 Vanuatu 4.2
The innovation path of the Chinese wind power industry
German Development Institute / Deutsches Institut für Entwicklungspolitik (DIE) 5
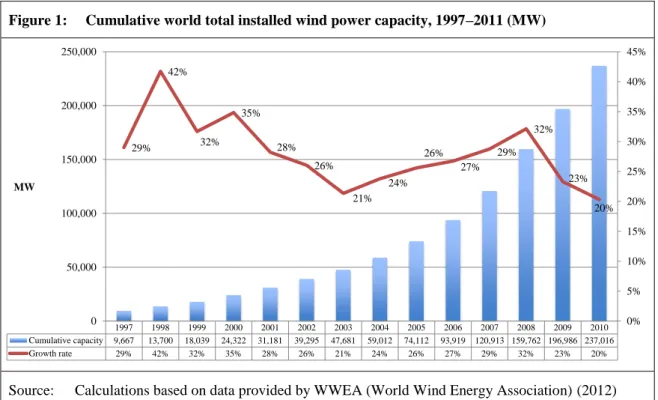
Figure 1: Cumulative world total installed wind power capacity, 1997–2011 (MW)
Source: Calculations based on data provided by WWEA (World Wind Energy Association) (2012)
The average growth rate is defined as the ratio of newly installed wind power capacity to the installed capacity of the previous year. Wind energy experienced a stable and high average growth rate of above 20% each year between 1997 and 2011. There was a downturn in 2009 due to the global financial crisis, but in 2011 new installations were able to take the cumulative total installed capacity to the historical high of 40 GW (WWEA 2012).
Figure 2: World new installed wind power capacity, 1997–2011 (MW)
Source: Calculations based on data provided by WWEA (2012)
The world wind energy market has seen a clear shift in the distribution of production capacity and the scale of deployment during the past two decades. Initially, developed counties such as Denmark, the United States, the United Kingdom and Germany led the early attempts to develop wind power energy in response to climate change. Both
1999 2000 2001 2002 2003 2004 2005 2006 2007 2008 2009 2010 2011 New capacity 4,033 4,339 6,282 6,859 8,114 8,386 11,331 15,100 19,807 26,972 38,334 37,773 40,053 Growth rate 84% 8% 45% 9% 18% 3% 35% 33% 31% 36% 42% -1% 6% 84% 8% 45% 9% 18% 3% 35% 33% 31% 36% 42% -1% 6% -10% 0% 10% 20% 30% 40% 50% 60% 70% 80% 90% 0 5,000 10,000 15,000 20,000 25,000 30,000 35,000 40,000 45,000 MW 1997 1998 1999 2000 2001 2002 2003 2004 2005 2006 2007 2008 2009 2010 Cumulative capacity 9,667 13,700 18,039 24,322 31,181 39,295 47,681 59,012 74,112 93,919 120,913 159,762 196,986 237,016 Growth rate 29% 42% 32% 35% 28% 26% 21% 24% 26% 27% 29% 32% 23% 20% 29% 42% 32% 35% 28% 26% 21% 24% 26% 27% 29% 32% 23% 20% 0% 5% 10% 15% 20% 25% 30% 35% 40% 45% 0 50,000 100,000 150,000 200,000 250,000 MW
Yixin Dai et al.
6 German Development Institute / Deutsches Institut für Entwicklungspolitik (DIE)
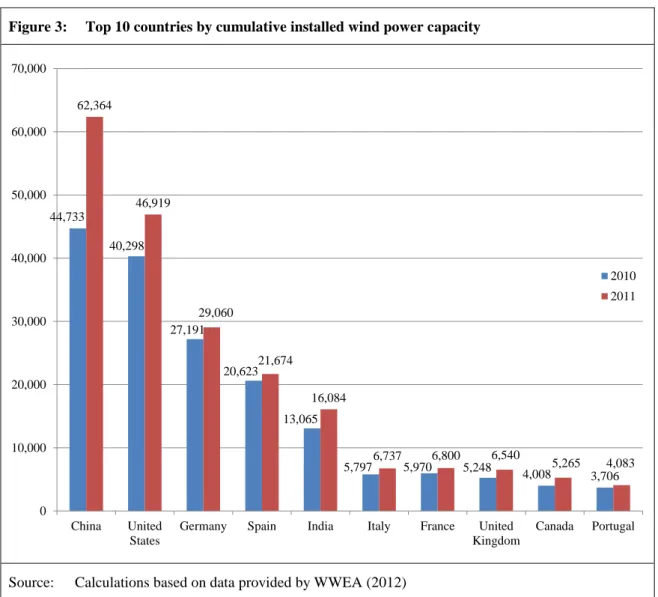
technological and market development were dominated by these countries. Emerging economies, such as those of China and India, began to catch up around the end of the 20th century and rapidly gained a large market share. In 2011, both China and India were listed among the top five market owners in terms of accumulated installation capacity; indeed, China was ranked first (see Figure 3). The degree of market concentration continued to increase, with the top 10 countries holding 87% of the world market. Meanwhile, the distribution of the market was hard to predict as the growth rate of the emerging powers was dramatically higher than that of the ‘traditional giants’ (see Figure 4).
Figure 3: Top 10 countries by cumulative installed wind power capacity
Source: Calculations based on data provided by WWEA (2012)
Alongside manufacturing capacity, developing countries were also catching up in terms of cumulative deployment. Indicators such as installed capacity per capita, installed capacity per land area, and installed capacity per GDP (gross domestic product) describe the cumulative deployment level for different countries. The global average density of wind capacity per person is 34 W (watts). Denmark’s density had reached 710.1 W/Cap in 2011, and Spain’s, Ireland’s, Portugal’s and Germany’s were 463.5 W/Cap, 434.9W/Cap, 379.5 W/Cap and 356.9 W/Cap, respectively. In 2011, China ranked 34th with 46 W/Cap, and India was 51st with 13W/Cap, below the global average. For installed capacity per land area, Denmark’s and Germany’s density had reached 91.1 kW/km2
(kilowatt per 44,733 40,298 27,191 20,623 13,065 5,797 5,970 5,248 4,008 3,706 62,364 46,919 29,060 21,674 16,084 6,737 6,800 6,540 5,265 4,083 0 10,000 20,000 30,000 40,000 50,000 60,000 70,000 China United States
Germany Spain India Italy France United Kingdom
Canada Portugal 2010 2011
The innovation path of the Chinese wind power industry
German Development Institute / Deutsches Institut für Entwicklungspolitik (DIE) 7 square kilometre) and 81.4 kW/km2, respectively, representing leading positions in large economies. For installed capacity per GDP, Denmark again maintained its leading position with 19.5 kW/million USD. Portugal’s and Spain’s indicators were 16.5 kW/million USD and 15.8 kW/million USD, respectively (WWEA 2012).
Figure 4: Top 10 countries by growth rate of wind energy (%): markets bigger than 200 MW
Source: WWEA (2012)
According to the International Energy Agency, the wind energy industry will continue to grow. It is estimated that the share of electricity generated from wind could reach 12% by 2050. Meanwhile, two major trends are expected to affect the development of wind energy development. First, more countries will enter into competition and affect market share. For example, by 2030 non-OECD economies are predicted to produce 17% of global wind energy, rising to 57% in 2050. Second, technological improvements have a significant role to play. As technology is developed, investment costs are predicted to be reduced by 23% by 2050, equating to around 70 to 130 US dollars per MWh (IEA 2009).
With more developing countries entering into competition, it is important to review the new power distribution, especially in terms of innovation capacity. Will developing countries such as China gain sufficient innovation capacity to threaten the leading wind energy countries such as Denmark, Germany and the United States?
39.8 73.0 139.0 53.7 37.1 23.5 0.0 78.3 0.8 0.8 130.6 82.7 80.5 75.4 46.2 46.2 46.2 45.1 40.3 36.0 0 20 40 60 80 100 120 140 160
Romania Ukraine Argentina Brazil Poland Estonia Finland Mexico United Kingdom
Bulgaria 2011 2012
Yixin Dai et al.
8 German Development Institute / Deutsches Institut für Entwicklungspolitik (DIE)
2.2 Development of the Chinese wind energy industry
2.2.1 Contextual background of wind energy development in China
The energy demands of China have increased alongside its rapid economic development. Total energy consumption for the nation rose from 987 million tons of standard coal in 1990 to 3.54 billion tons in 2010, making China the largest consumer of energy in the world (Wang 2012). China became a net oil importer in 1993 and a net coal importer in 2009, with more than 100 million tons of coal imported per year (Wang 2012). From 2006, the price of fossil fuel has fluctuated widely on the global market. China has thus experienced great pressure in terms of its reliance on, and security from, energy.
Historically, China relied on coal as its main source of energy due to its extensive coal resources. Coal’s share of total energy consumption reached 70.5% in 2010. Massive coal consumption caused China to emit large quantities of CO2, SO2, NOx (carbon dioxide,
sulphur dioxide, nitrogen oxide) and industrial dust. In 2009, the Chinese government promised to reduce CO2 emissions to 40–50% of the 2005-level by 2020, and raise the
share of non-fossil-fuel energy production to 15% (Wang 2012). Coming mainly from hydroelectric, nuclear and wind energy sources, in 2011 China’s non-fossil-fuel energy only accounted for 284 million tons of standard coal, equivalent to 8% of total energy production (Wang 2012). Pressure to protect the environment is also pushing China to develop renewable energy rapidly.
The expansion of wind energy, which is regarded as a safe and renewable source of energy, attracted less political opposition than hydroelectric and nuclear power, which are associated with environmental risks and damage. In addition, the cost of wind energy had been reduced to a level that made it competitive with coal in the electricity market, far below the levels of photovoltaic and biomass energy. Moreover, the scale effect achieved by the massive production and deployment of wind energy would further reduce the cost of wind farm construction and operation. The development of wind energy was therefore a rational choice for China to achieve its energy plan for the 21st century.
2.2.2 Rapid development of the Chinese wind energy sector
China has vast wind resources within its territory.3 It began to explore wind energy resources in the 1950s with the goal of providing a rural energy supply. Wind-powered water pumps were one of the developments of this period. Pilot studies and trial deployments of wind energy for the purpose of electricity generation began in the 1970s in response to the energy crisis. However, true industrialisation did not occur until 1986, when the first wind turbines began to generate electricity.
After the implementation of the Kyoto Protocol in 2003, the Chinese wind energy industry experienced rapid growth in both manufacturing capacity and installed capacity, alongside the expansion of the international wind market (Li et al. 2008; Li / Shi / Gao 2011). From
3 Data vary in different reports and documents. This paper cites the latest data obtained in a recent interview with the Center for Wind and Solar Energy Resources Assessment, China Meteorological Administration, on 17 Jul. 2012.
The innovation path of the Chinese wind power industry
German Development Institute / Deutsches Institut für Entwicklungspolitik (DIE) 9 the manufacturing perspective, China became the world’s largest wind energy manufacturer, with an average annual growth rate of 130% despite the worldwide financial crisis between 2004 and 2010 (see Figure 5).
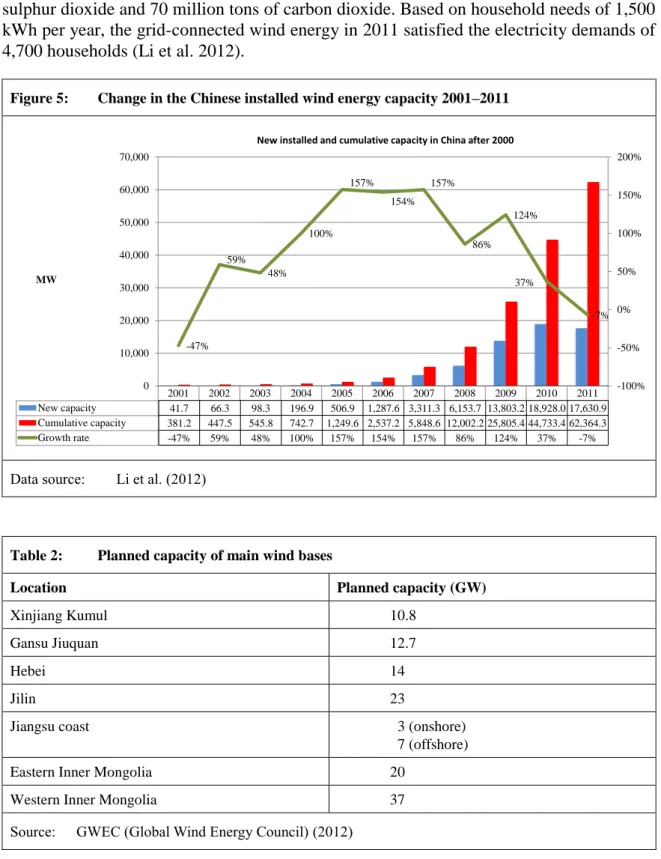
In contrast to its solar electricity industry, China’s wind energy sector relied on the domestic market for its development from the very beginning. With several 10 GW wind farms under construction (see Table 2), in 2011 grid-connected wind energy saved 22 million tons of coal from being burnt and thus reduced emissions by 360,000 tons of sulphur dioxide and 70 million tons of carbon dioxide. Based on household needs of 1,500 kWh per year, the grid-connected wind energy in 2011 satisfied the electricity demands of 4,700 households (Li et al. 2012).
Figure 5: Change in the Chinese installed wind energy capacity 2001–2011
Data source: Li et al. (2012)
Table 2: Planned capacity of main wind bases
Location Planned capacity (GW)
Xinjiang Kumul 10.8
Gansu Jiuquan 12.7
Hebei 14
Jilin 23
Jiangsu coast 3 (onshore)
7 (offshore)
Eastern Inner Mongolia 20
Western Inner Mongolia 37
Source: GWEC (Global Wind Energy Council) (2012)
2001 2002 2003 2004 2005 2006 2007 2008 2009 2010 2011 New capacity (MW) 41.7 66.3 98.3 196.9 506.9 1287.6 3311.3 6153.7 13803.2 18928 17630.9 Cumulative capacity (MW) 381.2 447.5 545.8 742.7 1249.6 2537.2 5848.6 12002.2 25805.4 44733.4 62364.3 Growth rate -47% 59% 48% 100% 157% 154% 157% 86% 124% 37% -7% -47% 59% 48% 100% 157% 154% 157% 86% 124% 37% -7% -100% -50% 0% 50% 100% 150% 200% 0 10,000 20,000 30,000 40,000 50,000 60,000 70,000
New installed and cumulative capacity in China after 2000
41.7 66.3 98.3 196.9 506.9 1,287.6 3,311.3 6,153.7 13,803.2 18,928.0 17,630.9 381.2 447.5 545.8 742.7 1,249.6 2,537.2 5,848.6 12,002.2 25,805.4 44,733.4 62,364.3 -47% 59% 48% 100% 157% 154% 157% 86% 124% 37% -7%
Yixin Dai et al.
10 German Development Institute / Deutsches Institut für Entwicklungspolitik (DIE)
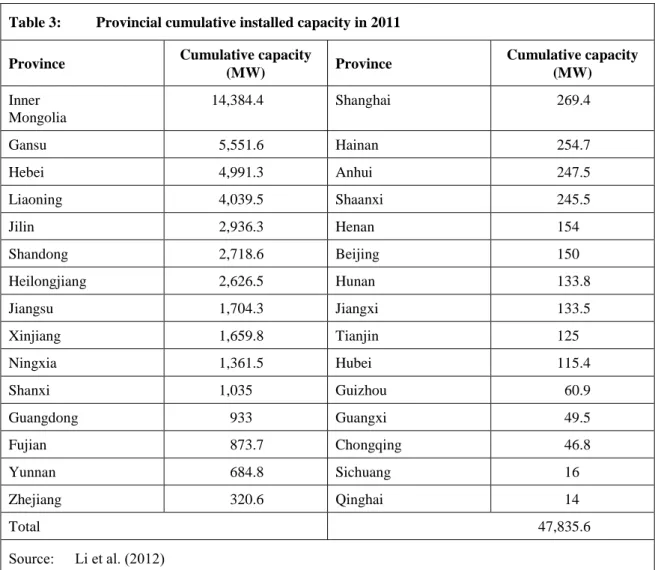
Compared with its onshore wind energy, the development of China’s offshore wind farms was still in its infancy at this stage. By the end of 2011, the national offshore installed capacity was 242.5 MW. The Shanghai Donghai Bridge, Stage I project was the first large-scale commercial offshore wind farm in China, with a designed capacity of 102 MW (Li et al. 2012).
Table 3: Provincial cumulative installed capacity in 2011
Province Cumulative capacity
(MW) Province Cumulative capacity (MW) Inner Mongolia 14,384.4 Shanghai 269.4 Gansu 5,551.6 Hainan 254.7 Hebei 4,991.3 Anhui 247.5 Liaoning 4,039.5 Shaanxi 245.5 Jilin 2,936.3 Henan 154.0 Shandong 2,718.6 Beijing 150.0 Heilongjiang 2,626.5 Hunan 133.8 Jiangsu 1,704.3 Jiangxi 133.5 Xinjiang 1,659.8 Tianjin 125.0 Ningxia 1,361.5 Hubei 115.4 Shanxi 1,035.0 Guizhou 60.9 Guangdong 933.0 Guangxi 49.5 Fujian 873.7 Chongqing 46.8 Yunnan 684.8 Sichuang 16.0 Zhejiang 320.6 Qinghai 14.0 Total 47,835.6 Source: Li et al. (2012)
2.2.3 Booming wind market at a transition point
The development of wind energy in China began with the production of equipment. With a continually enlarging market, the wind energy equipment production sector became very large and prosperous. In 2011, more than 70 wind turbine manufacturers were registered in China, although only 29 of those had actual production. Compared with 43 manufacturers in 2009, the number of manufacturers is decreasing, reflecting more severe market competition and market concentration. The five biggest providers in 2011 were GoldWind (3,600 GW of capacity and 20.4% of the market), Sinovel (2,939 MW and 16.7%), United Power (2,847 MW and 16.1%), Mingyang Wind Power (1,177.5 MW and 6.7%), and Dongfang (946 MW and 5.4%) (Li et al. 2012).
This ranking is far from stable, however, and it would be hard to predict who the future leader in Chinese wind energy manufacturing will be. The increasingly heated competition
The innovation path of the Chinese wind power industry
German Development Institute / Deutsches Institut für Entwicklungspolitik (DIE) 11 in the wind energy market has generated a difficult situation for each producer. Besides Sinovel and GoldWind, United Power, Mingyang Wind Power, XEMC and Shanghai Electric have demonstrated increasing competitiveness through increasing their production capacity or using advances in technology. There are two types of newcomer: one type is represented by United Power, a utility provider that entered the industry to extend its business lines. The year 2011 saw a decrease in installed capacity from Sinovel, GoldWind, Dongfang, Vestas and Gamesa, but also the emergence of other firms. With its considerable growth rate of 73% in 2011, for example, United Power became the most outstanding enterprise in the Chinese market. Building on its background in utilities, United Power made wind turbine sales to its own wind farms and increased its risk management capacity. It began operating a 1.5 MW wind turbine in 2008 and installed 768 MW of wind energy equipment in 2009, making it the fourth biggest wind turbine provider in the Chinese market. United Power maintained its ranking, with 1,643 MW of installation in 2010, moving up to rank third in 2011. Moreover, United Power made considerable progress in R&D for new products. It first produced 3 MW turbines in 2010, and soon launched a 6 MW turbine in November 2011, only 6 months later than Sinovel. Another type of newcomer is represented by XEMC, an engine provider that extended production to wind turbines. Formed in 2006, XEMC maintained stable and strong growth after launching its first 1.65 MW turbine in 2008. It moved into the top 10 with 451 MW of new installed capacity in 2011. Although they had less new installed capacity in 2011, GoldWind and Sinovel retained their positions as the first and second largest manufacturers in the Chinese market. GoldWind, Sinovel, United Power and Mingyang Power rose to be among the top 10 manufacturers in the world (Li et al. 2012).
Figure 6: Market share of top manufacturers in China
Source: Li et al. (2012) 71.00% 65.30% 87.25% 83.18% 94.53% 93.20% 0% 10% 20% 30% 40% 50% 60% 70% 80% 90% 100% 2010 2011 Top 5 Top 10 Top 15
Yixin Dai et al.
12 German Development Institute / Deutsches Institut für Entwicklungspolitik (DIE)
The Chinese wind energy sector is at a transition point, with many uncertainties. Some firms are still gaining a greater share of the market using the advantage of low labour costs, while others are showcasing products with high added value. Some manufacturers have adopted a whole production chain strategy, while others are focusing on a single product. It is still too early to predict who will be the winners on the market. However, describing the main features of the industry’s innovation path and achieving a full understanding of how that path formed would definitely assist policymakers in understanding the industry and making effective policy adjustments for the future.
2.3 The policy framework for wind energy innovation in China
As an emerging industry, the development of wind energy has depended on policy support in many areas. The existing literature indicates that the pattern of both manufacturing and deployment in the Chinese wind energy industry are strongly influenced by the concurrent policy framework (Li et al. 2008). Studies have, however, focused more on explaining the causal effect of development in the Chinese wind energy industry on certain policy contexts. The existing literature commonly adopted the three analytical dimensions of demand, supply, and policy environment. This paper, however, focuses on the path of innovation within the industry, and therefore places more emphasis on the changing trends in technological innovation and the influence of the concurrent policy framework. Policy instruments have included R&D investment, a market pull policy, environmental regulation, development planning, subsidies, and a tax deduction policy.
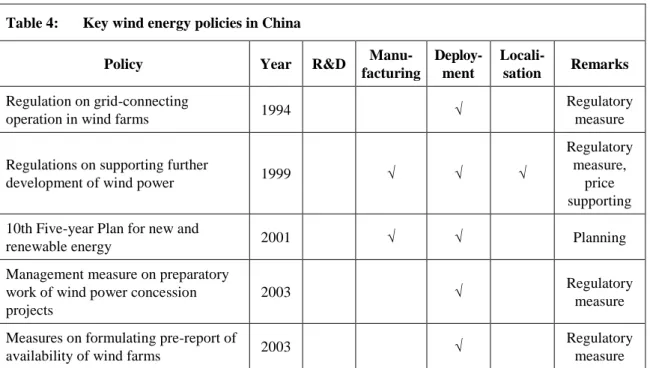
In each interview we asked the question “Which Chinese policy played the biggest role in boosting development of the wind energy industry?” Many policies were mentioned (see Table 4 for a detailed list of relevant policies). Of these, the Renewable Energy Law of 2006 (REL) is of particular importance and was mentioned by almost all of the interviewees. Passed by the National People’s Congress (NPC) in 2005 and revised in 2009, the REL was a milestone in China’s efforts to promote the development of renewable energy in the long term. The REL legislates for the direction of development of renewable energy and also the rights and commitments of participants. According to the REL, all levels of the Chinese government are obliged to set technology benchmarks and to issue technological data that are necessary for the market. Governments are also required to promote the connection of electricity from renewable sources to the state grid. The law permits enterprises and governments to cooperate in terms of franchising, and enterprises have obligations regarding technological development and price control. Electricity from renewable sources is to be subsidised so that it may be connected to the grid at the same price as traditional power. The subsidy comes from renewable energy funding, collected from end users via electricity utility bills. The law also calls for further study into special funds or tax incentives for the development of renewable energy (NPC 2006). The study interviewees all indicated that the REL provides a long-term guarantee for the development of the industry, which greatly influences the behaviour of all stakeholders.
Table 4 lists the other important policies for wind energy after 1994. A clear trend apparent from the policy framework is a shift from industrial policies to R&D and market policies. The basic energy policy, along with national strategy and planning, set up an umbrella framework for all supporting policies. Starting with the REL, various energy policies to stimulate the development of renewable energy have been released by different ministries;
The innovation path of the Chinese wind power industry
German Development Institute / Deutsches Institut für Entwicklungspolitik (DIE) 13 these include the policy Mid-Long Term Development Planning for Renewable Energy (2007), the 11th Five-year Plan for Renewable Energy (2008) and a revision of the REL in 2009. These policies are not necessarily specific to wind energy development, but the national emphasis on renewable energy has set the scene for wind energy to be developed. Market exploration and deployment policies have been the most popular policy tools adopted by the Chinese government for wind energy development. Beginning in 2003, five rounds of concession projects were designed by the National Development and Reform Commission (NDRC) to enlarge the domestic market. Higher market targets were met by concession projects. Supplementary support provided by regulations on grid connection, wind-generated electricity prices and the management of renewable energy funding contributed greatly to the deployment and development of the industry.
China’s R&D policy has particular features relating to the development of wind energy. In accordance with the national plan for the development of science and technology, research into wind energy has been included in the standard national research projects (e. g., the 863 Plan) ever since the 1950s. Until recently, there was no policy or research project designed specifically for wind energy. According to He Dexin, the President of the Chinese Wind Energy Association, more policies are available for technological improvement and indigenous innovation, for example, tax deductions for R&D funds and special research fund support for research into new types of wind turbine and wind blade. He also pointed out that national support for wind energy research is still mainly provided through universities and research institutes, and thus the overall R&D policy cannot be relevant until firms are motivated to join the R&D process as key players.
Last but not least, localisation policies abounded in the 1990s and early 2000s. These were all cancelled in 2009, marking the transition of the Chinese market to full competitiveness. Importantly, some of these policies required specific rates of adoption of domestic equipment in wind farm construction. While any items contravening free-trade principles were cancelled in 2009, the Chinese government continues to support domestic manufacture and indigenous innovation through R&D funding or the setting of technology standards. We have therefore included a column for ‘localisation’ in Table 4 to mark the relevant policies.
Table 4: Key wind energy policies in China
Policy Year R&D
Manu-facturing Deploy-ment Locali-sation Remarks Regulation on grid-connecting
operation in wind farms 1994 √
Regulatory measure
Regulations on supporting further
development of wind power 1999 √ √ √
Regulatory measure,
price supporting 10th Five-year Plan for new and
renewable energy 2001 √ √ Planning
Management measure on preparatory work of wind power concession projects
2003 √ Regulatory
measure
Measures on formulating pre-report of
availability of wind farms 2003 √
Regulatory measure
Yixin Dai et al.
14 German Development Institute / Deutsches Institut für Entwicklungspolitik (DIE)
Table 4 (cont.): Key wind energy policies in China
Policy Year R&D
Manu-facturing
Deploy-ment
Locali-sation Remarks
Technological regulation on selection
of wind farm location 2003 √
Regulatory measure Technological regulation on
measurement and assessment of wind resources
2003 √ Regulatory
measure Technological regulation on detailed
engineering geological investigation of wind farms
2003 √ Regulatory
measure
Measures on formulating investment
estimations of wind farm projects 2003 √
Regulatory measure National technological regulation on
assessment of wind resources 2004 √
Regulatory measure Notification on relevant requirements
for wind power construction management
2005 √ Regulatory
measure Notification on relevant suggestions
for accelerating localisation of wind power construction
2005 √ √ √ Planning &
subsidy
Interim measures on regulation of land and environment protection
management in wind power construction
2005 √ Regulation
Interim measures on special fund management for development of renewable energy
2006 √ Subsidy
11th Five-year Plan for renewable
energy development 2008 √ Planning
Circular of the Ministry of Finance on the adjustment of import tax policies governing the High Wind Power Generator Units and their key parts and raw materials
2008 √ √ Tax rebating
Interim measure on management of special funds for wind power industrialisation
2008 √ √ Subsidy
NDRC notification on improving price policy of grid-connected wind
electricity
2009 √ Price
supporting
NEB interim measure on management
of offshore wind power development 2010 √
Planning & regulation Views on accelerating smooth
develop-ment of wind equipdevelop-ment industry 2010 √ √ √ Planning
Source: Authors checked wind-related policies using the Government Policy and Document Database that is maintained by the School of Public Policy and Management, Tsinghua University.
The innovation path of the Chinese wind power industry
German Development Institute / Deutsches Institut für Entwicklungspolitik (DIE) 15
3 The innovation path for Chinese wind energy development
3.1 The innovation path for core wind energy technology
The factors affecting the innovation path of Chinese wind energy can be divided into three aspects.
3.1.1 Moving from a strategy of ‘preferring lower prices’ to one of ‘preferring higher quality’
International competitors have expressed the strongest feelings about this trend. During the interviews, the director of government relationships at Vestas China stated that the company’s prices were higher than those of domestic companies, which prevented local projects focusing on short-term installation goals from choosing Vestas products. However, Vestas placed emphasis on high energy production and life-cycle efficiency, concepts that have gradually been accepted by Chinese governments. International competitors used to lose projects to lower bids based on cheaper domestic wind energy equipment, although the excellent operational performance and reliability of their turbines has helped international manufacturers to maintain a significant market share in China. Vesta and Gamesa are examples. Wind farm operators have given turbine security and reliability of the control system the highest priorities. Domestic manufacturers have therefore been urged to invest more in core technology R&D to increase the quality of their equipment and maintain market share.
3.1.2 Moving from ‘small turbine’ to ‘large turbine’ technology
Currently, 1.5 MW and 2.5 MW turbines dominate the wind energy deployment market in China. Before 2005, wind turbines with unit capacities of 250 kW, 600 kW and 850 kW were installed. Lacking any large-scale wind farms, various demonstration projects and small commercial wind farms selected different turbine units. Imported wind turbines with capacities above 1 MW were introduced into the Chinese market during the first and second rounds of concession bidding between 2003 and 2004, and were widely adopted in wind farm projects with similar unit capacities. 1.5 MW wind turbines then became the dominant unit capacity; in marked contrast, according to Vestas, to the world market, in which 1.2 MW wind turbines were dominant (Vestas interview). 2 MW wind turbines soon joined the market, becoming very popular and occupying a large share of the market. Up to 2007, wind turbines with unit capacities above 1 MW comprised about 51% of those installed annually and took the average capacity to 1.05 MW. This average rose to 1.47 MW in 2010 and 1.646 MW in 2012 (Navigate Research 2013). More recently, large wind turbines have become available: 2.5 MW, 3 MW or even larger wind turbines have gradually reached the commercialisation stage and entered the market. 3 MW wind turbines were put into mass production and have been successfully installed in a variety of wind farms. Domestic manufacturers were testing pilot 5 MW and 6 MW wind turbines in 2011.
Yixin Dai et al.
16 German Development Institute / Deutsches Institut für Entwicklungspolitik (DIE)
Figure 7: Development trend of the average unit capacity of wind turbines
Source: Li et al. (2012)
3.1.3 Moving from ‘imported technology’ to ‘indigenous technology’
Chinese domestic manufacturers have gradually come to dominate the Chinese domestic market and have begun to gain a favourable international reputation during the process of internationalisation. Table 5 shows that local firms have gained a large share of the domestic market. According to Wyman (2012), four Chinese wind turbine manufacturers were listed among the world’s top 10 producers of wind energy. Sinovel, founded in 2006, was ranked as the world’s second largest wind energy manufacturer in 2011, capturing 11.1% of the total market.4
Table 5: New installed capacity and cumulative capacity (MW) of the Top 15 manufacturers in China*
Enterprise Annual production (2010) Cumulative production (2010) Annual production (2011) Cumulative production (2011) GoldWind 3,735.00 9,078.85 3,600.00 12,678.90 Sinovel 4,386.00 10,038.00 2,939.00 12,977.00 United Power 1,643.00 2,435.00 2,847.00 5,282.00 Guangdong Mingyang 1,050.00 1,945.50 1,177.50 3,123.00
4 Sinovel has experienced a downturn since 2012, falling out of the Top 5 in market share in 2013. In 2012, it was still ranked seventh in the world market.
849.7 919.5 1,052.2 1,217.1 1,362.6 1,466.8 1,545.4 0 200 400 600 800 1,000 1,200 1,400 1,600 1,800 2005 2006 2007 2008 2009 2010 2011 kW
The innovation path of the Chinese wind power industry
German Development Institute / Deutsches Institut für Entwicklungspolitik (DIE) 17
Table 5 (cont.): New installed capacity and cumulative capacity (MW) of the Top 15 manufacturers in China Enterprise Annual production (2010) Cumulative production (2010) Annual production (2011) Cumulative production (2011) Dongfang Electric 2,623.50 5,952.00 946.00 6,898.00 XEMC 507.00 1,089.00 712.50 1,801.50 Shanghai Electric 597.85 1,073.35 708.10 1,781.50 Vestas 892.10 2,903.60 661.90 3,565.50 China Creative Wind Energy 486.00 682.50 625.50 1,308.00 CSR Zhuzhou 334.95 465.30 451.20 916.50 General Wind Power 210.00 1,167.00 408.50 1,575.50 CSIC Haizhuang Windpower 383.15 479.25 396.00 875.30 Zhengjiang Windey 129.00 723.00 375.00 1,098.00 Gomasa 595.55 2,424.30 361.60 2,785.90 Envision 250.50 400.50 348.00 748.50 Total 17,823.60 40,857.15 16,557.80 57,415.10
* Companies are ranked according to annual production in 2011. Source: Li et al. (2012).
3.2 The innovation path for wind energy deployment
China experienced two major shifts in the development of the innovation path for wind energy deployment.
3.2.1 The shift from a centralised deployment pattern to a de-centralised pattern
The pattern of deployment involved ‘large-scale deployment strategy’ and ‘diverse wind deployment strategy’ stages.
Rich wind resources are located in Northern China, Northeastern China and Northwestern China. However, these areas are sparsely populated with underdeveloped local economies, and have low levels of electricity consumption. The industrialised areas, such as those in the east and southeastern parts of China, are distant from wind-rich areas. The initial wind demonstration projects were mainly located in Xinjiang, Hebei and Inner Mongolia; when China increased the pace of development of wind energy technology in the late 1990s, the economic advantages provided by low land costs and rich wind resources in these areas
Yixin Dai et al.
18 German Development Institute / Deutsches Institut für Entwicklungspolitik (DIE)
drove the adoption of a large-scale, concentrated, mono-operator and long-distance transmission model for wind energy deployment.
From 2008, based on national investigation into wind energy resources and distribution, China scheduled the building of seven wind energy bases in Gansu, Xinjiang, Hebei, Western Inner Mongolia, Eastern Inner Mongolia, Jilin, Jiangsu and Heilongjiang.5 By the end of 2011, construction had begun on the seven bases: Gansu Jiuquan 10 GW base Stage I, Inner Mongolia Tongliao Kailu 10 GW Base, Bayanur Urat Middle Banner Base, Baotou Darhan-Muminggan Base, Hebei-Zhangbei Base Stages I and II, Hebei Chengde Base and Xinjiang Kumul Base. Another six wind energy bases received construction approval and entered into the early preparation stages.
However, large-scale deployment raised the problems of grid-connection and long-distance transmission. As China was among the first adopters of large-scale wind energy deployment globally, it encountered many technological obstacles. For example, grid connection was a major issue. Key technological questions included the following: How could the grid control system be improved to eliminate the turbulence generated by wind power? How could efficiency in long-distance electricity transmission be ensured? Should an ultra-high voltage (UHV) transmission line be built? Should the grid be upgraded as a whole to a smart grid? Without suitable technical solutions to these questions, the electricity generated in the large wind bases would be subject to severe generation overabundance. According to statistics from the State Electricity Regulatory Commission (SERC), in the first six months of 2010 Inner Mongolia curtailed the most electricity, equivalent to 75.68% of the total wind energy that could be generated in that area (Li et al. 2012).
While engaging in R&D for large-scale wind energy deployment, China also began to develop widely distributed, smaller-scale wind farms, especially in the south-western part of the country. There were two advantages: First, while these areas had slower wind speeds, they also had high population densities and developed economies, and the electricity generated from the small wind farms was therefore close to the end users and could readily be accepted by the grid. Second, due to the progress in turbine technology, low-speed wind turbines were close to being commercialised and therefore there were no technical obstacles to developing a distributed deployment model (NDRC 2012).
3.2.2 The shift from a partial production chain to a whole production chain strategy
Wind farm operators have gradually engaged in the manufacture of wind energy equipment. Globally, wind farm development, wind farm operation and wind energy equipment manufacture are typically carried out by different firms that specialise in these different areas and together form a competitive market. In China, the situation is different. Although the electricity market is undergoing a process of market reform, it is still monopolised by large state-owned enterprises that naturally became the main operators of wind farms. Following the rush into wind farm construction after 2009, private investors have gradually entered the scene and have gained a small market share. Currently, wind
5 Then, the NDRC extended the 10 GW wind base name list to 9 in the 12th Five-year planning for wind energy development in 2012.
The innovation path of the Chinese wind power industry
German Development Institute / Deutsches Institut für Entwicklungspolitik (DIE) 19 farm projects are being operated or constructed by more than 60 enterprises, most of which are central state-owned enterprises.
Wind farm operators in China can be categorised into four groups: central state-owned enterprises, local state-owned enterprises, private or foreign enterprises, and wind energy manufacturers who have extended their value chains to wind farm operation. Table 6 lists the major wind farm operators in each of these categories.
Table 6: Four types of wind farm operator in China
Type of wind farm operator Key operators
Central state-owned enterprises Guodian Longyuan, China Datang, China Huaneng, China Huadian, China Power Investment, Guangdong Nuclear Power, National Offshore Oil, CECEP, Shenhua (Guohua), Three Gorges Corporation, China Resources, State Grid, Sinohydro, and HydroChina
Local state-owned enterprises Beijing Jingneng, Tianjin Jinneng, Shanghai Shennneg, Shandong Luneng, Guangdong Yudean, Ningxia Electric Power, Hebei Construction & Investment (Suntien Green Energy), Fujian Energy, and Fujian Investment & Development
Private or foreign enterprises Heilongjiang Zhongyu, China Wind Power, Golden Concord, Shanxi Yunguang Wind Power, Wuhan Kaidi, Daoda Marine Heavy Industry, HKC New Energy, Honiton Energy, and UPC Wind energy manufacturers GoldWind, Gomesa, Zhejiang Huayi (HEAG), Tianwei Group,
Shandong Changxing, Universal Wind Energy, and XEMC
Sources: Data collected from various different reports from the Chinese Wind Energy Association (2010; 2011; 2013)
Similar to the Chinese wind turbine market, the market for wind farm operation has also experienced dramatic changes. There are two main trends: First, state-owned enterprises are more likely to operate large-scale wind farms. In 2011, the top 10 wind farm operators installed a total capacity of 13.43 GW. Although this was 660 MW less than that installed in 2010, these top 10 enterprises held 1.8% more of the total new installed capacity than the previous year. A similar centralisation occurred with the top operators. For example, despite an average decrease in new installed capacity in 2011, the Guodian Group, which includes Longyuan and Guodian Electric, had 370 MW more installed capacity than the previous year, maintaining its position as the largest wind farm operator in the country. Almost no private sector enterprises have entered into competition in this area due to the high investment costs.
Second, a market for smaller-scale distributed wind farms with no dominant enterprises is emerging. In many of the areas with lower-quality wind resources there is motivation to develop low-speed wind farms. Similar to wind farms in Germany and Denmark, many of these projects are of a smaller scale with distributed features, and are closer to end consumers. Through such projects, China’s wind energy industry would potentially open up to private investment or foreign enterprises.
Yixin Dai et al.
20 German Development Institute / Deutsches Institut für Entwicklungspolitik (DIE)
Table 7: Top 10 wind farm enterprises with the largest new installed capacity in 2011
Wind farm operator Capacity (MW) Market share (%)
Guodian Group 3,860.5 21.9
Datang Group 2,235.1 12.7
Huaneng Group 2,229.0 12.6
Huadiang Group 1,104.0 6.3
Guohua 1,094.5 6.2
China Power Investment 866.3 4.9
China Resources 796.1 4.5
Guangdong Nuclear Power 527.0 3.0
Beijing Jingneng 372.0 2.1
Suntien 343.6 1.9
Others 4,202.9 23.9
Total 17,630.9 100.0
Sources: Li et al. (2012)
Table 8: Top wind farm enterprises with the largest grid-connection capacity in 2011
Wind farm operator Capacity (MW)
Guodian Group 9,812.9
Datang Group 6,581.0
Huaneng Group 5,743.0
Huadiang Group 2,353.0
Guohua 2,837.1
China Power Investment 2,200.6
China Resources 2,124.0
Guangdong Nuclear Power 1,382.8
Beijing Jingneng 1,340.3
Others 13,460.4
Total 47,835.6