Bank Size, Information Sharing and
Financial Access in Africa
Nwachukwu, J & Asongu, S
Author post-print (accepted) deposited by Coventry University’s Repository Original citation & hyperlink:
Nwachukwu, J & Asongu, S 2018, 'Bank Size, Information Sharing and Financial Access in Africa' International Journal of Managerial Finance, vol (in press), pp. (in press).
https://dx.doi.org/10.1108/IJMF-08-2017-0179 DOI 10.1108/IJMF-08-2017-0179
ISSN 1743-9132
Publisher: Emerald
Copyright © and Moral Rights are retained by the author(s) and/ or other copyright owners. A copy can be downloaded for personal non-commercial research or study, without prior permission or charge. This item cannot be reproduced or quoted extensively from without first obtaining permission in writing from the copyright holder(s). The content must not be changed in any way or sold commercially in any format or medium without the formal permission of the copyright holders.
This document is the author’s post-print version, incorporating any revisions agreed during the peer-review process. Some differences between the published version and this version may remain and you are advised to consult the published version if you wish to cite from it.
1
Bank Size, Information Sharing and Financial Access in Africa
Forthcoming: International Journal of Managerial Finance
Simplice A. Asongu
African Governance and Development Institute, P.O. Box 8413 Yaoundé, Cameroon. E-mails: asongusimplice@yahoo.com /
asongus@afridev.org
Jacinta C. Nwachukwu
School of Economics, Finance and Accounting, Faculty of Business and Law,
Coventry University Priory Street, Coventry, CV1 5FB, UK
2
Bank Size, Information Sharing and Financial Access in Africa
Simplice A. Asongu & Jacinta C. Nwachukwu
Abstract
Purpose - This study investigates how bank size affects the role of information asymmetry on
financial access in a panel of 162 banks in 39 African countries for the period 2001-2011.
Design/methodology/approach - The empirical evidence is based on instrumental variable
Fixed Effects regressions with overlapping and non-overlapping bank size thresholds to control for the QLH (Quiet Life Hypothesis). The QLH postulates that managers of large banks will use their privileges for private gains at the expense of making financial services more accessible to the general public. Financial access is measured with loan price and loan quantity whereas information asymmetry is implicit in the activities of public credit registries and private credit bureaus.
Findings - The findings with non-overlapping thresholds are broadly consistent with those that
are conditional on overlapping thresholds. First, public credit registries have a decreasing effect on the price of loans with the magnitude of reduction comparable across all bank size thresholds.
Second, both public credit registries and private credit bureaus enhance the quantity of loans.
Third, compared with public credit registries, private credit bureaus have a greater influence in increasing financial access because they have a significantly higher favourable effect on the quantity and price of loans Fourth, the QLH is not apparent because large banks are not associated with lower levels of financial access compared to small banks.
Originality/value - Studies of public credit registries and private credit bureaus in Africa are
sparse. This is one of the few to assess linkages between bank size, information asymmetry and financial access.
JEL Classification: G20; G29; L96; O40; O55
3
1. Introduction
Basic financial access in the form of deposit, credit, payment or insurance to individuals and corporations has been constrained in Africa by several factors, inter alia: physical access, affordability and eligibility (Batuo & Kupukile, 2010; Nyasha & Odhiambo, 2015a, 2015b; Fanta, 2016; Makina, 2017; Chikalipah, 2017). According to this narrative, major challenges confronting efforts at curbing the problem are issues of moral hazard and adverse selection driven by information asymmetry between lenders and borrowers. Policy measures have culminated in the establishment of credit monitoring offices, notably public credit registries and private credit bureaus. These have been essentially motivated by the need to increase information sharing between financial institutions and their customers in order to mitigate the underlying issue of information asymmetry.
A substantial bulk of theoretical research is consistent with the position that asymmetric information between borrowers and lenders may stifle the efficient allocation of capital (Tchamyou & Asongu, 2017a, b;Triki & Gajigo, 2014). Accordingly, lenders often face adverse selection problems because they are confronted with the inability to observe borrowers’ characteristics, especially the riskiness of their investment projects. Moreover, the issue may be compounded by a further inability of lenders to control borrowers’ actions when credit is granted. In essence, a borrower could conceal the proceeds of his/her investment to prevent debt repayment or diminish his/her alert to the possibility of default. Such scenarios are not particular of insolvent borrowers because even solvent borrowers could be tempted to avoid compliance with their financial obligations if the lender is unable to monitor the activities for which a loan is granted. The unavoidable consequence from lenders may be the charging of higher interest rates and rationing of credit. Information sharing between lenders can augment borrowers’ motivations to repay and foster credit activity. The role of public credit registries and private credit bureaus as information brokers have favourable effects including, among others enabling the efficient allocation of capital, increasing competition in the credit market and relaxing credit constraints (Jappelli & Pagano, 2002).
In the light of the above, much scholarly attention in the banking literature has recently been focused on examining the role of information sharing among creditors and the impacts of stronger creditor rights to information access. The latter strand has investigated the role of
4
stronger creditor rights in, inter alia: bankruptcy (Claessens & Klapper, 2005; Djankov et al., 2007; Brockman & Unlu, 2009) and bank risk-taking (Houston et al., 2010; Acharya et al., 2011). The former strand has assessed how information sharing could: improve credit availability (Djankov et al., 2007; Brown et al., 2009; Triki & Gajigo, 2014), reduce the cost of credit (Brown et al., 2009), mitigate default rates (Jappelli & Pagano, 2002), influence corrupt-lending (Barth et al., 2009), weigh on antitrust intervention (Coccorese, 2012) and affect syndicated bank loans (Ivashina, 2009; Tanjung et al., 2010).
Noticeably in the above literature, the orientation towards regions where issues of access to finance are most apparent is sparse. Accordingly, while a substantial bulk of the literature has targeted the developed countries and the emerging economies of Latin America and Asia, little is known about the African continent which unfortunately is the region with the lowest level of financial development (Triki & Gajigo, 2014; Bongomin et al., 2016; Charles & Mori, 2016; Wale & Makina, 2017; Bocher et al., 2017)1. In addition, as far as we have reviewed, the literature leaves room for improvement with a significant number of gaps, namely: (i) in endogeneity concerns; (ii) the implicit distinction between the price and quantity effects of information asymmetry and (iii) the incidence of bank size (with associated market power) on the impact of information sharing. First, a plethora of studies in empirical literature have consistently failed to account for endogeneity, which could lead to biased estimates and misplaced policy implications2. In principle, adverse selection and moral hazard issues cannot be properly examined without an exogenous instrument (Ivashina, 2009, p. 301). Second, contrary to recent literature on information asymmetry (Ivashina, 2009; Tanjung et al., 2010) and information sharing (Galindo & Miller, 2001; Houston et al., 2010; Triki & Gajigo, 2014), a clear distinction between the price and quantity effects of information sharing is essential for more calibrated policy implications. This is primarily because a fundamental objective of reducing (increasing) information asymmetry (information sharing) is to improve banking intermediation efficiency to (i) increase loans to borrowers at (ii) affordable prices. Third, the
1
Consistent with Triki and Gajigo (2014) (which have focused on 42 African countries), Galindo and Miller (2001), Love and Mylenko (2003) and Barth et al. (2009) have positioned their studies on zero, four and nine African countries respectively. The scope of our study is 42 African countries.
2 Inter alia: Ordinary Least Squares (Jappelli & Pagano, 2002, pp. 2033-38) and controlling for the unobserved
heterogeneity among countries (Triki & Gajigo, 2014) do not go far enough in addressing the inherent simultaneous effects between public credit registries (Private credit bureaus ) and the banking industry.
5
role of bank size in the incidence of information sharing is relevant in order to control for the potential abuse of market power by managers as proposed by the quiet life hypothesis (QLH)3. Banking competition is reputed to consolidate the favourable impact of information sharing on lending in the event that credit markets can be contested, the sharing of information improves competition and it mitigates informational rents which could result in greater lending (Pagano & Jappelli, 1993, p. 2019).
This paper attempts to fill the above gaps in the following ways. First, by controlling for endogeneity, we employ an instrumental variable empirical strategy for our independent variables of particular interest (i.e., public credit registries and private credit bureaus). Second, we individually account for price and quantity effects for more policy implications/options.
Third, the empirical strategy adopts both overlapping and non-overlapping bank size thresholds to control a possibility for the QLH in the underlying relationships. Assessing this potential for the QLH is consistent with the problem statement that aims to examine if bank managers are abusing privileges from information sharing with public credit registries and private credit bureaus. The intuition motivating this empirical exercise is that blanket policies may not be effective unless they are contingent on bank size (with related market power) and tailored differently across markets with varying portfolios of bank size.
In the light of the above, the key research question which we seek to answer in this paper is the following: does bank size affect the impact of information sharing on financial access in terms of quantity and prices of loans?
The remainder of the paper proceeds as follows. Section 2 reviews the literature and focuses on conceptual clarifications. These comprise linkages between loan price, loan quantity and information asymmetry on the one hand and measurements of loan price, loan quantity and information asymmetry on the other. The methodology and data are discussed in Section 3. Section 4 reports and discusses the key results from the empirical analysis. Section 5 concludes with future research directions.
3 According to the QLH, firms with higher market power invest less in pursuing intermediation efficiency: instead of
taking advantage of their favourable position by granting more loans to borrowers at affordable prices, they prefer to enjoy a “quiet life” or an exploitation of market power to achieve their personal goals (Coccorese & Pellecchia, 2010).
6
2. Literature review and conceptual clarifications 2.1 Literature review
While there is a bulk of studies on the connection between information asymmetry and financial access, the extant literature that has focused on Africa is rare. This is probably because private credit bureaus and public credit registries were only introduced in Africa in 2004, for the most part (see Tchamyou & Asongu, 2017a). Hence, owing to concerns in degrees of freedom, the new data has not been exploited until recently. Discussion in this section is structured in two main strands. They are: (i) the broad non-contemporary literature that largely fails to incorporate African countries and (ii) the contemporary African finance literature.
In the first strand, Galindo and Miller (2001) have established that in nations where credit registries are in an advanced stage of development, restrictions to financial access are less apparent. Conversely, countries in which credit registries are in their infancy (or not yet introduced) experience more restrictions to financial access. Moreover, the authors have further posited that well-performing credit registries account for a considerable reduction in the sensitivity of firms to investment decisions. Love and Mylenko (2003) have combined firm-level information from the World Bank Business Environment (WBES) with data on information sharing offices (public credit registries and private credit bureaus) to investigate whether or not better information sharing on credit history from banks affect financing constraints favourably within the framework of managers. The results have shown that when private credit registries are apparent, there are lower financing constraints and better access to financial services. By contrast, public registries do not have a noticeable effect in reducing financing restrictions. Using the WEBS covering 4,000 corporations in 56 countries and private credit offices in 129 nations, Barth et al. (2009) examined the effect of “borrower and lender competition” and information sharing on corrupt-lending. Two principal results are established. On the one hand, competition within the banking industry and information sharing reduce corruption associated with lending. On the other, corrupt-lending is also strongly affected by the following features: ownership structure of banks, competition within firms and the legal environment.
Before we delve into the second aspect that is concerned with studies focused on Africa, it is worthwhile articulating the scant non-contemporary literature on the continent with some
7
critical insights into the literature engaged in the first strand4. Galindo and Miller (2001) considered no African country. Love and Mylenko (2003) and Bath et al. (2009) respectively included four and nine countries on the continent. Triki and Gajigo (2014), focusing exclusively on Africa, have investigated a sample of 42 countries for the period 2006-2009. The authors were motivated by two main concerns: (i) the effect of information sharing offices on firms’ access to finance and (ii) the relevance of the design of public credit registries in the severity of constraints on finance. They concluded that (i) private credit bureaus more positively affect financial access when compared with public credit registries or environments where no information sharing office is apparent and (ii) considerable heterogeneity exists in the design of information sharing offices and financial access across countries with public credit registries. Asongu et al. (2016) investigated the role of information sharing in financial access to establish that for the most part, information sharing offices are not playing their theoretical role of reducing information asymmetry for financial access. Asongu et al. (2017) investigated the role of information sharing offices in reducing market power for financial access so as to confirm that in order for information sharing to reduce market power in view of enhancing financial access, private credit bureaus should be between 1.4 percent and 18.4 percent coverage while public credit registries should be between 3.16 percent and 3.3 percent exposure. Asongu and Nwachukwu (2017) incorporated financial sectors into the analysis to conclude that the positive complementarity of information sharing offices and financial formalization is an increasing function of financial credit access while the negative complementarity of information sharing offices and financial informalization is a decreasing function of credit access. Mauza and Alagidede (2017) re-examined the law-finance theory in the light of the investigated relationship to establish that, compared to French civil law countries, English common law countries are benefiting more in financial access owing to information sharing by means of credit registries.
4 Accordingly, in spite of the substantially documented concerns of surplus liquidity (Saxegaard, 2006; Fouda, 2009;
Asongu, 2014) and recurrent issues of access to finance in the African business literature (Alagidede, 2008; Bartels et al., 2009; Tuomi, 2011; Kolstad & Wiig, 2011; Darley, 2012), the recent literature on financial access in Africa has failed to substantially incorporate the dimension of information sharing by means of private credit bureaus and public credit registries (Fowowe, 2014: Asongu, 2014, 2016; Daniel, 2017; Osah & Kyobe, 2017; Oben & Sakyi, 2017; Iyke & Odhiambo, 2017).
8
2.2 Theoretical underpinnings
This section has two main motives. First, we discuss the theoretical underpinnings on the relationships between information asymmetry, loan price and loan quantity. Second, we use the theoretical foundations to justify our third contribution to the literature discussed in the introductory section.
On the first strand, consistent with Jappelli and Pagano (2002), three potential (or theoretical) effects result from reducing information asymmetry or exchanging of information about borrowers by lenders. (i) The information sharing offices (ISO)5 enable more precise prediction of the probability of repayment by improving banks’ awareness of borrowers’ characteristics. This mitigates adverse selection issues as it allows lenders to better target and price loans. (ii) ISO stifle informational rents that otherwise could have been extracted by banks from their customers. This obliges lenders to be more competitive within the credit market in the pricing of loans, which lowers interest rates, improves borrowers’ margin and hence the incentives to repay. (iii) ISO could also act as a disciplinary device for borrowers: a mechanism which mitigates moral hazard by improving borrowers’ incentives to perform. Accordingly, all borrowers are conscious of the fact that, a default will limit their access to the credit market or make credit more expensive for them because their reputation with other banks would have been tarnished. While the first effect arises from adverse selection, the two other impacts result from moral hazard.
The initial effect of reducing information asymmetry draws from the pure adverse selection model developed by Pagano and Jappelli (1993) which suggests that information sharing mitigates “average interest rates”, increases the number of borrowers and drives-down defaults. Accordingly, banks have information on the credit worthiness of local residents but not on immigrants, which gives rise to adverse selection. The exchange of private information about residents by banks can mitigate default rates and lead to safe lending to immigrants, but the overall incidence on lending remains ambiguous for an obvious reason: the reduction in lending to risky borrowers may be higher (or lower) than the implied increase in lending to safe borrowers.
5
ISO will be subsequently used to represent both public credit registries and private credit bureaus. For elements of style, ISO can also be used interchangeably with public credit registries and private credit bureaus.
9
The other effects from moral hazard reveal the evidence that information sharing consolidates borrowers’ incentives not to default, either through mitigation of banks’ rents (second effect) or via discipline (third effect). For the second impact, the exchange of information between banks drives-down the informational rents that banks can extract within lending relationships from borrowers (Jappelli & Pagano, 2002). To present this effect in more detail, Padilla and Pagano (1997) used a two-period model in which banks have private information about their clients. The informational endowment gives banks some market power over their customers and hence, leads to a hold-up issue: borrowers could have low motivation to perform, which may further lead to high interest and default rates and a potential crumble of the credit market because banks are expected to demand high rates in the future. Hence, banks limit their potential ability to reap informational rents by committing to sharing information on clients’ characteristics. This mitigates the default probability of clients and the interest rate charged on them which ultimately increase the quantity of loans in comparison to a regime in which information is not shared.
With regards to the third effect, even in the absence of a hold-up issue, the impact on incentives still exists. This occurs when banks exchange data on past defaults beyond sharing information on borrower type, which eventually creates a disciplinary effect (Padilla & Pagano, 2000). Within this framework, the sharing of default information comes with a penalty of higher interest rate because default is viewed as a sign of bad quality by outside banks. In order to assuage this penalty, more effort is exerted by entrepreneurs, leading to more lending and lower interest and default rates. On the contrary, information exchange can also reduce lending because banks lose all potential informational rents and hence, their willingness to lend is motivated only by a higher repayment probability.
The second strand justifying our third contribution to the literature draws from a common denominator to all three models: they are consistent on the prediction that, while sharing information mitigates default rates, the incidence on lending is ambiguous. Hence, the effect of reducing information asymmetry on financial access remains open to debate.
10
2.3 Conceptual clarifications
This section is discussed in two main parts. The first clarifies the concepts of loan and loan quantity. The second informs on the theory of information asymmetry. With regard to the first strand, loan price can be measured in various ways. First, in a lending syndicate, it is appreciated by a loan spread which is the difference between the average price charged by the participant banks and the interest offered by the lead bank (Ivashina, 2009, Tanjung et al., 2010). Second, it could also be measured as the price charged on the quantity of loans which is represented as the ratio of “Gross interest and dividend income” plus “Total non-interest operation income” to of “Total assets” (Coccorese & Pellecchia, 2010). Third, in pricing corporate and small business loans, most methods are based on discounting future cash flows (Benzschawel et al., 2012)
As far as we have uncovered, the measurement of loan quantity is straight forward: the amount of personal, small business and corporate loans (Jappelli & Pagano, 2002) which may be presented in natural logarithm or as a percentage of of total assets (Coccorese & Pellecchia, 2010) to achieve comparability with other variables. In cases of disequilibrium when the bank faces excess or limited demand in the loan market, the optimal quantity of loans can be influenced by a number of factors, among others tightening or relaxing restrictions by loan quality and limiting or increasing the number of loans of a given quality (Elosegui & Villamil, 2002).
As far as the second part is concerned, an extensive literature has analyzed the issue of measuring information asymmetry in terms of bank value and therefore corresponding payoffs in loan price and quantity. The appreciation of adverse selection and moral hazard already outlined above can be done in a multitude of ways, inter alia: index construction ownership and ISO.
First, index construction is largely used in financial markets where the presence of better informed traders may affect price formation (Bharath et al., 2009, p. 3215). Since it is logical to ascertain that market players (e.g., analysts, employees, traders and suppliers) which are closer to a firm and its business are those that make informed trading decisions about it, market microstructure analysts have attempted to estimate the degree to which information asymmetry about a particular corporation is observable from market data (transaction prices, quotes, trades, bid-ask spreads…etc). These underpinnings have been extended to other areas of finance in order
11
to help researchers identify firms’ information environment which is presently an intrinsically elusive concept (Bharath et al., 2009).
Second, the theoretical literature maintains that “ownership” should be an important channel for reducing information asymmetry (Ivashina, 2009, p. 300). In this light, a higher quality of the underlying project would induce an increase in the informed party’s share of ownership in order to mitigate the cost of asymmetric information. In a lending syndicate between the lead bank and participants, a special case of asymmetric information is offered by the syndicated loan market. According to the theoretical predictions, the lead bank’s share in the ownership of a loan reduces the overall loan spread because information asymmetry is moderated between the lead and participants (Ivashina, 2009). Hence asymmetric information in a loan is observable from the loan spread (Tanjung et al., 2010, p. 2). The lead is confronted with adverse selection before syndication and moral hazard after syndication if its share is low. This is essentially because it collects and processes borrower information by acting as an agent in the lending syndication.
Third, ISO also lessens information asymmetry by collecting and sharing information on borrower characteristics. While the theoretical foundations of adverse selection and moral hazard have already been covered above, we elucidate why it is important to distinguish between public credit registries and private credit bureaus in the measurement of the phenomenon. Consistent with Triki and Gajigo (2014), there are six main distinguishing features between public credit registries and private credit bureaus: purpose, coverage, ownership, status, data sources used and access. First, whereas public credit registries are public institutions that are created with the principal mission of supervising the banking sector, private credit bureaus are created because of the need (demand) of (for) reliable credit information on borrowers in the market. Hence, information from public credit registries from which lenders assess the credit-worthiness of clients could also be considered as a collateral benefit or by-product of public credit registries.
Second, while the coverage provided by public credit registries is mainly of large corporations and limited in terms of history and type of data provided, private credit bureaus extend beyond large corporations (to small and medium size enterprises (SMEs)), with a longer history and richer data. Third, on ownership, public credit registries belong to governments or central banks. On the other hand, the ownership of private credit bureaus extends beyond governments (or
12
central banks) to lenders, lenders’ associations and independent third parties. Fourth, public credit registries (private credit bureaus) are not (mainly) for profit. Fifth, data used by public credit registries is sourced from bank and non-bank financial institutions while private credit bureaus add public credit registries, tax authorities, courts and utilities to the sources used by public credit registries, for information. Sixth, access to public credit registries (private credit bureaus) is restricted to information providers (open to all types of lenders).
3. Methodology and Data 3.1 Methodology
As highlighted in the introduction, accounting for endogeneity is crucial for the soundness of our empirical strategy. This is essentially because, while the banking industry depends on ISO for borrower information, ISO also depend on borrower solvency history from the banking industry in providing recommendations. In a nutshell, the very concept of “information sharing” (in the mitigation of information asymmetry) by definition entails reverse causality (Ivashina, 2009, p. 301). Hence, ISO are also endogenous and the adverse selection/moral hazard effect cannot be identified without an exogenous instrument. To control for the potential endogeneity between ISO and banks activities, we instrument ISO metrics with their first lags and control for the unobserved heterogeneity in bank size, capital openness, “compliance with Sharia code of conduct for financial services providers” and ownership characteristics. Further robustness checks are ensured using: (i) overlapping and non-overlapping bank size thresholds (ii) alternative specifications to account for perfect substitution (or correlation) of information in the control for the unobserved heterogeneity and (iii) robust Heteroscedasticity and Autocorrelation Consistent (HAC) standard errors.
This estimation approach can be summarized in the following equations. First-stage regression: it it Instruments PCB PCR/ 0 1( ) jXit it (1) Second-stage regression:
13 it it it PCR PCB Q P/ 0 1( ) 2( ) jXit it (2)
In Eqs. (1) and (2), X is a vector of control variables which include: bank characteristics (Deposits/Assets, Bank branches), market features (GDP per capita growth, inflation and
population density) and the unobserved heterogeneity ( bank size, capital restrictions, ownership
and “compliance with Sharia finance code”). PCR (PCB) represent public credit registries (private credit bureaus) while P(Q) denote the price (quantity) of loans. The instruments are first lags. For Eq. (1) and Eq. (2), it and it respectively represent the error terms. Qi,t is the proxy
for the quantity of loans in bank i at period t. In the two equations, the dependent variables (PCR, PCB, P and Q) are separately regressed on the disclosed independent and control variables.
In the first-stage, we regress the PCR/PCB on their first lags conditional on other covariates (control variables) and use the corresponding fitted (or instrumented) values in the principal (or second-stage) regressions. Accordingly, we verify that the instruments are exogenous to the endogenous components of the PCR/PCB, which is a prime condition for the instrumental variable (IV) approach.
3.2 Data
We examine a panel of 162 banks with annual data from Bankscope, World Development Indicators, and Chinn and Ito (2002, 2013) for the period 2001 to 20116. Limitations to the sample of 39 countries, number of banks and periodicity are due to constraints in data availability at the time of the study. The definitions and sources of variables are provided in Table 1. The dependent variables proxying for “loan quantity” and “loan price” are respectively, the “natural logarithm of loans” and “price charged on loans” (Coccorese & Pellecchia, 2010).
6 The 39 sampled countries which are based on data availability constraints at the time of the study are: Algeria;
Angola; Benin; Burkina Faso; Botswana; Burundi; Cameroon; Cape Verde; Central African Republic; Côte d’Ivoire; Equatorial Guinea; Eritrea; Ethiopia; Gabon; Ghana; Kenya; Lesotho; Madagascar; Malawi; Mali; Mauritania; Mauritius; Morocco; Mozambique; Namibia; Niger; Nigeria; Rwanda; Senegal; Seychelles; Sierra Leone; South Africa; Sudan; Swaziland; Tanzania; Togo; Tunisia; Uganda and Zambia.
14
Table 1: Definitions and sources of variables
Variables Signs Variables’ Definitions Sources
Quantity Qty Logarithm of Loans BankScope
Price (charged on Loans or Quantity)
Price (Gross Interest and Dividend income +Total
Non-Interest Operating Income)/Total Assets
BankScope
Public credit registries PCR Public credit registry coverage (% of adults) WDI (World Bank)
Private credit bureaus PCB Private credit bureaus coverage (% of adults) WDI (World Bank)
GDP per capita GDP GDP per capita growth (annual %) WDI (World Bank)
Inflation Infl. Consumer Price Index (annual %) WDI (World Bank)
Populaton density Pop. People per square kilometers of land area WDI (World Bank)
Deposits/Assets D/A Deposits on Total Assets BankScope
Bank Branches Bbrchs Number of Bank Branches (Commercial bank
branches per 100 000 adults)
BankScope
Small Banks Ssize Ratio of Bank Assets to Total Assets (Assets
in all Banks for a given period) ≤ 0.50
Authors’ calculation
and BankScope
Large Banks Lsize Ratio of Bank Assets to Total Assets (Assets
in all Banks for a given period)>0.50
Authors’ calculation
and BankScope
Openness Open Positive de juré capital openness
(KAOPEN>0)
Chinn & Ito (2002, 2013)
Closedness Close Negative de juré capital openness
(KAOPEN≤0)
Chinn & Ito (2002, 2013)
Domestic/Foreign banks
Dom/Foreign Domestic/Foreign banks based on qualitative
information: creation date, headquarters, government/private ownership, % of foreign
ownership, year of foreign/domestic
ownership…etc
Authors’ qualitative
content analysis.
Islamic/Non-Islamic Islam/NonIsl. Islamic/Non-Islamic banks based on financial
statement characteristics (trading in derivatives and interest on loan payments…etc)
Authors’ qualitative
content analysis; Beck
et al. (2010); Ali
(2012).
WDI: World Development Indicators. GDP: Gross Domestic Product. The following are dummy variables: Ssize, Lsize, Open, Close, Dom/Foreign and Islam/NonIsl. KAOPEN takes higher values for more open financial regimes and is the first principal component of four binary variables in the IMF’s Annual Report on Exchange Arrangements and Exchange Restrictions (AREAER).
The study controls for bank-focused features (Deposits/Assets, Bank branches), market-level characteristics (GDP per capita growth, inflation and population density) and the unobserved heterogeneity in bank size (small vs. large), capital restrictions (de juré openness vs. closure), ownership (domestic vs. foreign) and “compliance with Sharia finance” (Islamic vs.
non-Islamic).
First, the following are worth noting for bank-level characteristics. (i) We expect the
15
deposits are the principal financing source of banks. Accordingly, a higher fraction of deposits among liabilities could increase loan quantity (and interest margins) since it requires good organization for mobilization and management. (ii) From intuition, the number of bank branches
should have a negative (positive) effect on the price (quantity) of loans because of the competition-effect, which drives-down prices while increasing quantity.
Second, on market-oriented features we also note the following. (i) GDP per capita growth that has been included to account for business cycle fluctuations is naturally expected to have a positive effect on loan quantity with an ambiguous sign on loan price, which is contingent on market dynamism and expansion. However, depleting GDP per capita could negatively affect loan quantity and loan price because of low demand. Hence, we expect negative signs because during the past decade, GDP per capita in most African countries has dwindled: population has increased at a faster rate than GDP growth (Asongu, 2013). (ii) The coefficient for population density is expected to bear a positive sign both for the quantity and price of loans. Thus, a greater demand for bank loans owing to high population density should drive-up loan prices. (iii) Inflation should decrease (increase) the quantity (price) of loans. This is essentially because there is less investment (or loan quantity) in times of economic uncertainty (or inflation) and the price of loans naturally increases with inflation uncertainty.
Third, it is difficult to establish a priori the expected signs for all the fixed effects. For example, bank size (small vs. big), could engender both negative and positive effects on loan dynamics depending on organization and co-ordination issues associated with bigger banks. Dealing with more bank branches (linked to larger bank size) could also generate inefficiencies owing to the problems encountered in fulfilling all customers’ needs. In the same vein, the effects of ownership (domestic vs. foreign), restrictions to capital (open vs. closed) and “compliance with Sharia finance” (Islamic vs. non-Islamic) depend on a plethora of factors,
notably: organizational capabilities of staff on the one hand, dynamism and expansion of markets on the other. The choice of these information asymmetry and control variables is consistent with recent literature (Asongu & Biekpe, 2017). As presented in Table 1: (i) small banks are financial institutions for which the ratio of Bank Assets to Total Assets for a given period is less than or equal to 0.50 (i.e. ≤ 0.50) while big banks are financial institutions for which the ratio of Bank Assets to Total Assets for a given period is higher than 0.50 (i.e. >0.50);
16
(ii) open banks are financial institutions with a positive de juré capital openness (KAOPEN>0) while banks that are considered as closed have a negative or null de juré capital openness (KAOPEN≤0) and (iii) the identification of Islamic banks is consistent with Beck et al. (2010) and Ali (2012). The classification criterion of bank size is consistent with intuition and recent literature (Boateng et al., 2017).
The Appendix shows the summary statistics, correlation matrix (which depicts the relationships between the key variables employed in the paper), and variable sources (and corresponding definitions). It can be noticed from the summary statistics in Appendix 1 that the degree of variation in the data implies that reasonable estimated relationships can be derived. Appendix 2 presents a correlation matrix that helps to mitigate concerns of multicollinearity. Based on an initial evaluation of the correlation coefficients, there are no issues in the linkages to be estimated. The sources and definitions of the variables are provided in Table 1 while Appendix 3 discloses country-specific details on information sharing offices.
4. Empirical results
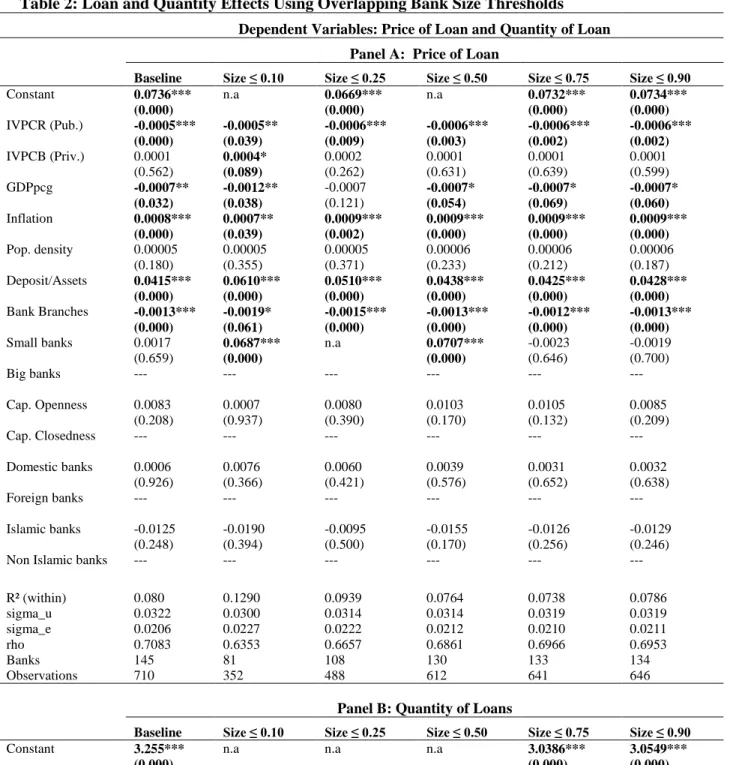
This section assesses three main issues: (i) the effect of information asymmetry on the loan price; (ii) the impact of information sharing on quantity of loans and (iii) the relevance of the QLH. To examine these concerns, we use an instrumental variable (IV) estimation strategy with overlapping and non-overlapping bank size thresholds. Table 2 presents findings based on overlapping bank size thresholds whereas the results of Table 3 are based on non-overlapping bank size thresholds. Panel A of either table focuses on the price of loans whereas Panel B is concerned with the quantity of loans. Owing to concerns of perfect multicollinearity, only one aspect of each feature of the unobserved heterogeneity is accounted for in each table. For example, on the feature of bank ownership, whereas Table 2 controls for domestic banks, Table 3 accounts for foreign banks.
The following findings can be established from Table 2 on overlapping bank size thresholds. First, public credit registries have a reducing effect on the price of loans with the magnitude of reduction almost the same across thresholds. Second, the effect of private credit bureaus on the price of loans is positive in the smallest threshold of bank size. Third, both public credit registries and private credit bureaus increase the quantity of loans with the magnitude of increment broadly rising when bigger banks are included in the distribution. Moreover, from a
17
comparative perspective, private credit bureaus more positively affect the quantity of loans when compared with public credit registries. Fourth, the QLH is not apparent because large banks are not associated with lower levels of financial access relative to small banks. Fifth, most of the significant control variables have the expected signs.
Table 2: Loan and Quantity Effects Using Overlapping Bank Size Thresholds Dependent Variables: Price of Loan and Quantity of Loan
Panel A: Price of Loan
Baseline Size ≤ 0.10 Size ≤ 0.25 Size ≤ 0.50 Size ≤ 0.75 Size ≤ 0.90 Constant 0.0736*** n.a 0.0669*** n.a 0.0732*** 0.0734***
(0.000) (0.000) (0.000) (0.000) IVPCR (Pub.) -0.0005*** -0.0005** -0.0006*** -0.0006*** -0.0006*** -0.0006*** (0.000) (0.039) (0.009) (0.003) (0.002) (0.002) IVPCB (Priv.) 0.0001 0.0004* 0.0002 0.0001 0.0001 0.0001 (0.562) (0.089) (0.262) (0.631) (0.639) (0.599) GDPpcg -0.0007** -0.0012** -0.0007 -0.0007* -0.0007* -0.0007* (0.032) (0.038) (0.121) (0.054) (0.069) (0.060) Inflation 0.0008*** 0.0007** 0.0009*** 0.0009*** 0.0009*** 0.0009*** (0.000) (0.039) (0.002) (0.000) (0.000) (0.000) Pop. density 0.00005 0.00005 0.00005 0.00006 0.00006 0.00006 (0.180) (0.355) (0.371) (0.233) (0.212) (0.187) Deposit/Assets 0.0415*** 0.0610*** 0.0510*** 0.0438*** 0.0425*** 0.0428*** (0.000) (0.000) (0.000) (0.000) (0.000) (0.000) Bank Branches -0.0013*** -0.0019* -0.0015*** -0.0013*** -0.0012*** -0.0013*** (0.000) (0.061) (0.000) (0.000) (0.000) (0.000)
Small banks 0.0017 0.0687*** n.a 0.0707*** -0.0023 -0.0019 (0.659) (0.000) (0.000) (0.646) (0.700) Big banks --- --- --- --- --- --- Cap. Openness 0.0083 0.0007 0.0080 0.0103 0.0105 0.0085 (0.208) (0.937) (0.390) (0.170) (0.132) (0.209) Cap. Closedness --- --- --- --- --- --- Domestic banks 0.0006 0.0076 0.0060 0.0039 0.0031 0.0032 (0.926) (0.366) (0.421) (0.576) (0.652) (0.638) Foreign banks --- --- --- --- --- --- Islamic banks -0.0125 -0.0190 -0.0095 -0.0155 -0.0126 -0.0129 (0.248) (0.394) (0.500) (0.170) (0.256) (0.246) Non Islamic banks --- --- --- --- --- ---
R² (within) 0.080 0.1290 0.0939 0.0764 0.0738 0.0786 sigma_u 0.0322 0.0300 0.0314 0.0314 0.0319 0.0319 sigma_e 0.0206 0.0227 0.0222 0.0212 0.0210 0.0211 rho 0.7083 0.6353 0.6657 0.6861 0.6966 0.6953 Banks 145 81 108 130 133 134 Observations 710 352 488 612 641 646
Panel B: Quantity of Loans
Baseline Size ≤ 0.10 Size ≤ 0.25 Size ≤ 0.50 Size ≤ 0.75 Size ≤ 0.90 Constant 3.255*** n.a n.a n.a 3.0386*** 3.0549***
(0.000) (0.000) (0.000)
18 (0.017) (0.002) (0.015) (0.003) (0.002) (0.001) IVPCB (Priv.) 0.0066** 0.0042 0.0080* 0.0072** 0.0072** 0.0075** (0.038) (0.406) (0.086) (0.047) (0.041) (0.033) GDPpcg -0.0110*** -0.0073 0.0049 -0.0104*** -0.0109*** -0.0113*** (0.000) (0.134) (0.135) (0.003) (0.002) (0.001) Inflation -0.0023 -0.0017 -0.0020 -0.0028* -0.0027 -0.0027* (0.115) (0.431) (0.279) (0.094) (0.110) (0.087) Pop. density 0.0025* -0.0019 0.0028 0.0033 0.0027 0.0027 (0.090) (0.260) (0.232) (0.112) (0.151) (0.147) Deposit/Assets 0.3524* 0.5123** 0.3830* 0.3292* 0.3548* 0.3578* (0.052) (0.034) (0.058) (0.088) (0.060) (0.056) Bank Branches 0.0547*** 0.0983*** 0.0665*** 0.0595*** 0.0553*** 0.0528*** (0.000) (0.000) (0.000) (0.000) (0.000) (0.000) Small banks -0.0273 2.700*** 2.776*** 2.987*** 0.0061 0.0140 (0.611) (0.000) (0.000) (0.000) (0.915) (0.807) Big banks --- --- --- --- --- --- Cap. Openness -0.0882 1.0727*** -0.0552 -0.0860 -0.0186 -0.0502 (0.270) (0.000) (0.838) (0.570) (0.873) (0.561) Cap. Closedness --- --- --- --- --- --- Domestic banks 0.1267 -0.1737 0.1236 0.2507 0.2567 0.2336 (0.684) (0.581) (0.725) (0.463) (0.438) (0.479) Foreign banks --- --- --- --- --- --- Islamic banks -0.2778 -0.1395 -0.3871 -0.1873 -0.2297 -0.2181 (0.535) (0.562) (0.455) (0.691) (0.617) (0.633) Non Islamic banks --- --- --- --- --- ---
R² (within) 0.3640 0.3813 0.3716 0.3821 0.3672 0.3660 sigma_u 1.0538 0.9085 1.101 1.1008 1.0498 1.0454 sigma_e 0.1640 0.1695 0.1604 0.1546 0.1578 0.1573 rho 0.9763 0.9663 0.9792 0.9806 0.9778 0.9778 Banks 145 81 108 130 133 134 Observations 733 361 501 626 656 661
*,**,***: significance at 10%, 5% and 1% respectively. IV: Instrumental Variable. PCR: Public credit registries. PCB: Private credit bureaus. IVPCR (Pub.): Instrumented Public credit registries. IVPCB (Priv.): Instrumented Private credit bureaus. GDPpcg: GDP per capita growth. Pop. density: Population density. Cap: Capital. na: omitted in the regression due to issues of multicolinearity. P-values in brackets.
The following four key findings can be confirmed from Table 3 on non-overlapping bank size thresholds. First, public credit registries have a decreasing effect on the price of loans and the rate of decline is not significantly different across our various specifications. Second, the effect of private credit bureaus on the price of loans is not statistically significant. Third, whereas both public credit registries and private credit bureaus considerably improve the quantity of loans, there is no apparent evidence that larger banks are associated with a lower magnitude in the underlying positive effects. Moreover, private credit bureaus exert more favourable effect on quantity of loans compared with public credit registries. Fourth, most of the significant control variables have the expected signs. It is important to note that the findings with non-overlapping thresholds are broadly consistent with those that are conditional on overlapping thresholds.
19
Table 3: Loan and Quantity Effects Using Non-overlapping Bank Size Thresholds Dependent Variables: Price of Loan and Quantity of Loan
Panel A: Price of Loan Baseline 0.10<Bank Size ≤ 0.25 0.25<Bank Size ≤ 0.50 0.50<Bank Size ≤ 0.75 0.75<Bank Size ≤ 0.90 0.90<Bank Size Constant 0.0718*** 0.0580** 0.0714*** 0.0695*** 0.0720*** n.a (0.000) (0.032) (0.000) (0.000) (0.000) IVPCR (Pub.) -0.0005*** -0.0005** -0.0006*** -0.0006*** -0.0006*** -0.0003* (0.000) (0.039) (0.009) (0.003) (0.002) (0.072) IVPCB (Priv.) 0.0001 0.0004 0.0002 0.0001 0.0001 0.0002 (0.562) (0.089 (0.262) (0.631) (0.639) (0.367) GDPpcg -0.0007 -0.0012** -0.0007 -0.0007* -0.0007* -0.0004 (0.032) (0.038) (0.121) (0.054) (0.069) (0.428) Inflation 0.0008** 0.0007** 0.0009*** 0.0009*** 0.0009*** 0.0003 (0.000) (0.039) (0.002) (0.000) (0.000) (0.122) Pop. density 0.00005 0.00005 0.00005 0.00006 0.00006 0.00003 (0.180) (0.355) (0.371) (0.233) (0.212) (0.482) Deposit/Assets 0.0415*** 0.0610*** 0.0510*** 0.0438*** 0.0425*** 0.0353 (0.000) (0.000) (0.000) (0.000) (0.000) (0.117) Bank Branches -0.0013*** -0.0019* -0.0015*** -0.0013*** -0.0012*** -0.0005 (0.000) (0.061) (0.000) (0.000) (0.000) (0.651) Small banks --- --- --- --- --- ---
Big banks -0.0017 n.a n.a n.a 0.0023 0.0546
(0.659) (0.646) (0.307) Cap. Openness --- --- --- --- --- --- Cap. Closedness -0.0083 -0.0007 -0.0080 -0.0103 -0.0105 0.0131 (0.208) (0.937) (0.390) (0.170) (0.132) (0.715) Domestic banks --- --- --- --- --- --- Foreign banks -0.0006 -0.0076 -0.0060 -0.0039 -0.0031 0.0185 (0.926) (0.366) (0.421) (0.576) (0.652) (0.389) Islamic banks --- --- --- --- --- ---
Non Islamic banks 0.0125 0.0190 0.0095 0.0155 0.0126 n.a (0.248) (0.394) (0.500) (0.170) (0.256) R² (within) 0.0801 0.1290 0.0939 0.0764 0.0738 0.137 sigma_u 0.0322 0.0300 0.0314 0.0314 0.0319 0.0349 sigma_e 0.0206 0.0227 0.0222 0.0212 0.0210 0.0132 rho 0.7083 0.6353 0.6657 0.6861 0.6966 0.8743 Banks 145 81 108 130 133 19 Observations 710 352 488 612 641 64
Panel B: Quantity of Loan Baseline 0.10<Bank Size ≤ 0.25 0.25<Bank Size ≤ 0.50 0.50<Bank Size ≤ 0.75 0.75<Bank Size ≤ 0.90 0.90<Bank Size Constant 2.988*** 3.460*** 2.457*** 2.964*** 3.053*** n.a (0.000) (0.000) (0.000) (0.000) (0.000) IVPCR (Pub.) 0.0043** 0.0052*** 0.0047** 0.0052*** 0.0054*** -0.0044** (0.017) (0.002) (0.015) (0.003) (0.002) (0.040) IVPCB (Priv.) 0.0066** 0.0042 0.0080* 0.0072** 0.0072** 0.00001 (0.038) (0.406) (0.086) (0.047) (0.041) (0.994) GDPpcg -0.0110*** -0.0073 -0.0074 -0.0104*** -0.0109*** -0.0157*** (0.000) (0.134) (0.135) (0.003) (0.002) (0.000) Inflation -0.0023 -0.0017 -0.0020 -0.0028* -0.0027 -0.0010 (0.115) (0.431) (0.279) (0.094) (0.110) (0.653)
20 Pop. density 0.0025* -0.0019 0.0028 0.0033 0.0027 0.0066*** (0.090) (0.260) (0.232) (0.112) (0.151) (0.000) Deposit/Assets 0.3524* 0.5123** 0.3830* 0.3292* 0.3548* -0.1352 (0.052) (0.034) (0.058) (0.088) (0.060) (0.299) Bank Branches 0.0547*** 0.0983*** 0.0665*** 0.0595*** 0.0553*** 0.1687*** (0.000) (0.000) (0.000) (0.000) (0.000) (0.002) Small banks --- --- --- --- --- ---
Big banks 0.0273 n.a n.a n.a -0.0061 -2.964*
(0.611) (0.915) (0.094) Cap. Openness --- --- --- --- --- --- Cap. Closedness 0.0882 -1.072*** 0.0552 0.0860 0.0186 5.756*** (0.270) (0.000) (0.838) (0.570) (0.873) (0.001) Domestic banks --- --- --- --- --- --- Foreign banks -0.1267 0.1737 -0.1236 -0.2507 -0.2567 1.1869 (0.684) (0.581) (0.725) (0.463) (0.438) (0.118) Islamic banks --- --- --- ---- --- ---
Non Islamic banks 0.2778 0.1395 0.3871 0.1873 0.2297 n.a (0.535) (0.562) (0.455) (0.691) (0.617) R² (within) 0.3640 0.3813 0.3716 0.3821 0.3672 0.675 sigma_u 1.0538 0.9085 1.101 1.100 1.049 1.2244 sigma_e 0.1640 0.1695 0.1604 0.1546 0.1578 0.0957 rho 0.9763 0.9663 0.9792 0.9806 0.9778 0.9939 Banks 145 81 108 130 133 20 Observations 733 361 501 626 656 72
*,**,***: significance at 10%, 5% and 1% respectively. IV: Instrumental Variable. PCR: Public credit registries. PCB: Private credit bureaus. IVPCR (Pub.): Instrumented Public credit registries. IVPCB (Priv.): Instrumented Private credit bureaus. GDPpcg: GDP per capita growth. Pop. density: Population density. Cap: Capital. na: omitted in the regression due to issues of multicolinearity. P-values in brackets.
In what follows, we further discuss the findings from two main perspectives, notably the nexus with the extant literature and relevance of the QLH. The former perspective on the relations with existing literature is discussed from both non-comparative and comparative standpoints. First, on the comparative viewpoint we have literature that agrees and disagrees with the established findings. Accordingly, the results are in line with Singh et al. (2009) who have shown that in Africa, nations that promote the establishment of information sharing offices benefit from higher levels of financial access in the perspective of credit to the private sector. Conversely, the findings run counter to Asongu et al. (2016) who have used macroeconomic variables to show that information sharing offices decrease financial development.
Second, with regard to the comparative perspective, we also find studies that are both consistent and inconsistent with the main findings. The comparative argument here should be understood within the framework that private credit bureaus (public credit registries) have a higher effect in increasing financial access. This is because they have a higher significant positive effect on the quantity of loans and a decreasing effect on the price of loans.
21
From the scope of quantity of loans, two studies have concluded on the higher comparative advantage of private credit bureaus, namely (i) Triki and Gajigo (2014) who concluded that financial access is on average higher in nations with private credit bureaus compared to countries with public credit registries or neither information sharing office and (ii) Love and Mylenko (2003) who showed that in the presence of private registries, there are lower financing constraints and a higher share of bank financing while, the effect on such limitations and benefits are not apparent in the presence of public registries. Conversely, the findings of Galindo and Miller (2001) are not in accordance with the previous two in the respect that credit registries are associated with less financial restrictions compared to credit bureaus that are less developed. The above comparative narrative in favour of private credit bureaus within the framework of quantity of loans can also be used to substantiate the comparative description in preference of public credit registries within the context of price of loans.
On the latter perspective of market power, we have consistently recognized that the QLH does not withstand empirical validity. This is principally because we have not found evidence that distributions with higher representations of banks with large sizes are associated with lower (higher) “quantity of loans” (price of loans). On the contrary, there is some scanty evidence suggesting “reverse QLH”: bank size being an increasing function of lower loan price and higher loan quantity. Hence, in the light of the findings, we can confirm that managers of financial institutions in the African banking industry are taking advantage of information sharing offices to promote financial access contrary to the insinuations of the QLH. By extension, the information sharing offices (public credit registries and private credit bureaus) are playing their theoretical role of reducing informational rents associated with information asymmetry between bank lenders and borrowers.
5. Conclusion and Future Research Directions
This study has investigated how bank size affects the role of information asymmetry on financial access in a panel of 162 banks in 39 African countries for the period 2001-2011. The empirical evidence is based on instrumental variable Fixed Effects regressions with overlapping and non-overlapping bank size thresholds to control for the QLH (Quiet Life Hypothesis). The QLH postulates that large banks will use their privileges for private gains at the expense of financial
22
access. Financial access is measured with loan price and loan quantity whereas information asymmetry is understood in terms of the activities of public credit registries and private credit bureaus. The findings with non-overlapping thresholds are broadly consistent with those that are provisional on overlapping thresholds. First, public credit registries have a reducing effect on the price of loans with the magnitude of reduction nearly comparable across different bank size thresholds. Second, both public credit registries and private credit bureaus enhance the quantity of loans. Third, from a comparative perspective, private credit bureaus (public credit registries) have a higher effect in increasing financial access. This follows from our finding that private credit bureaus have a greater significant positive (decreasing) effect on the quantity of loans (price of loans). Fourth, the QLH is not apparent because large banks are not associated with lower levels of financial access relative to small banks.
The main policy implication of this study is that, the institution of information sharing offices should be encouraged and consolidated across the continent because they are necessary in reducing information asymmetry that potentially constrain financial access. Future studies can improve the extant literature by assessing how information and communication technology tools can complement our chosen information sharing offices in order to further enhance financial access. The intuition for this recommendation is that information and communication technology is a natural instrument by which information sharing offices can accomplish their theoretical role of reducing information asymmetry between lenders and borrowers in the banking industry. Moreover, assessing whether the findings established in this study withstand empirical scrutiny when assessed within country-specific frameworks is a worthwhile future research direction because such is necessary for more targeted country-specific policy recommendations. This recommendation is even more relevant given the apparent issues in degrees of freedom in information sharing offices for some of the sampled countries.
23
Appendices
Appendix 1: Summary Statistics
Mean S.D Minimum Maximum Observations
Dependent variables
Price of Loans 0.338 0.929 0.000 25.931 1045
Quantity of Loans (ln) 3.747 1.342 -0.045 6.438 1091
Independent Public credit registries 2.056 6.206 0.000 49.800 1240
variables Private credit bureaus 7.496 18.232 0.000 64.800 1235
Market variables
GDP per capita growth 13.912 96.707 -15.306 926.61 1782
Inflation 10.239 22.695 -9.823 325.00 1749 Population density 81.098 106.06 2.085 633.52 1782 Bank level variables Deposits/Assets 0.664 0.198 0.000 1.154 1052 Bank Branches 6.112 6.158 0.383 37.209 1129 Dummy variables Small Size 0.804 0.396 0.000 1.000 1255 Large Size 0.195 0.396 0.000 1.000 1255 Openness (Kaopen) 0.232 0.422 0.000 1.000 1782 Closedness (Kaopen) 0.767 0.422 0.000 1.000 1782 Domestic 0.753 0.431 0.000 1.000 1782 Foreign 0.246 0.431 0.000 1.000 1782 Islamic 0.037 0.188 0.000 1.000 1782 Non-Islamic 0.962 0.188 0.000 1.000 1782
Ln: Logarithm. GDP: Gross Domestic Product. S.D: Standard Deviation. GDP: Gross Domestic Product. Indep: Independent. Vble: Variable. Kaopen: de juré capital account openness.
Appendix 2: Correlation Matrix
Independent variables
Control Variables Dependent
Variables Market-level Bank-level Dummies (for the unobserved heterogeneity)
PCB PCR GDP Infl. Pop. D/A Bbrchs Ssize Lsize Open Closed Dom. Foreign Islam NonIsl. Price Qty 1.00 -0.13 0.022 -0.12 -0.18 -0.10 0.143 0.103 -0.10 -0.003 0.003 0.176 -0.176 -0.080 0.080 0.111 -0.032 PCB 1.000 0.040 -0.20 0.435 -0.01 0.553 -0.08 0.084 0.022 -0.022 0.012 -0.012 0.026 -0.026 -0.282 -0.08 PCR 1.000 -0.03 -0.08 0.048 -0.057 -0.08 0.085 -0.064 0.064 0.065 -0.065 -0.021 0.021 -0.017 0.021 GDP 1.000 -0.05 0.057 -0.012 0.069 -0.06 -0.019 0.019 0.053 -0.053 -0.025 0.025 0.107 0.024 Infl. 1.000 0.126 0.350 -0.04 0.040 0.275 -0.275 -0.033 0.033 -0.112 0.112 0.045 -0.128 Pop. 1.000 0.028 -0.13 0.135 0.072 -0.072 -0.073 0.073 -0.236 0.236 0.106 0.292 D/A 1.000 -0.07 0.076 0.0008 -0.0008 0.143 -0.143 -0.036 0.036 -0.266 -0.182 Bbrchs 1.000 -1.00 0.167 -0.167 0.033 -0.033 0.026 -0.026 0.049 -0.218 Ssize 1.000 -0.167 0.167 -0.033 0.033 -0.026 0.026 -0.049 0.218 Lsize 1.000 -1.000 0.035 -0.035 -0.065 0.065 0.212 0.099 Open 1.000 -0.035 0.035 0.065 -0.065 -0.212 -0.099 Closed 1.000 -1.000 0.112 -0.112 0.017 0.038 Dom 1.000 -0.112 0.112 -0.017 -0.038 Foreign 1.000 -1.000 -0.106 0.116 Islamic 1.000 0.106 -0.036 NonIsl. 1.000 -0.036 Price 1.000 Qty PCB: Private Credit Bureaus. PCR: Public credit registries. GDP: GDP per capita growth. Infl: Inflation. Pop: Population growth. D/A: Deposit
on Total Assets. Bbrchs: Bank branches. Szize: Small banks. Lsize: Large banks. Open: Capital openness. Closed: Capital closedness. Domestic: Domestic banks. Foreign: Foreign banks. Islam: Islamic banks. NonIsl: Non-Islamic banks. Price: Price of Loans. Qty: Quantity of Loans.
Appendix 3: Country-specific average values from information sharing offices
Public Credit Registries Private Credit Bureaus
1) Algeria 0.216 0 .000
24 3) Benin 8.037 0.000 4) Botswana 0 .000 48.150 5) Burkina Faso 1.750 0.000 6) Burundi 0.212 0.000 7) Cameroon 2.312 0.000 8) Cape Verde 17.042 0.000
9) Central African Republic 1.412 0.000
10) Chad 0.400 0.000
11) Comoros 0.000 0.000
12) Congo Democratic Republic 0.000 0.000 13) Congo Republic 3.400 0.000 14) Côte d’Ivoire 2.487 0.000 15) Djibouti 0.200 0.000 16) Egypt 2.062 5.271 17) Equatorial Guinea 2.566 0.000 18) Eritrea 0.000 0.000 19) Ethiopia 0.087 0.000 20) Gabon 12.716 0.000 21) The Gambia 0.000 0.000 22) Ghana 0.000 1.700 23) Guinea 0.000 0.000 24) Guinea-Bissau 1.000 0.000 25) Kenya 0.000 1.750 26) Lesotho 0.000 0.000 27)Liberia 0.280 0.000 28) Libya na na 29) Madagascar 0.162 0.000 30) Malawi 0.000 0.000 31) Mali 2.812 0.000 32) Mauritania 0.187 0.000 33) Mauritius 27.866 0.000 34) Morocco 1.200 4.812 35) Mozambique 1.637 0.000 36) Namibia 0.000 50.362 37) Niger 0.825 0.000 38) Nigeria 0.025 0.000 39) Rwanda 0.425 0.275
40) Sao Tome & Principe 0.000 0.000
41) Senegal 3.787 0.000 42) Seychelles 0.000 0.000 43) Sierra Leone 0.000 0.000 44) Somalia na na 45) South Africa 0.000 57.312 46) Sudan 0.000 0.000 47) Swaziland 0.000 40.216 48) Tanzania 0.000 0.000 49) Togo 2.550 0.000 50) Tunisia 15.975 0.000 51) Uganda 0.000 0.512 52)Zambia 0.000 0.975 53) Zimbabwe 0.000 0.000
25
References
Acharya, V., Amihud, Y., & Litov, L., (2011), “Creditor rights and corporate risk taking”,
Journal of Financial Economics, 102(1), pp. 150-166.
Alagidede, P., (2008), “African Stock Market Integration: Implications for Portfolio Diversification and International Risk Sharing”, Proceedings of the African Economic Conferences 2008, Tunis.
Ali, S. S., (2012), “Islamic Banking in the MENA Region”, Islamic Research and Training Institute (IRTI), Working Paper Series No. 1433-01, Jeddah.
Asongu, S.A., (2012). “Government quality determinants of stock market performance in African countries”, Journal of African Business, 13(3), pp. 183-199.
Asongu, S. A., (2013). “How would population growth affect investment in the future: asymmetric panel causality evidence for Africa”, African Development Review, 25(1), pp. 14-29.
Asongu, S. A., (2014). “Correcting Inflation with Financial Dynamic Fundamentals: Which Adjustments Matter in Africa?” Journal of African Business, 15(1), pp. 64-73.
Asongu, S. A., (2015). “Liberalisation and Financial Sector Competition: A Critical Contribution to the Empirics with an African Assessment”, South African Journal of Economics, 83(3), pp. 425–451.
Asongu, S., (2016). “New empirics of monetary policy dynamics: evidence from the CFA franc zones”, Journal of African Business, 7(2), pp. 164-204.
Asongu, S., A & Biekpe, N., (2017). “ICT, information asymmetry and market power in African banking industry”, Research in International Business and Finance,
DOI: 10.1016/j.ribaf.2017.07.121
Asongu, S. A., Le Roux, S., & Tchamyou, V. S., (2017). “Essential Information Sharing Thresholds for Reducing Market Power in Financial Access: A Study of the African Banking Industry”, Journal of Banking Regulation: Forthcoming.
Asongu, S. A., & Nwachukwu, J. C., (2017). “The synergy of financial sector development and information sharing in financial access: Propositions and empirical evidence”, Research in International Business and Finance, 40 (April), pp. 242-258.
Asongu, S. A., Nwachukwu, J. C., & Tchamyou, V. S., (2016). “Information asymmetry and financial development dynamics in Africa”, Review of Development Finance, 6(2), pp. 126-138. Bartels, F. L., Alladina, S. N., & Lederer, S., (2009), “Foreign Direct Investment in Sub-Saharan Africa: Motivating Factors and Policy Issues”, Journal of African Business, 10(2), pp. 141-162.
26
Barth, J., Lin, C., Lin, P., & Song, F., (2009), “Corruption in bank lending to firms: cross-country micro evidence on the beneficial role of competition and information sharing”, Journal of Financial Economics, 99(3), pp. 361-368.
Batuo, M. E., & Kupukile, M., (2010), “How can economic and political liberalization improve financial development in African countries?”, Journal of Financial Economic Policy, 2(1), pp. 35-59.
Beck, T., Demirguc-Kunt, A., & Merrouche, O., (2010), “Islamic vs. Conventional Banking: Business Model, Efficiency and Stability”, World Bank Policy Research Working Paper No. 5446, Washington D.C.
Benzschawel, T., DaGraca, J., Lee, C-Y., (2012), “Pricing corporate loans under the risk-neutral measure”, Journal of Credit Risk, 8(1), pp. 29-62.
Bharath, S. T., Pasquariello, P., & Wu, G., (2009), “Does Asymmetric Information Drive Capital Structure Decisions?”, The Review of Financial Studies, 22(8), pp. 3211-3243.
Boateng, A., Asongu, S. A., Akamavi, R., & Tchamyou, V. S., (2017). “Information
Asymmetry and Market Power in the African Banking Industry”, African Governance and Development Institute Working Paper No. 17/022, Yaoundé.
Bocher, T. F., Alemu, B. A., & Kelbore, Z. G., (2017). “Does access to credit improve household welfare? Evidence from Ethiopia using endogenous regime switching regression”, African
Journal of Economic and Management Studies, 8(1), pp.51-65.
Bongomin, G. O. C., Ntayi, J. M., & Munene, J. C., (2016). “Financial Inclusion in Rural Uganda: Testing Interaction Effect of Financial Literacy and Networks”, Journal of African Business, 17(1), pp. 106-128.
Brockman, P., & Unlu, E., (2009), “Dividend policy, creditor rights and the agency cost of debt”,
Journal of Financial Economics, 92(2), pp. 276-299.
Brown, M., Jappelli, T., & Pagano, M., (2009), “Information sharing and credit : firm-level evidence from transition countries”, Journal of Financial Intermediation, 18(2), pp. 151-172. Claessens, S., & Klapper, L., (2005), “Bankruptcy around the world: explanations of its relative use”, American Law and Economics Review, 7(1), pp. 253-283.
Charles, G., & Mori, N., (2016). “Effects Of Collateral On Loan Repayment: Evidence From An Informal Lending Institution”, Journal of African Business, 17(2), pp. 254-272.
Chapoto, T., & Aboagye, A. Q. Q., (2017). “African innovations in harnessing farmer assets as collateral”, African Journal of Economic and Management Studies, 8(1), pp. 66-75.