Exploring Attitudes towards Machine Designing
Roland K. Arter
University of Akron, [email protected]
Abstract - Engineering design is usually viewed as an extension of “hard” science, a result of pure objective information and reasoning. To a large degree this can be true, but along the way a multitude of contributing subjective decisions is made though rarely discussed. What projects are selected and why they are selected is a result of subjective as well as objective decisions. Experience-based decisions are subjective as well as objective. Problem solving is partially subjective. This study focuses on the responses of eight mechanical engineering technology design students on the role of subjectivity in the machine designing process. These students and the instructor constructed a concourse of words that reflected both technical and non-technical elements and issues encountered during the machine designing process. Each student sorted these words and the sorts that were evaluated using Q-methodology. As expected, technical and business considerations such as cost and safety proved to be dominant, but non-technical issues such as customer needs and experience also surfaced prominently. This opens the question, do students form their opinions and technical views on their own, or are they strongly influenced by their instructors and professional work experiences? As an engineering community do we make engineering more objective that it actually is in an effort to be more factual?
Index Terms - Design evaluation, designing process, machine designing, Q methodology, subjectivity.
INTRODUCTION
Engineering design is usually viewed as a procedural linear construction based on facts, mathematics and science and guided by accepted principles [1]. It can be viewed primarily as an objective process with only minimal subjective influences, if any at all. But, even a cursory inspection of the design process shows that objective and subjective processes occur concurrently. Some designers are proficient because they think “outside of the box” and not in linear or purely objective terms. Designing is more of a problem solving experience than a procedural one with foregone conclusions, and has an infinite number of possible outcomes [1]-[2]. As a process designing is poorly structured in many cases, and based more in circumstances, constraints and beliefs than in procedures. Designing also includes ergonomics, appearance and considerations of customer perception, all of which are subjective.
Problem solving is highly subjective. It requires creativity, critical thinking and the ability to see new relationships buried in old circumstances. It requires the ability to move away from the optimal towards “satisficing,” or providing a sufficiently satisfactory solution. The solution does not have to be “perfect.” It only has to be workable and reliable. Problem solving is what engineers and engineering technologist do. It is the most meaningful outcome of a technical education and subjective as well as objective inputs are required [1]. So, why are subjectivity and the role it plays in the machine designing process, or any designing process, completely ignored?
This purpose of this study is to discover and evaluate the views and opinions of eight engineering technology students about subjectivity as part of the machine designing process. The core research questions are:
What are the students‟ views of the machine designing process? Are “people issues” ever considered?
What are their general views toward subjectivity? It is also a goal, though it was never openly stated to the students, to see if these students would view this study as a learning experience, and view subjectivity differently after having gone through it.
Q METHODOLOGY
Q methodology was first introduced in the mid-1930s by William Stephenson, and then reintroduced in the mid-1950s. His ideas did not begin to gain prominence until the 1980s [3]. Stephenson‟s background is unique in that he held Ph.D. degrees in physics and psychology. This probably led to his seeing commonalities in physics and human behaviors [3]. His major focus, and use of Q methodology, has been the categorization and understanding of subjectivity in terms of people‟s viewpoints and perspectives.
The core concepts are based in concourse theory, or “the law of concourse” [4]. Simply stated, people even as children have a tendency to classify things into “natural‟ categories, and naturally do so when allowed to discuss and share their ideas and opinions during open concourse. From this concourse a set of salient statements can be developed, recorded and then used to better understand exactly what the dominant opinions are within the group. These statements of personal views and opinions of a common experience are data and can be treated statistically to determine differing and congruent trends [3]-[5].
“Natural” categories relate to the fact that by the age of three most children (and all adults) place objects into
categories without being instructed to do so. Apples and oranges are naturally categorized a fruit. Tables and chairs are naturally categorized as furniture. Categorization is a natural human tendency and extends to abstractions as we mature. Learning experiences, general topics and opinions are naturally grouped, and the individuals that hold these opinions also have a tendency to group. Q methodology is a means of indentifying these group trends. Brown‟s description of concourse provides a succinct insight:
Concourse is the very stuff of life, from the playful banter of lovers or chums to the heady discussions of philosophers and scientists to the private thoughts found in dreams and diaries. From concourse, new meanings arise, bright ideas are hatched, and discoveries are made: it is the wellspring of creativity and identity formation in individuals, groups, organizations, and nations, and it is Q methodology's task to reveal the inherent structure of a concourse -- the vectors of thought that sustain it and which, in turn, are sustained by it [3].
An important point is to recognize the difference between objective and subjective statements [4]. “It is snowing outside” is an objective statement. One can simply walk to the nearest window or door and verify that it is or is not snowing. On the other hand, “I find the falling snow invigorating” is a subjective statement. It cannot be verified and must be taken or rejected at face value depending on how the listener views the speaker. (In Q methodology the subjectivity of both are taken into account.) It is an opinion. It represents how an individual is thinking or feeling at any given time. A person standing nearby may think or feel the opposite. The individual that made the comment may feel the opposite later that day. Q methodology identifies and categorized thoughts, feeling and opinions and in no way attempts to verify or validity them. Q methodology makes no direct attempt to access how these opinions lead to subsequent decisions or actions. At best the results may correlate to an action, but never in a causal sense.
Sometimes the subjectivity of a statement may not seem clear. For example, “It is snowing hard outside.” This statement may seem objective, but observers may not be able to agree on what is “hard,” therefore the statement is subjective. An observer from Minnesota will evaluate a snowfall differently than an observer from Georgia. It is acceptable to ask for a subjective response to an objective or questionable statement. In this study words are used instead of sentences, but it is accompanied with instructions that subjective responses are required, not word definitions.
THE PROCESS
During the development of the concourse statements that represent the various viewpoints are collected and numbered. This list of statements can be the product of conventional brainstorming, a collection of statements taken from the literature relating to the topic at hand, or a combination of both. The items do not have to be statements. They can be single words, pictures, even videos
or sound tracts [3], [5]. The only requirement is that all of the participants clearly understand the intended meaning of each item and that each item reflects a subjective, not objective content. In the event that the item is not subjective intrinsically, such as a single word or picture, clear instructions must be given to respond to them as such. A key element at this stage of Q methodology is that all of the participants agree upon and understand what the intended meaning is of each item, not that they agree with the meaning or believe in it.
Each statement or item is randomly assigned a number. Typically between 30 and 60 items are used. Less than 30 may not reflect the full range of the concourse and more than 60 become cumbersome to process. In standard statistics the focus is on the number of participants required to ensure validity. One item can be evaluated at a time. Q methodology requires an adequate number of statements, enough to reflect the full scope of the concourse, and only a few individuals need to participate. The participants are being categorized, not the statements. It is also acceptable for one participant to engage in several Q sorts to compare attitudes towards different situations or changes in attitude over time.
Each participant is given a set of these numbered statements on cards or slips of paper and asked to sort them from the most meaningful or important or high ranking to the least meaningful or important or low ranking with neutral statements in the middle. A typical format for Q sorting is shown in Figure 1 [5]. Each participant arranges his/her set of statements into three initial piles, agree, disagree and neutral. “Neutral” may also mean “don‟t care” or “don‟t know were else to put it” as well as actual neutrality. The participants then sort their piles using the format shown in Figure 1. Typical ranges are from +4 and -4 to +6 and -6. Less that -4 usually does reflect the scope of the concourse and more than 6 become cumbersome and more difficult for the participants to sort. A typical completed Q sort for 30 items is shown in Figure 2.
FIGURE 1 ATYPICAL QSORT.
The distribution shown is selected because it more easily facilitates sorting, not because it is “normal.” A study was conducted in which 16 patterns of identical data were
compared [6]. The patterns had almost no impact the outcomes as long as the order of the entries remained unchanged. Using the example in Figure 2, as long as the order from left to right went from 3, 17, 10, 26, 7,… to …24, 27, 13, 14, 21, the outcomes were totally insensitive to the distributions. Normality in a statistical sense does not apply.
FIGURE 2
ATYPICAL COMPLETED QSORT.
After the responses are sorted the participants record their sorts on paper. Sometimes the participants are interviewed as to why they answered as they did for future reference. Sometimes similar questions are included as part of the Q sort form. Two individuals may answer a subset of questions identically, but for very different reasons [5]. Understanding why helps to interpret the results of the analysis.
The sort of each participant is compared to the sorts of the other participants in the group, taking the differences of the sorts and forming a correlation matrix of rxy values. In should be noted, however, that when compared to a correlation matrix used in standard statistical analysis it will be the transpose of a standard correlation, or R matrix. The participants are being evaluated and compared, not their statements although their statements are used to do it. The letter “Q” is used in part to delineate it from standard R correlation use in statistical analysis.
The correlation matrix is factored using standard factoring and rotation methods. Any factoring method can be used, such as principal components, and any rotation method, such as Varimax. Both can be found in standard statistical packages such as SPSS with an assortment of other choices. An equally effective way to process Q sorts is with the centroid factoring method and manual rotation. The centroid method rarely used outside of Q methodology. Hand rotation is only used with Q methodology.
Q methodology is primarily a qualitative method though it uses the quantitative methods of correlation and factoring to process data. The concourse and the resulting list of concourse statements are qualitative, and the interpretation of the results is qualitative. Using numerical methods to process qualitative results does not make the entire effort quantitative. In standard statistics the goals are optimization
and numerical exactness. In Q methodology the goal is to find the most fitting descriptions and comparisons of the opinions expresses whether they are mathematically optimal or not [5]. The former process is determinate. The latter process is indeterminate and allows broader interpretations by the researcher, which is more in keeping with qualitative evaluations and analysis. Many times (not always) the centroid factoring method provides clearer results though it is considered to be an estimating process by most statisticians. Hand rotation allows researchers to find other relations in the factored data in addition the “optimal” one provided by Varimax or one of the other deterministic rotation methods.
The centroid method and principle components, and hand rotation and Varimax are made available by means of a DOS program, PQMethod [7]. PQMethod is an open source program, and therefore, free, and can be acquired at http://www.lrz-muenchen.de/~schmolck/qmethod/. It runs well directly under Windows, and under DOSBox in PC, Mac and Linux environments. DOSBox is also freeware and is available over the Internet at http://www.dosbox.com/ under “downloads.”
After the rotated factors are determined, the results show which participants lie on what factor. A factor can be bi-polar. That is, two groups of participants can lie on the same factor with one group strongly in agreement and one strongly in disagreement about the same subject. Care has to be taken not to interpret this as an additional factor. Usually interpretation is iterative. Most experienced Q researchers will review the data several times and alter their conclusions accordingly.
To summarize, there are three core stages to Q methodology and these steps may be repeated several times, especially the second and the third.
1. The formation of the concourse statements and the Q sort.
2. Correlation and factoring the resultant comparisons Q sorts.
3. Interpretation of the results. THE APPLICATION
This study centers around nine mechanical engineering technology students taking a senior level machinery design course. After many courses in which there is always a fixed answer it is sometimes difficult to convince machinery design students that it is not only okay if their answers do not agree with others in the class, but it is expected. No two designers make the same assumptions and draw the same conclusions during the designing process. If everyone has the same objective facts and has been taught the same objective solution processes, then it is not a large jump to assume that some the differences in results must have subjective causes.
The goals of this study were to 1) determine both objective and subjective elements or contributors to typical machine designing, focusing on the designing process, 2) to compare the two, objective and subjective elements, and 3)
for the students to become more aware of the role that subjectivity plays in the machine design process, all from the students‟ standpoint of view.
I. The Concourse
The concourse began with an open discussion about the contributing elements in designing a machine. Eight of the nine students and the instructor participated. Neither technical (objective) nor non-technical (subjective) topics were stressed at this point. The core question became, what are the elements of machine designing, concept through completion?
During the initial discussions the participants agreed that the following items were important to machine designing, and generally agreed on the meaning of each word. Single words or very short phrases were agreed upon to enhance understanding. The general feeling among the students was that longer sentences would more readily lead to faulty interpretations. The first list of words is referred to as the technical list (t).
What you need the machine to do Testing (the design concepts) Calculations (design analysis)
Maintenance (easy to repair and maintain) Research (preparation)
Operation of machine (ease of operation) Time constraints (deadlines)
Availability of resources
Costs (development, resources, labor) Marketing (required features) Customer needs
Life of the machine
Location (where will the machine be used) Ergonomics
Safety
Manufacturing issues Choice of material
Estimates (costs and use of resources) Size
After the students felt they had covered everything (the instructor never designated a minimum number of items), the instructor asked why no non-technical or personal (subjective) elements were included, especially since one of the stated goals was to list and compare non-technical contributions to machine designing as well as technical. The consensus was that non-technical issues, whether considered to be subjective or not, simply did not come to mind. The non-technical components just happen. Following this discussion they added the following items. This second list of words is referred to as non-technical (n).
Concerns about repercussions
Cultural background (of the designer and the work environment - company culture)
Personality traits Management of self Intuition
Assumptions Personal opinion
Conscience (in a moral sense) Education
Experience
Moods/emotion (at the time) Peer pressure
Income/salary Guesses (educated)
Management (response to supervision) Understanding of technology
Teamwork
Afterwards the instructor reviewed the ABET standards for engineering and engineering technology programs and added the following items since they were not listed above. Before conducting the Q sort the instructor explained that these items had been added and why they had been added. This is referred to as the ABET list (a).
Creativity Ethics Quality
Communication Timeliness
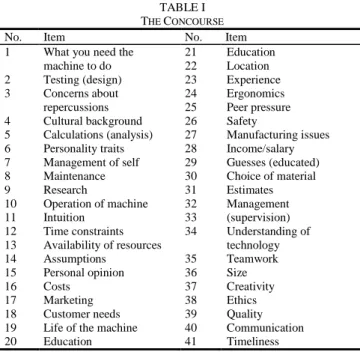
The final concourse, shown in Table I, is a mixture of the items listed above making a total of 41 items. This concluded the first step and the first meeting.
II. The Q Sort
Before the Q sort that took place during a second meeting the students and the instructor engaged in a brief review of the first meeting. Two students that participated in the concourse were absent, and another student that was absent during the concourse development participated in the Q sort. The students were given a form that contained a layout similar to Figure 1. They placed a pseudonym on the form for identification. They would able them to see what factor they fell on, but remain anonymous to the rest of the group including the instructor. Each form also asked for the reasons (open questions) each participant selected their +5 and -5 choices. This helps to determine if there is a large disparity in reasoning among individuals that fall on the same factor. Each participant completed the sort and filled in the form. The participants were not obligated to answer any of the questions and were also allowed to deviate from the Q sort format shown in Figure 1. Because only the order of the entries is important, PQMethod allows entries in alternate patterns. The only requirement is that 41 entries must be made.
TABLE I THE CONCOURSE
No. Item No. Item
1 2 3 4 5 6 7 8 9 10 11 12 13 14 15 16 17 18 19 20
What you need the machine to do Testing (design) Concerns about repercussions Cultural background Calculations (analysis) Personality traits Management of self Maintenance Research Operation of machine Intuition Time constraints Availability of resources Assumptions Personal opinion Costs Marketing Customer needs Life of the machine Education 21 22 23 24 25 26 27 28 29 30 31 32 33 34 35 36 37 38 39 40 41 Education Location Experience Ergonomics Peer pressure Safety Manufacturing issues Income/salary Guesses (educated) Choice of material Estimates Management (supervision) Understanding of technology Teamwork Size Creativity Ethics Quality Communication Timeliness
III. The Analysis
The eight forms, including the instructor‟s, were processed with PQMethod and all responses to the questions about +5 and -5 selections were recorded separately. Various analysis combinations were tried, and centroid factoring with hand rotation provided the most consistent results. “Consistency” amounted to a combination of the uniqueness of each factor supported by minimized interaction between factors, the amount of explained variance accounted for by the factors, comparisons with the distinguishing statements, and comparing the Q sort constructed for each factor with the original Q sorts for overlap.
IV. The Results
Three factors emerged with seven participants falling on a factor and are shown in Table II. “Wetfish” did not fall on a factor.
TABLE II FACTORS
Name Factor 1 Factor 2 Factor 3
Retired Stanley William Clinton Yohan Resh Tony Montana Tom Smith Wetfish Rebar -0.0045 0.5267X 0.7364X 0.4552 0.4849 0.4663 0.2478 0.2921 0.3362 0.4942 -0.0203 0.5990X 0.5844X 0.6700X 0.0103 0.3866X 0.4441X -0.1515 0.0692 -0.2848 -0.2761 0.1878 0.1878 0.0714 X – Factor loadings
Normally a factor with one item would be discarded, but the number of participants is small and “Retired” was the only participant to sacrifice quality during the development of a design. This is meaningful information.
PQMethod constructs a representative Q sort for each factor. Table III shows the top five most important and least important items for each factor. This also allows the researcher to compare these sorts to the original sorts of the participants to ensure a strong overlap in the +5, +4, +3 and -5, -4, -3 categories. (Do the factors track the trends in the input data?) Table III shows what was considered to most the least important to the participants under each factor.
TABLE III
FACTORS,TOP AND BOTTOM FIVE SELECTIONS
Factor 1 Factor 2 Factor 3
Most important: Customer needs (t) Experience (n) Operation of the machine (t) Education (n) Costs (t) Least important: Management (supervision) (n) Estimates (t) Concerns about repercussions (n) Ergonomics (t) Management of self (n) Participants: Stanley William Clinton (t) - technical list Most important: Costs (t) Safety (t) Customer needs (t) What the machine
does (t) Quality (a) Least important: Cultural background (n) Moods/emotions (n) Peer pressure (n) Concerns of repercussions (n) Personality traits (n) Participants: Yohan Resh Tony Montana Tom Smith Rebar (n) - non-technical list Most important: What the machine
does (t) Safety (t) Manufacturing issues (t) Operation of the machine (t) Costs (t) Least important: Teamwork (n) Maintenance (t) Quality (a) Management of self (n) Personal opinion (n) Participant: Retired (a) - ABET list
The two participants under Factor 1 expressed sensitivity to customer needs and satisfaction while showing little regard for formal structure or the concerns of management. It was also the only factor to show a mixture of technical and non-technical items under both the most and least important categories.
The four participants under Factor 2 consider only technical issues to be important. These are probably the more convention linear thinking designers. It is also possible that they are looking at designing from an analytical rather then creative perspective. They considered internally personal issues to be unimportant.
The single participant under Factor 3 is very similar to Factor 2 for what he considers to be most important, but considers many of the support issues and interpersonal skills to be unimportant.
All three “groups” consider costs and either the operation of the machine for the use of the machine to be important. Two the factors, 2 and 3, included safety as important. Overall technical issues were dominant and
considered to be the more important while non-technical issues were viewed as unimportant.
TABLE IV
COMMENTS FOR +5 AND -5SELECTIONS
Why did you select your +5 choice?
Safety:
“People‟s well being is by far most important.”
“I think it is by far the most important factor. If someone get hurt on you machine, you as the designer are part to blame.”
What you need the machine to do:
“They seemed the most relevant to meet the goals of making a good,
reliable, save machine that customers will want to buy.”
“It defines why I‟m working on the design.”
“…These choices are most important for the product to be
successful.”
Customer needs:
“With my top 5 choices all other requirements could/should be able
to be accounted for.”
Communication:
“Many businesses mess up orders or have a major problem when
people can‟t communicate.”
Why did you select your -5 choice?
Guesses (educated):
“Maintenance usually takes place after the first four [of his choices].”
“They seemed like relatively minor considerations with minimal
impact on getting this project completed.”
Cultural background:
“…These choices are least important to consider in design and little
to no affect on outcome.”
What you need the machine to do:
“It was left over. I put the broader categories towards the positive side because they can cover the more detailed elements that were listed toward the -2 & -3 region.”
Management (supervision):
“In some way or another they seemed to be a sub-category of the
elements I picked as important.”
Moods/emotion:
“…My emotions being important in machine design. We[„re]
engineers, not social workers.”
Location:
“Who cares? Unless the location is very hot (tropics) or very cold
(North, South poles.)”
Table IV lists the direct quotes given as reasons for selecting their most important and least important selections. Not every participant filled out this part of the form. The participants expressed clear concise reasons for what they consider to be important, but were sometime vague or completely “off base” about what they considered to unimportant. One participant noted that his -5 selection “was left over.” Another commented, “Who cares?” One considered “location” to be geographical rather than pertaining to the working environment of a factory or office.
The participants paid little attention to that which they saw as unimportant.
DISCUSSION AND CONCLUSIONS
One of the advantages of qualitative methods is that everything that occurs becomes data. During the initial development of the concourse it was noticeable that the participants did not include any non-technical elements even after a discussion of the role subjectivity plays in machine designing. They gave non-technical issues consideration only after this absence was brought to their attention and they were asked to consider it. One can conclude that these issues are not important to the participants, but it can also be argued that they are not asked to consider subjective non-technical concerns during their education as engineering technology students. The same holds true for the ABET guidelines. They were never introduced during the concourse and only quality was included in any of the factors.
In response to the core research questions:
Students do not view subjective non-technical issues to be meaningful or important parts of the machine designing process. They do, however, care about satisfying customers (people) and safety (protecting people).
Engineering technology students do not generally consider subjective, non-technical issues.
When asked how they felt about the study they expressed that they enjoyed it and would give more consideration to the subjective sides of machine designing in the future. The implication is that they will probably slowly grow into this understanding rather than quickly adopt it.
RECOMMENDATIONS
Most noteworthy was the reluctance to include subjective non-technical elements at even minimal levels. This may very well be because only the linear, analytical, deterministic aspects of machine designing is taught in class or stressed in professional engineering environments. Students seem to have the most trouble with assignments that require “out-of-box,” indeterminate thinking and with assignments in which different “right” answers are equally acceptable.
Our students respond in kind to what we teach and the way we teach. As instructors we will have to teach problem solving, critical thinking, acceptance of multiple solutions, satisficing instead of optimizing, and the inclusion of subjectivity as integral parts of the designing process. Before that we have to accept and understand these concepts ourselves.
ACKNOWLEDGMENT
I acknowledge Dr. Steven Brown for his vast knowledge of Q methodology and for making it available to all that seek it, and Dr. Susan Ramlo for introducing me to Q methodology.
REFERENCES
1. Jonassen, D. H., “Instructional Design as Design Problem Solving:
An Interactive Process”, Educational Technology, May-June 2008, pp. 21-26.
2. Jonassen, D. H.,”A Taxonomy of Meaningful Learning”, Educational
Technology, September-October 2007, pp,30-35.
3. Brown, S. R., “A Q Methodological Tutorial”, Operant Subjectivity,
Vol. No. 16, 1993, pp. 91-138.
4. Stephenson, William, "Newton‟s Fifth Rule and Q Methodology", American Psychologist, Vol. No. 35, 1980, pp. 882-889.
5. Brown, S. R., Political Subjectivity: Applications of Q Methodology in Political Science, 1980, pp. 183-263.
6. Cottle, C. E., McKeown, B., “The Forced-Free Distribution in the Q Technique: A Note on Unused Categories in the Q Sort Continuum”, Operant Subjectivity, Vol. No 3, 1980, pp. 58-63.
7. Schmolck, P., “PQMethod Manual”, distributed with PQMethod
program, last updated November 2002.
AUTHOR INFORMATION
Roland Arter, Associate Professor, The University of Akron, Summit College, Department of Engineering and Science Technology, Akron, OH, 43235, [email protected].