Journal of Sports Medicine and Allied Health Sciences: Official
Journal of Sports Medicine and Allied Health Sciences: Official
Journal of the Ohio Athletic Trainers Association
Journal of the Ohio Athletic Trainers Association
Volume 5
Issue 2 JSMAHS Fall Issue 2019 Article 7
July 2019
Prediction modeling for Board of Certification exam success for a
Prediction modeling for Board of Certification exam success for a
professional master’s athletic training program
professional master’s athletic training program
Scott L. BruceArkansas State University - Main Campus, [email protected] Elizabeth K. Crawford
University of Tennessee at Chattanooga, [email protected] Gary B. Wilkerson
University of Tennessee at Chattanooga, [email protected] R. Barry Dale
University of South Alabama, [email protected] Martina Harris
Chattanooga State University, [email protected]
See next page for additional authors
Follow this and additional works at: https://scholarworks.bgsu.edu/jsmahs
Part of the Biomechanics Commons, Exercise Science Commons, Motor Control Commons, Other Kinesiology Commons, Rehabilitation and Therapy Commons, Sports Medicine Commons, and the Sports Sciences Commons
Recommended Citation Recommended Citation
Bruce, Scott L.; Crawford, Elizabeth K.; Wilkerson, Gary B.; Dale, R. Barry; Harris, Martina; and Rausch, David W. (2019) "Prediction modeling for Board of Certification exam success for a professional master’s athletic training program," Journal of Sports Medicine and Allied Health Sciences: Official Journal of the Ohio Athletic Trainers Association: Vol. 5 : Iss. 2 , Article 7.
DOI: 10.25035/jsmahs.05.02.07
Available at: https://scholarworks.bgsu.edu/jsmahs/vol5/iss2/7
This Article is brought to you for free and open access by the Journals at ScholarWorks@BGSU. It has been accepted for inclusion in Journal of Sports Medicine and Allied Health Sciences: Official Journal of the Ohio Athletic Trainers Association by an authorized editor of ScholarWorks@BGSU.
Prediction modeling for Board of Certification exam success for a professional Prediction modeling for Board of Certification exam success for a professional master’s athletic training program
master’s athletic training program Cover Page Footnote
Cover Page Footnote N/A
Authors Authors
Scott L. Bruce, Elizabeth K. Crawford, Gary B. Wilkerson, R. Barry Dale, Martina Harris, and David W. Rausch
This article is available in Journal of Sports Medicine and Allied Health Sciences: Official Journal of the Ohio Athletic Trainers Association: https://scholarworks.bgsu.edu/jsmahs/vol5/iss2/7
Prediction Modeling for Board of Certification Exam Success for a Professional Master’s Athletic Training Program
Scott L. Bruce EdD, ATC*; Elizabeth K. Crawford EdD‡; Gary B. Wilkerson EdD, ATC, FNATA‡;
R. Barry Dale PhD, ATC, DPT£; Martina Harris EdD€; David W. Rausch PhD‡
*Arkansas State University- Main Campus; ‡University of Tennessee at Chattanooga; £University of
South Alabama; €Chattanooga State University
Introduction: The Commission on Accreditation of Athletic Training Education mandates accredited athletic training programs have a minimum, three-year aggregate, first-attempt pass rate on the Board of Certification (BOC) examination of 70%. No studies have examined first-attempt BOC exam success for students enrolled in a professional master’s athletic training program (PMATP). Purpose: The purpose of this study was to identify factors associated with first-attempt success on the BOC examination for PMATP students. Methods: This cohort designed study used common application data from subjects’ university and PMATP applications to create prediction models to identify those factors that predict first-attempt success on the BOC exam. Results: A four-factor model was produced to predict first-attempt BOC exam success. Both models demonstrated a student with two, three or more predictors had an odds ratio of 16.0 or greater, a relative frequency of success of 1.45 or greater, and correctly predicted first-attempt success on the BOC exam over 92% of the time. Conclusions: It is possible to predict success on the BOC exam for students from a PMATP based on common application data. Recommendations: Although this project involved predicting success on the athletic training certification exam, the procedures and methods used could be adapted to any academic program. Key Words: odds ratio, Relative Frequency of Success, Bayesian analysis, GRE, BOC exam, first-attempt success
_________________________________________________________________________________________________________________
INTRODUCTION
The culmination of a student’s athletic training education is to become eligible to take and pass the BOC exam on their first-attempt. A new accreditation standard in 2013 by the Commission on Accreditation of Athletic Training Education (CAATE) states all programs must publish student outcome data on their web site home pages.1 This includes
the number of students graduating from the program who took the BOC exam, the percentage of students who have passed the exam on the first-attempt, and the number of students who ultimately passed the exam, regardless of the number of attempts. According to CAATE, programs that do not have a three-year aggregate first-time pass rate ≥ 70% are said to be “in non-compliance.”1 Thus, passing the BOC exam on
the first-attempt is the program outcome of primary importance.
The use of prediction modeling has utility for admission decisions for health care professions and for estimating success on a profession’s licensure or board exam since the outcome is dichotomous: (admitted to the program or not admitted to the program; passage of the exam or not passing the exam). Medical professions have a board certification or licensure examination process which candidates must pass to become eligible to practice their chosen profession. Graduates become eligible to sit for these credentialing exams upon completion of their education. The primary purpose of these exams is to determine the entry-level competence of the candidate and to protect the health and welfare of the general public.2-5 Several
professions or medical specialties such as: athletic training, gynecology, medicine, nurse anesthetists, obstetrics, occupational therapy, physical therapy, and surgery have tried to create their own prediction models for passing their certification/licensure exams
with varied success.6-13 Multiple predictors
have been used by health/medical professions in their attempt to identify variables for success on their credentialing exams. Some of these predictors included: communication skills, ethnicity, gender, Graduate Record Exam (GRE) results, motivation, past academic performance, personal interview performance, personality types, previous years of experience, race, reference checks and undergraduate grade point average (uGPA).6-13 In athletic training, there have
been nine studies attempting to predict success on the Board of Certification (BOC) examination with only limited success.14-22
The predictors used in the athletic training studies to predict first-attempt success on the BOC exam included: ACT scores, athletic training-related GPA, clinical experience (both the number of hours accumulated and types of experiences), gender, graduate GPA (gGPA) at the end of the first-year in the PMATP, learning styles, preparatory academic coursework, and uGPA.14-22
Validity of the GRE has been established by several sources. Burton and Wang examined 21 graduate departments across seven different institutions. They established the use of the GRE with uGPA to determine ratings by faculty members, the student’s first-year gGPA, and the final overall gGPA.23 Kuncel and
his colleagues conducted three different studies regarding the GRE.24-26 A 2001
meta-analysis by Kuncel and Hezlett examined the ability of the GRE and uGPA to predict first year gGPA, faculty ratings, degree attainment, and scholarly productivity.25 They also used
the GRE to predict success on several standardized tests across several medical professions. Kuncel and Hezlett concluded that all standardized exams were able to predict success on the student’s licensing exam, faculty ratings, research productivity, completion of their degree, their overall gGPA and first-year gGPA.24 A third meta-analysis
studied the ability of the GRE to predict first-year gGPA, overall gGPA, and faculty ratings in both master’s degree programs and doctoral
programs.26 The authors examined over 100
studies that included a combination of 1000 students and found the GRE to be very predictive of the predictor variables.26
There are two main statistical schools of thought: frequentist and Bayesian. Both methods explore probability, but the theories and the methods are different.27 The Bayesian
approach to probability is to “measure the degree of belief in an event, given the information available.”27 The focus is on the
individual’s “state of knowledge” rather than a “sequence of events.”27 The frequentist
approach to probability interprets it as “a long-run frequency of a ‘repeatable’ event.” With a frequentist’s approach “probability would be a measurable frequency of events determined from repeated experiments.” 27
In the frequentist’s world, the data are generated by repeating the experiment on a random sample (providing the frequency of an event). The basic limitations remain the same during the application of the repeatable experiment; therefore, the parameters are constant. In the Bayesian’s world the data are gathered from an observed cohort. The parameters are unspecified, and are described in terms of the likelihood of an event occurring or not occurring; therefore, the data are fixed.28 Bayesian philosophy is about
observing the “association between the exposure and the outcome.”29
In the nine studies attempting to predict success on students’ first-attempt taking the BOC examination there were two commonalities: they examined undergraduate athletic training programs and they used frequentist statistics in their analysis.14-22
The most commonly used frequentist type statistics were correlations and linear and multiple regression.16,18,20,30,31 Other
frequentist statistics used were chi-squared, multiple discriminant analysis, two-way ANOVA, and t-tests.16,17,20,21 None of the
authors from these nine studies used Bayesian statistical analysis for their research.
A new accreditation standard in 2013 by the Commission on Accreditation of Athletic Training Education (CAATE) stated all programs must publish student outcome data on their web site home pages. This is to include the “number of students graduating from the program who took the examination, number and percentage of students who passed the examination on the first attempt, and overall number and percentage of students who passed the examination regardless of the number of attempts.”32 The
impetus for this study came about because of the CAATE mandates and an absence in the literature of a prediction model utilizing Bayesian statistics; therefore, the purpose of this study was to identify program applicant characteristics (the exposures) that are most likely to predict first-attempt success on the BOC exam within the professional master’s athletic training programs (PMATP) (the outcome). This study may serve to identify methods to aid in the selection of potential students for athletic training education programs, thus, improving the success for first-attempt passing of the BOC exam for students from a PMATP.
METHODS
A cohort study design was used for this study. The cohort was comprised of students admitted to a PMATP from 2004-2013. Potential predictor variables were identified through a mix of variables used by other medical professions, 8,11,20,33-35 and the past
experiences, beliefs, and hypotheses of the PMATP athletic training faculty members of the PMATP from which the cohort was taken. The lead author to this study was in charge of student recruitment for the PMATP and had noticed several trends and commonalities through the applications being received. Further discussions with PMATP faculty members led to investigating several other variables believed to be involved in student success. For example, the quality of the undergraduate institution and the research level of the undergraduate institution the student graduated from were thought to be
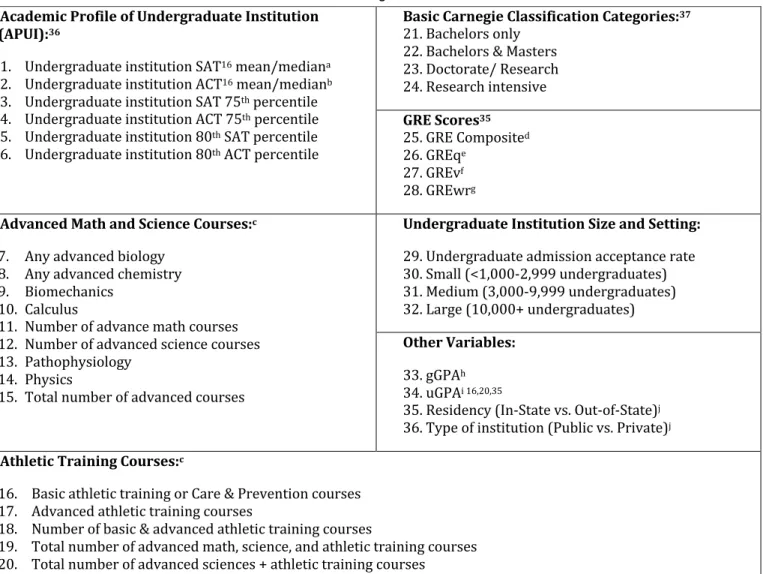
possible variables. Therefore, variables to examine these beliefs were created in an attempt to quantify the quality of undergraduate institutions and the research level of their undergraduate institution. A total of 36 variables were identified and investigated through univariable analyses. Each student’s degree granting undergraduate institution’s ACT and/or SAT mean or median scores were recorded from each institution’s reported ACT and SAT scores from their Common Data Set for the most recent academic year’s available data.36
Some schools reported only the mean for the SAT or ACT. Other schools reported the median for the SAT or ACT. Yet, some of the institutions reported both the mean and the median for the SAT or ACT. We then determined the cut-points through Receiver Operating Characterist (ROC) curve analysis for the mean of the SAT, the median of the SAT, the mean of the ACT, and the median of the ACT. The cut-points for the means and the medians were very close and we averaged these two scores together to arrive at the SAT mean-median or the ACT mean-median. We then coded one (1) if the SAT mean-median or the ACT mean-median value was greater than or equal to the cut-point or zero (0) if their score was less than the cut-point. We then summed these values, and recoded once again, one if the sum was at one or two, and zero if the sum was zero. This “new” nominal variable became the Academic Profile of Undergraduate Institutions (APUI) and was the first of two created variables for this study. The second variable we created was to determine if students’ undergraduate institution was classified as research intensive using the Carnegie Classification system.37 Each degree granting
college/university’s classification was determined and then dichotomized based on their “research-intensive” categorization: research intensive schools were coded as a “1”; all others were coded as “0”. This nominal variable was called “Research Classification”.
From students’ undergraduate transcripts, we recorded advanced coursework, which was separated into two different categories: Advanced Math and Science and Number of Athletic Training (AT) Courses. Advance math courses were determined to be calculus or higher, or advanced science course were defined as courses above initial Biology or Chemistry courses or any physics courses taken. In order for us to count the course, the student had to have earned a “C” or higher. Students were also given credit for taking any standard athletic training related course as an undergraduate. These included care and prevention of injury courses, basic athletic training courses, biomechanics, injury assessment, therapeutic exercise or exercise prescription. Students had to have earned a “C” or higher to receive credit for having taken these courses.
Univariable examinations of the 36 original potential predictors utilized ROC analyses to identify cut-points for dichotomization of potential predictors of first-attempt BOC exam success (Table 1). Youden’s Index distinguished the best balance between sensitivity (Sn) and specificity (Sp) to identify each predictor’s cut-point through the
equation (sum of [Sn + Sp – 1]).38 Predictor
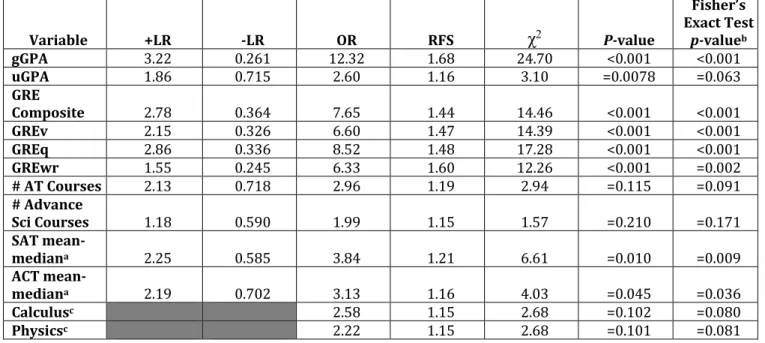
data were then coded: one (1) if the predictor value was greater than or equal to the cut-point and zero (0) if they were less than the cut-point. To assess each predictor for inclusion in multivariable analysis, 2x2 cross-tabulation analyses were used to calculate and comparisons among predictors were made examining the Sn, Sp, positive likelihood ratio (+LR), negative likelihood ratio (–LR), odds ratio (OR) and Relative Frequency of Success (RFS). The RFS for admission to the PMATP is similar to relative risk, but since risk is not an appropriate term for a study examining success, the RFS was created. We adapted the relative risk definition by Portney and Watkins; thus, the RFS indicates the proportion of those classified vs. those who have not met the criteria.39 Predictors with a
univariable OR of ≥ 2.0 or Fisher’s Exact Test
(one-sided) p-value of ≤ 0.20 were retained for multivariable analyses.39,40 The p-value of
≤ 0.20 was selected since the purpose was not to determine statistical significance for the predictor variables, but to screen variables for their potential predictive value, the alpha level was set at 0.20.41-43
Multicollinearity analyses were performed on those variables advanced from the univariable to the multivariable analysis to examine for potential overlap among predictors resulting in the production of Variance Inflation Factor (VIF) and tolerance values. Originally the continuous and multi-level discreet variables were assessed for multicollinearity. If the VIF values approximated 10 or above, or tolerance values approached 0.1 or less, this indicated multicollinearity, and the variable was eliminated from further analyses.44-46
The remaining continuous/multi-level discreet variables were dichotomized based on their cut-points determined from the ROC curve analysis, and combined with other additional nominal variables and the multicollinearity analysis was repeated. These predictors were entered into a logistic regression to produce the best set of potential factors. Students were then coded zero if they did not meet the cut-point for the predictor, or one if they had a value of greater than or equal to the predictor’s cut-point. The number of positive factors each student possessed were summed and ROC analysis was performed to determine the best balance between Sn and Sp for the optimum number of positive factors. A 2x2 cross-tabulations table to calculate Sn, Sp, +LR, -LR, OR and RFS for the derived prediction model was produced.44-46
An interaction effect exists when the odds ratios are not constant, or heterogeneous, between strata.40 Interactions between the
predictive variables were assessed for first-attempt BOC exam success across the strata for each pair of factors. The combination of predictive variables can have a greater (additive or multiplicative) effect, or lesser effect than a single variable.40,47
Table 1. Potential Predictor Variables Analyzed as Potential Predictors of First-Attempt Success on the BOC Exam. (aSAT mean-median [mean or median score on the SAT of the students entering the college or university as reported through the
institution’s participation in the Common Date Set Imitative]; bACT [mean-median [mean or median score on the ACT of the students
entering the college or university as reported through the institution’s participation in the Common Date Set Imitative]; cCourses taken
as an undergraduate listed on transcript; dGRE composite score; eGRE quantitative score; fGRE verbal score; gGRE analytic writing; hGraduate Grade Point Average at the end of the 1st year in the GATP; iUndergradaute Grade Point Average; jTaken from student
transcript) *Note: the SAT and ACT mean-median scores were used to develop Academic Profile of Undergraduate Institution.
We examined each combination of predictors three ways. First by 2x2 cross-tabulation analysis of two-factor combinations (Sn, Sp, +LR, -LR, OR, RFS and Fisher’s Exact Test). The second method used was through stratified analysis of the potential interactions. Thirdly, interaction effects were assessed through stratum-specific ORs and were compared to the Mantel-Haenszel (M-H) OR estimate (ORest) and the Breslow-Day (B-D) chi-square test to confirm or reject homogeneity of the stratum-specific ORs.39,40
A common problem seen when stratifying the data is low cell counts, leading to unstable results and wide confidence intervals.40
Because the current stratifications were
already providing us with this effect, no further higher-order interaction terms were considered.
A post-hoc, power analysis was done using Openepi.com, (Atlanta, GA) power calculator entering information for a cohort study.48,49
For the purpose of calculating statistical power, the “exposed group” were those students who passed their BOC exam on their initial attempt, while the “non-exposed group” were those students who were not successful on their first attempt to pass the BOC exam. The calculated power for this study was 99.89%. This project received institutional review board consent.
Academic Profile of Undergraduate Institution (APUI):36
1. Undergraduate institution SAT16 mean/mediana
2. Undergraduate institution ACT16 mean/medianb
3. Undergraduate institution SAT 75th percentile
4. Undergraduate institution ACT 75th percentile
5. Undergraduate institution 80th SAT percentile
6. Undergraduate institution 80th ACT percentile
Basic Carnegie Classification Categories:37 21. Bachelors only
22. Bachelors & Masters 23. Doctorate/ Research 24. Research intensive GRE Scores35 25. GRE Composited 26. GREqe 27. GREvf 28. GREwrg Advanced Math and Science Courses:c
7. Any advanced biology 8. Any advanced chemistry 9. Biomechanics
10. Calculus
11. Number of advance math courses 12. Number of advanced science courses 13. Pathophysiology
14. Physics
15. Total number of advanced courses
Undergraduate Institution Size and Setting:
29. Undergraduate admission acceptance rate 30. Small (<1,000-2,999 undergraduates) 31. Medium (3,000-9,999 undergraduates) 32. Large (10,000+ undergraduates) Other Variables: 33. gGPAh 34. uGPAi 16,20,35
35. Residency (In-State vs. Out-of-State)j
36. Type of institution (Public vs. Private)j Athletic Training Courses:c
16. Basic athletic training or Care & Prevention courses 17. Advanced athletic training courses
18. Number of basic & advanced athletic training courses
19. Total number of advanced math, science, and athletic training courses 20. Total number of advanced sciences + athletic training courses
RESULTS
The cohort for this study were students who graduated from a PMATP at a public, NCAA Football Championship Subdivision size university located in the southeastern United States. The institution is classified as a “medium four-year, primarily residential” metropolitan university with a Carnegie Classification as a “Doctoral, STEM dominate,” research university.37 The PMATP studied
lasted for two years plus one summer session. The average class size was 13.3 (±4.74) students and the PMATP had four faculty members for an average athletic training student to faculty ratio of 3.3:1 per class or 6.7 students to one faculty member per academic year. The students earned their clinical experiences at 15 different sites with approximately 32 different preceptors. Most clinical sites hosted only one athletic training student per clinical rotation period, but occasionally there were multiple students assigned to a site (i.e., university football team).
There were 371 applicants to the PMATP, and 181 students were offered a position in the program. Thirty-seven students rejected the offer and decided to attend a different PMATP. Twelve students either dropped out or were counseled out of the program. Records of 15 students were incomplete and were excluded from the study. The remaining 117 students formed the cohort for this retrospective analysis, (27 male; 90 female).
A large majority of the students were classified as from out-of-state (89/117 = 76.1%), and came from 24 different states. Only 6.8% (8/117) of the students earned their undergraduate degree at the university used in this study. The overwhelming percentage of students came to the PMATP directly from their undergraduate studies (107/117 = 91.5%). Two-thirds (78/117 = 66.7%) of the students earned undergraduate degrees from a public university. Of the 117 participants in this record review, 89 students
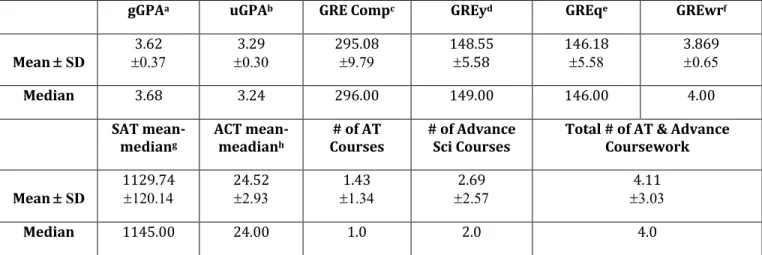
(76.6%) took at least one advanced math or science course. Calculus was the most frequently taken advanced math or science course (44/98 = 44.9%). Approximately two-thirds of the students took a care and prevention of athletic injuries and/or a biomechanics course, (32.8% and 33.6% respectfully). Descriptive statistics for the sample on the continuous and multi-level discrete variables that were progressed to the multiple variable analyses are provided in Table 2.
Univariable analysis reduced the original number of 36 variables to 11. A summary of the related statistics of the 11 variables that progressed from the univariable analysis to the multi-variable analysis is provided in Table 3. (ACT and SAT mean/median scores were viewed as separate variables at this point in the analysis. These two variables were combined to form the APUI for the nominal multicollinearity analysis; therefore, 10 variables progressed to the multicollinearity assessment.) Only one predictor, GRE – Composite score, had a VIF value of over 10 and tolerance values ≤ 0.1, and it was eliminated from further analysis. The remaining continuous/multi-level discrete variables included: gGPA at the end of the first year, GRE – quantitative score (GREq), GRE – verbal score (GREv), GRE – written score (GREwr), the Number of Advanced Math and Science courses taken as an undergraduate student, the Number of Athletic Training (AT) courses taken as an undergraduate student. The seven variables were dichotomized and were added to the APUI (combination of SAT and ATC scores) and if the student took physics or calculus as an undergraduate were then assessed for multicollinearity (ANOVA = 4.85(10); p = 0.001).44-46
gGPAa uGPAb GRE Compc GREyd GREqe GREwrf Mean ± SD 3.62 ±0.37 3.29 ±0.30 295.08 ±9.79 148.55 ±5.58 146.18 ±5.58 3.869 ±0.65 Median 3.68 3.24 296.00 149.00 146.00 4.00 SAT mean-mediang ACT mean-meadianh # of AT
Courses # of Advance Sci Courses Total # of AT & Advance Coursework Mean ± SD 1129.74 ±120.14 24.52 ±2.93 1.43 ±1.34 2.69 ±2.57 4.11 ±3.03 Median 1145.00 24.00 1.0 2.0 4.0
Table 2. Descriptive Statistics for Continuous and Multi-level Discrete Variables(a Graduate GPAat the end of the 1st
year in the GATP; b Undergraduate GPA; c GRE composite score; d GRE verbal score; e GRE quantitative score; f GRE analytical writing; g
SAT mean-median [mean or median score on the SAT of the students entering the college or university as reported through the institution’s participation in the Common Date Set Initiative]; h ACT mean-median [mean or median score on the SAT of the students entering the
college or university as reported through the institution’s participation in the Common Date Set Initiative]; i Number of [undergraduate]
athletic training courses; j Number of [undergraduate] advanced science coursework; k Total number of [undergraduate] athletic training
and advanced coursework; *Note: The SAT and ACT mean-median scores were used to help develop the Academic Profile of Undergraduate Institution)
Variable Cut-point Sn 1-Sp Sp Youden’s Index AUC
gGPA 3.44 0.800 0.250 0.750 0.551 0.551 uGPA 3.30 0.464 0.250 0.750 0.214 0.577 GRE Composite 290.5 0.732 0.263 0.737 0.469 0.789 GREv 145.5 0.794 0.368 0.632 0.426 0.745 GREq 143.5 0.753 0.263 0.737 0.490 0.796 GREwr 3.25 0.897 0.579 0.421 0.318 0.609 # AT Courses 1.50 0.385 0.200 0.800 0.185 0.597 # Advance Sci Courses 0.50 0.823 0.700 0.300 0.123 0.531 SAT mean-mediana 1112.5 0.558 0.250 0.750 0.308 0.643 ACT mean-mediana 24.5 0.504 0.250 0.750 0.254 0.646 Calculusc 0.380 0.810 Physicsc 0.580 0.620
Table 3. Part One. Summary of Univariable Results for Potential Predictor Variables of First-Attempt BOC Exam Success (Sn = Sensitivity; 1 - Sp = 1 – Specificity; Sp = Specificity; AUC = Area Under the Curve; gGPA = Graduate GPA at the end of the first year in the PMATP; uGPA = Undergraduate GPA; GREq = GRE quantitative section; GREv = GRE verbal section; GREwr = GRE analytical writing section; SAT = Scholastic Aptitude Test; ACT = American College Testing; a Univariable analysis was performed
on the SAT and ACT mean-median separately. Univariable Analysis of ACT and SAT combined APUI; b Fisher's Exact Test (one-sided) p
≤ 0.20; c These variables were dichotomized as either the student took the class as an undergraduate or they did not take the course as
Variable +LR -LR OR RFS χ2 P-value Fisher’s Exact Test p-valueb gGPA 3.22 0.261 12.32 1.68 24.70 <0.001 <0.001 uGPA 1.86 0.715 2.60 1.16 3.10 =0.0078 =0.063 GRE Composite 2.78 0.364 7.65 1.44 14.46 <0.001 <0.001 GREv 2.15 0.326 6.60 1.47 14.39 <0.001 <0.001 GREq 2.86 0.336 8.52 1.48 17.28 <0.001 <0.001 GREwr 1.55 0.245 6.33 1.60 12.26 <0.001 =0.002 # AT Courses 2.13 0.718 2.96 1.19 2.94 =0.115 =0.091 # Advance Sci Courses 1.18 0.590 1.99 1.15 1.57 =0.210 =0.171 SAT mean-mediana 2.25 0.585 3.84 1.21 6.61 =0.010 =0.009 ACT mean-mediana 2.19 0.702 3.13 1.16 4.03 =0.045 =0.036 Calculusc 2.58 1.15 2.68 =0.102 =0.080 Physicsc 2.22 1.15 2.68 =0.101 =0.081
Table 3. Cont. Summary of Univariable Results for Potential Predictor Variables of First-Attempt BOC Exam Success *Note: For further consideration a variable had to have an OR of ≥ 2.040 and a Fisher’s Exact Test (one-sided) p-value of ≤ 0.20 42,43,50 (+LR = Positive Likelihood Ratio; -LR = Negative Likelihood Ratio; OR = Odds Ratio; RFS = Relative Frequency of Success; χ2 =
Chi-square test; gGPA = Graduate GPA at the end of the first year in the PMATP; uGPA = Undergraduate GPA; GREq = GRE quantitative section; GREv = GRE verbal section; GREwr = GRE analytical writing section; SAT = Scholastic Aptitude Test; ACT = American College Testing; a Univariable analysis was performed on the SAT and ACT mean-median separately. Univariable Analysis of ACT and SAT
combined APUI; b Fisher's Exact Test (one-sided) p ≤ 0.20; c These variables were dichotomized as either the student took the class as an
undergraduate or they did not take the course as an undergraduate; therefore, no cut-points, 1-Sp, Youden’s Index or AUC data were generated)
Finding acceptable VIF and tolerance values for the dichotomized variables, all ten factors were entered into logistic regression (backward entry). This analysis yielded a four-factor model (gGPA, GREq, GREv, Number of AT Courses taken as an undergraduate student) to predict first-attempt BOC exam success. This model had a Nagelkerke R2 of 0.436. The Hosmer and
Lemeshow Test for Goodness-of-fit indicated good model fit (c2(7) = 1.28; p = 0.989). An
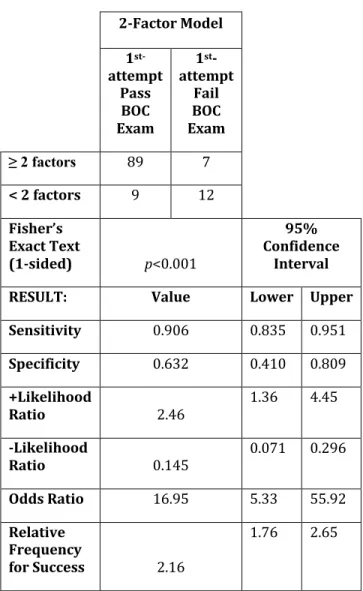
ROC analysis determined the optimum number of predictors found any combination of three or more predictors (Figure 1). To conduct the 2x2 cross-tabulation analysis participants were then coded “1” if they had three or more of the four factors and “0” if they possessed less than three factors. The outcome of this analysis found wide 95% confidence intervals (CI) (Table 4). A better choice by the 2x2 cross tabulation calculations was the two-factor model.
Figure 1. ROC analysis for three-factor and two-factor models with identified cut-point.
Any combination of two or more of the four factors improved the statistical parameters and provided tighter 95% CIs (Table 5). According to the two-factor model an athletic training student with two or more predictors has 16.95 times greater odds of passing the BOC exam on their first attempt compared to
a student with fewer than two factors. The RFS for first-attempt success on the BOC exam states that an athletic training student who possess two or more factors has slightly over twice the probability of passing the BOC exam on their first attempt compared to a student with fewer than two factors.
3-Factor Model 1st -attempt Pass BOC Exam 1st -attempt Fail BOC Exam ≥ 3 factors 2 < 3 factors 17 Fisher’s Exact Text (1-sided) p<0.001 95% Confidence Interval
RESULT 64 Lower Upper
Sensitivity 34 0.555 0.740 Specificity 0.895 0.696 0.971 +Likelihood Ratio 6.20 1.66 23.20 -Likelihood Ratio 0.388 0.284 0.530 Odds Ratio 16.00 3.49 73.38 Relative Frequency for Success 1.45 1.19 1.78
Table 4. Three-Factor Model for Predicting First-Attempt BOC Exam Success
2-Factor Model 1 st-attempt Pass BOC Exam 1st -attempt Fail BOC Exam ≥ 2 factors 89 7 < 2 factors 9 12 Fisher’s Exact Text (1-sided) p<0.001 95% Confidence Interval
RESULT: Value Lower Upper
Sensitivity 0.906 0.835 0.951 Specificity 0.632 0.410 0.809 +Likelihood Ratio 2.46 1.36 4.45 -Likelihood Ratio 0.145 0.071 0.296 Odds Ratio 16.95 5.33 55.92 Relative Frequency for Success 2.16 1.76 2.65
Table 5. Two-Factor Model for Predicting First-Attempt BOC Exam Success
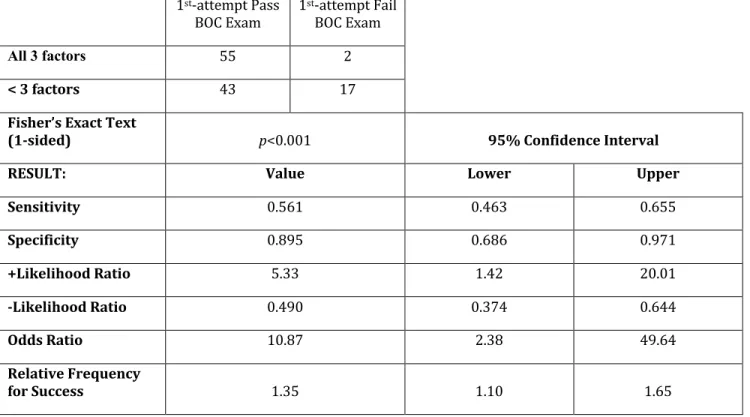
Based on the statistical parameters calculated from the 2x2 cross tabulation tables, we took the three strongest variables (gGPA, GREq, GREv) and ran a cross tabulation calculation for all three variables. A stong OR of 10.9 was found; however, the 95% CI for this ORs was found to be somewhat wide, (Table 6). We attribute this to the low cell count of “2” for an individual who possessed all three factors and passed the BOC exam on their first attempt.
1st-attempt Pass BOC Exam 1 st-attempt Fail BOC Exam All 3 factors 55 2 < 3 factors 43 17
Fisher’s Exact Text
(1-sided) p<0.001 95% Confidence Interval
RESULT: Value Lower Upper
Sensitivity 0.561 0.463 0.655 Specificity 0.895 0.686 0.971 +Likelihood Ratio 5.33 1.42 20.01 -Likelihood Ratio 0.490 0.374 0.644 Odds Ratio 10.87 2.38 49.64 Relative Frequency for Success 1.35 1.10 1.65
Table 6. Strongest Three-Factor for Predicting First-Attempt BOC Exam Success
The final task we performed was to pair each of the three strongest variables with each other (gGPA – GREv; gGPA – GREq; GREv – GREq). Our findings were that any pairing of the three strongest predictors produced
strong results across all parameters, although some of the 95% CIs were somewhat wide, none of the 95% CIs crossed the 1.0 threshold (Table 7). gGPA and GREv 95% Confidence Interval gGPA and GREq 95% Confidence Interval GREv and GREq 95% Confidence Interval
Lower Upper Lower Upper Lower Upper
Sna 0.660 0.561 0.746 0.639 0.540 0.728 0.639 0.540 0.728 Spb 0.850 0.640 0.948 0.850 0.640 0.948 0.789 0.567 0.915 +LRc 4.40 1.54 12.61 4.26 1.49 12.23 3.04 1.26 7.35 -LRd 0.400 0.287 0.558 0.424 0.307 0.586 0.457 0.321 0.650 ORe 10.99 3.00 40.22 10.04 2.75 36.67 6.64 2.05 21.58 RFSf 1.45 1.81 1.77 1.42 1.16 1.74 1.34 1.10 1.65 Fischer’s Exact Test p-value p< 0.001 p< 0.001 p< 0.001
Table 7. Results from 2x2 Cross Tabulations Table for Pairs of Three Strongest Predictors (95% CI) (a Sn =
Sensitivity; b Sp = Specificity; c +LR = Positive Likelihood Ratio; d –LR = Negative Likelihood Ratio; e OR = Odds Ratio; f RFS = Relative
The success rates for a given number of positive factors is presented in Table 8. For the 3-factor model, students possessing any combination of three of the four factors demonstrated a 97% (64/66) success rate on their initial attempt taking the BOC exam. For the 2-factor model, students possessing any
combination of two or more factors were successful 92.7% (89/96) of the time. Overall, regardless of the number of factors an athletic training student possessed, 83.8% of the students were successful on their first attempt taking the BOC exam.
1st-attempt BOX Exam Success
Percentage above/below cut-point
# of Factors Pass No Pass Total Percentage 2-factor Model 3-factor Model
0 2 7 9 22.2% 42.9% 66.7% 1 7 5 12 58.3% 2 25 5 30 83.3% 92.7% 3 44 2 46 95.7% 4 20 0 20 100.00% 97.0% Total 98 19 117 83.8%
Table 8. Specific Number of Factors for the Prediction of First-Attempt BOC Exam Success
Interaction.Effects
The difference between the univariable ORs and the multivariable adjusted ORs suggests an interaction between the stratifications of the factors for the prediction of first-attempt success on the BOC exam (Table 9). The interactions for the various factors as predictors of first-attempt success on the BOC exam are outlined in Table 10 and Figure 2 A-F. Several of the stratum specific ORs were < 2.0. Additionally, the majority of the lower limits of the 95% CIs were less than 1.0 rendering the result as invalid.40
The M-H ORest were >2.0, but again half of the lower limits of the 95% CI were <1.0. There were two interactions which were statistically significant for the M-H ORest: the “Stratified
analysis of GREv X gGPA as a predictor of 1st-attempt BOC exam” (4.99; [p = 0.026]) and the “Stratified analysis of GREq X gGPA as a predictor of 1st-attempt BOC exam” (5.53; [p
= 0.019]) The other four stratifications for the M-Hest ORs were not statistically significant. The B-D c2 test for homogeneity found the
odds ratios to not be significantly different for the various strata.
Univariable OR 95% CI Multivariable Adj. OR 95% CI
Lower Upper Lower Upper
gGPA 12.31 3.98 38.11 5.40 1.50 19.46
GREv 6.60 2.30 18.94 4.40 1.16 16.76
GREq 8.52 2.78 26.12 3.57 0.96 13.24
# of AT Courses 2.96 0.914 9.59 4.03 0.93 17.42
Table 9. Comparison of Odds Ratios for the Predictor Variables.*Note: The figures used are final multivariable adj OR
Prediction of GATP Success Strata ORs 95% Confidence Interval
Percent Students Successful on their 1st-attempt taking
the BOC exam
Lower Upper
Stratified analysis of GREva X
gGPAb as a predictor of
1st-attempt BOC exam
High gGPAb, High GREva –
3.05 0.465 19.98 95.5%
Low gGPAb, High GREva –
5.42 1.20 24.52 76.5%
Stratified analysis of GREqc X
gGPAb as a predictor of
1st-attempt BOC exam
High gGPAb, High GREqc –
2.58 0.397 16.79 95.4%
Low gGPAb, High GREqc –
8.25 1.43 47.58 84.6%
Stratified analysis of # AT courses taken X gGPAb as a
predictor of 1st-attempt BOC exam
High gGPAb, High Number
of AT courses – 2.42 0.257 22.68 96.7% Low gGPAb, High Number
of AT courses – 2.91 0.612 13.83 72.7% Stratified analysis of GREqc X
GREva as a predictor of
1st-attempt BOC exam
High GREva, High GREqc –
1.48 0.153 14.31 95.1%
Low GREva, High GREqc –
5.50 1.22 24.81 83.3%
Stratified analysis of # AT courses takend X GREva as a
predictor of 1st-attempt BOC exam
High GREva, High Number
of AT courses – 6.40 0.353 115.92 98.2% Low GREva, High Number
of AT courses – 1.83 0.429 7.84 73.3% Stratified analysis of # AT
courses takend X GREqc as a
predictor of 1st-attempt BOC exam
High GREqc, High Number
of AT courses – 5.36 0.287 100.28 98.3% High GREqc, High Number
of AT courses – 1.41 0.341 5.81 69.2%
Prediction of GATP Success M-H ORest 95% Confidence Interval M-H 2
Test B-D
2
Test
Lower Upper Stratified analysis of GREva X
gGPAb as a predictor of
1st-attempt BOC exam 4.45 1.39 14.21 (p =4.99; 0.026)
0.222; (p =
0.637) Stratified analysis of GREqc X
gGPAb as a predictor of
1st-attempt BOC exam 5.17 1.52 17.55 (p =5.53; 0.019)
0.820; (p =
0.365) Stratified analysis of # AT courses
takend X gGPAb as a predictor of
1st-attempt BOC exam 2.72 0.753 9.85 (p =1.59; 0.207)
0.018; (p =
0.894) Stratified analysis of GREqc X
GREva as a predictor of
1st-attempt BOC exam
3.83 1.18 12.42 (p =3.60; 0.058)
0.922; (p =
0.337) Stratified analysis of # AT courses
takend X GREva as a predictor of
1st-attempt BOC exam 3.24 0.837 12.54 (p =2.00; 0.157)
1.50; (p =
0.220) Stratified analysis of # AT
courses takend X GREqc as a
predictor of 1st-attempt BOC
exam 2.35 0.632 8.71 (p =9.52; 0.329)
1.51; (p =
0.216)
Table 10. Stratified Analysis of Different Levels for Association for Four Factors as Predictor or First-Attempt Success on BOC Exam.aGREv = GRE verbal score ³ 145.5; bgGPA = Graduate Grade Point Average at the end of the first year in
the PMATP ³ 3.44; cGREq = GRE quantitative score ³ 143.5; dNumber of AT courses taken = the number of Athletic Training related
Figure 2.A Figure 2.D
Figure 2.B Figure 2.E
Figure 2.C Figure 2.F
Figure 2A-2F Graphic Representations of Stratified Pairs of Dichotomized Variables for Prediction First-Attempt Success on BOC Exam
DISCUSSION
This study was constructed because of the 2013 change in the CAATE accreditation standards which require all PMATP to demonstrate a three-year aggregate first-time pass rate of 70%.51 Understandably,
professional athletic training education programs would desire objective methods to identify students who are most capable of learning and being successful, (i.e., passing the BOC exam on the first attempt or high-quality production of other program outcomes.)
The development for this study was based on those used for clinical prediction models related to predicting injury risk or the effectiveness of some treatment intervention.52-57 Several models were cited
in the professional medical literature, including nine athletic training related studies, attempting to determine criteria for success on their credentialing or licensing examinations. The nine athletic training studies were performed using undergraduate programs and frequentist statistics.14-22 Our
study is the second study to utilize clinical prediction techniques for an educational program.58
The use of the gGPA at the end of the first-year and GRE scores were logical predictors as the literature strongly supports their use for prediction of success.10,11,24 The use of
first-year gGPA was logical since the students from the PMATP used to form this cohort took the majority of their core athletic training courses during the students’ initial year in the program. Additionally, athletic training students are eligible to take the BOC exam in their final semester of academic preparation before their graduation and final grades are known.59 The GRE has been studied and
determined to be useful in making entrance decisions by many professions, including athletic training.60-69 The significant role the
GRE has in our prediction model by producing strong ORs, and meaningful RFS values, cannot be discounted.
The OR was the primary statistic which we focused upon for this study. The ratios identified were significant, but how does one compare ORs to each other? We used a cut-point of ³2.0 for the ORs for this study when determining if to advance a predictor variable from the univariable to the multivariable analysis. Wilkerson and Denegar provide a lower limit and classification of ORs when interpreting clinical research parameters. They suggest that 1.5 be the “credible lower limit for” the “association between prediction and outcome.”57 They also further provide
classification for ORs of as a small association of ³1.5, a moderate association of ³3.4, a large association of ³9.0 and a very large association of ³32.0. Examining the univariable analyses for the predictors examined in this study, a large OR association for gGPA (12.32) and moderate size OR associations for uGPA (2.60), all of the GRE scores (ranging from 6.33 to 8.52) and the SAT mean/median (3.84) (Table 3). An examination of the two-factor model and the three-factor model found a large OR
association (16.95 and 16.0 respectively). When examining the other associated ORs throughout the manuscript one finds mostly moderate associations between the predictor and the outcome of passing the BOC exam on the initial attempt. As the stratification of the combination of variables was calculated small cell frequencies caused the width of the 95% CIs to increase and the associated ORs to be split most evenly between small and moderate associations. Based on the ORs, regardless of the standard used to identify the size of the OR, our models and predictors were sizeable.
With injury or illness prediction models relative risk is often referred to as a stronger indicator for the association between the predictors and the outcome.70 As explained
previously, risk was not an appropriate term for a study about success; thus we created the Relative Frequency for Success, adapting the definition from relative risk to the RFS.39
Should one wish to focus on the RFS, an interpretation of the association between the predictor and the outcome is also available. A small association is a RFS of ³1.1, a moderate association is ³1.4, a large association is ³2.0, while a very large association is ³3.3.57 The
two-factor model has a large association for the RFS (1.45); similarly, the three-factor model has a large association RFS (2.16). The other RFS figures reported are split between small and moderate. Based on the RFS, regardless of the standard used to identify the size of the OR, our models and predictors were noteworthy.
Limitations
Because the Educational Testing Services (ETS) changed the scoring format in 2011, use of the GRE presented us with a challenge.71
Our data came from student applications from 2004 through 2012; consequently, we needed to standardize their GRE scores. Percentile ranks for the scores were provided by ETS along with a conversion table for both the old and new scoring systems. We used these percentile ranks and, in the end, converted all
scores to the new scoring system which is what was reflected in our outcomes.72
The use of clinical prediction modeling techniques used in medicine has some inherent limitations. The biggest drawback was that it is difficult to use sensitivity and specificity across different populations or even sub-groups within the sample. The sensitivity and specificity can vary greatly. Sensitivity and specificity also do not possess the ability in medicine to directly diagnose or interpret test results. They only give an indication of the probability of the condition being present or absent.73,74 Similarly, this
academic prediction model can only give an indication of the probability of first-attempt success on the BOC exam.
Future.Research
There are three major components to a prediction model. The first is to create the prediction model. The second step is to validate the model by applying it to a different population that is similar to which the rule was created. The final component is to conduct an impact analysis such as examining the economic effect the model has upon the associated population.30,42 This study only
created the prediction model to identify those factors which may give the best odds or probability for first-attempt success on the BOC exam. The next logical step is to validate the prediction model produced in this research. This can be accomplished one of two ways: apply it to other PMATP or combine these data with other like data from multiple PMATP and repeat the assessment. Future studies may include applying the steps of the prediction model to a different cohort, either in athletic training or some other health professions such as physical therapy, occupational therapy, nursing, etc. Examining the impact of this model also needs to be done. These studies could examine whether a change in behavior occurred, or outcomes were improved, or what potential financial impact upon students or the program might occur as a result of using academic prediction models.30,42
It is important to note that none of the procedures, methods, or information used to generate these prediction models is exclusive to athletic training or to only the PMATP utilized for this research. All of the information needed to repeat this type of study in another academic programs is available through standard data collection methods from schools’ application files. We acknowledge that the factors which may dictate success in one PMATP may not be the same factors for another program. Likewise, there may be different cut-points if the variables identified as the strongest for prediction differ from one program to another. In the absence of a large, multi-institutional study to represent a greater sample of the athletic training student population, or the validation of our specific model, one should not assume that the variables we found in this study to predict first-attempt success on the BOC exam would be exactly the same or possess the same magnitude of prediction power. However, what we have done is provide a blueprint on how to conduct this analysis in different PMATPs. Using the past academic data to develop an educational prediction model for athletic training students allows the faculty and administrators to be able to assess the readiness an individual might possess for graduate level work. The use of prediction models to aid in making data-informed decisions on prospective students and their potential for BOC exam success provides an objective method of assessment. Use of these types of prediction models is comparable to clinical decision-making guided by research evidence and represents educational leadership.
Conclusion
The prediction models provided in this manuscript offer an insight into how a PMATP might attempt to identify those students mostly likely to have success on their initial time attempt taking the BOC exam. We were able to identify those program applicant characteristics which were able to predict
which students are likely to pass the BOC exam on their first attempt. No study examining potential predictors of success on the BOC exam have been published in the athletic training related literature since 2003 and the results were mostly mixed and only examined undergraduate students. Our study is the first of its kind to utilize Bayesian techniques to provide solid objective data to determine who is likely to have first-attempt success on the BOC exam and aid PMATP in meeting the CAATE standard of a first-time pass rate of 70%.
REFERENCES
1.Commission on Accreditation of Athletic Training Education. Posting of outcomes. Becoming an athletic
trainer 2013; http://caate.occutrain.net/?s=pass+rate.
Accessed September 8, 2013.
2. Federation of State Boards of Physical Therapy. Welcome to the FSBPT website. 2012;
https://www.fsbpt.org/index.asp. Accessed June 10, 2012.
3. National Athletic Trainers’ Association Board of Certification Inc. BOC standards of professional
practice. 2006;
http://www.bocatc.org/images/stories/multiple_refe rences/standardsprofessionalpractice.pdf. Accessed June 10, 2012.
4. National Board for Certification in Occupational Therapy. Welcome. 2009; http://www.nbcot.org/. Accessed June 10, 2012.
5. United States Medical Licensing Examination. What is USMLE? 2012; http://www.usmle.org/. Accessed June 10, 2012.
6. Ferguson E, James D, Madeley L. Factors associated with success in medical school: systematic review of the literature. Brit Med J. 2002;324(7343):952-957.
https://doi.org/10.1136/bmj.324.7343.952
7. Zaglaniczny KL. Factors which predict performance on the National Certification Examination for Nurse Anesthetists. J Am Ass Nurs Anesth. 1992;60(6):533-540. http://ukpmc.ac.uk/abstract/MED/1292319 8. Armstrong A, Dahl C, Haffner W. Predictors of
performance on the National Board of Medical Examiners obstetrics and gynecology subject examination. Obstet Gynecol. 1998;91(6):1021-1022.
https://doi.org/10.1016/S0029-7844(98)00090-8
9. de Virgilio C, Yaghoubian A, Kaji A, et al. Predicting performance on the American Board of Surgery qualifying and certifying examinations: a multi-institutional study. Arch Surg. 2010;145(9):852-856.
https://doi.org/10.1001/archsurg.2010.177
10. Kosmahl EM. Factors related to physical therapist license examination scores. J Phys Ther Educ.
2005;19(2):52. https://doi.org/10.1097/00001416-200507000-00007
11. Utzman RR, Riddle DL, Jewell DV. Use of demographic and quantitative admissions data to predict academic difficulty among professional physical therapist students. Phys Ther. 2007;87(9):1164-1180.
12. Zadnik M, Lawson S, DeLany JV, Parente F, Archer KR. Analysis of Objective Factors Related to a Successful Outcome on the National Examination for Occupational Therapists. Rehabil Res Pol Educ. 2017;31(1):50-60. 13. Utzman RR, Riddle DL, Jewell DV. Use of demographic
and quantitative admissions data to predict performance on the National Physical Therapy Examination. Phys Ther. 2007;87(9):1181-1193. 14. Draper DO. Students' learning styles compared with
their performance on the NATA certification exam. Athl
Train - J Nat Athl Train Assoc. 1989;24(3):234-235,
275.
15. Erickson MA, Martin M. Contributors to initial success on the National Athletic Trainers’ Association Board of Certification Examination as perceived by candidate sponsors: A delphi study. J Athl Training.
2000;35(2):134-138.
16. Harrelson GL, Gallaspy JB, Knight HV, Leaver-Dunn D. Predictors of success on the NATABOC certification examination. J Athl Training. 1997;32(4):323–327. 17. Hickman KM. Board of Certification examination
success and clinical education [Dissertation].
Blacksburg, VA: Curriculum and Instruction Virginia Polytechnic Institute and State University; 2010. 18. Turocy PS, Comfort RE, Perrin DH, Gieck JH. Clinical
experiences are not predictive of outcomes on the NATABOC examination. J Athl Training. 2000;35(1):70-75.
19. Williams RB, Hadfield OD. Attributes of curriculum athletic training programs related to the passing rate of first-time certification examinees. J Allied Heal.
2003;32(4):240-245.
http://ukpmc.ac.uk/abstract/MED/14714596 20. Middlemas DA, Manning JM, Gazzillo LM, Young J.
Predicting performance on the National Athletic Trainers' Association Board of Certification examination from grade point average and number of clinical hours. J Athl Training. 2001;36(2):136-140. 21. Pickard JV. An examination of the relationship between
the mentorship of student athletic trainers and their outcome on the National Athletic Trainers' Association
certification examination [Dissertation]. Huntsville, TX:
Department of Educational Leadership and Counseling, Sam Houston State University; 2003. 22. Starkey C, Henderson J. Performance on the athletic
training certification examination based on candidates' routes to eligibility. J Athl Training. 1995;30(1):59-62. 23. Burton NW, Wang Mm. Predicting long-term success in
graduate school: A collaborative validity study. ETS Res
Rep Ser. 2005;2005(1):i-61.
24. Kuncel NR, Hezlett SA. Standardized tests predict graduate students’ success. Science. 2007 315 1080-1081. https://doi.org/10.1126/science.1136618
25. Kuncel NR, Hezlett SA, Ones DS. A comprehensive meta-analysis of the predictive validity of the Graduate Record Examinations: Implications for graduate student selection and performance. Psychol Bull.
2001;127(1):162-181. https://doi.org/10.1037/0033-2909.127.1.162
26. Kuncel NR, Wee S, Serafin L, Hezlett SA. The validity of the Graduate Record Examination for master's and doctoral programs: A meta-analytic investigation. Educ
Psychol Meas. 2010;70(2):340-353. .
https://doi.org/10.1177/0013164409344508
27. Vallverdú J. The false dilemma: Bayesian vs. Frequentist. arXiv preprint arXiv:08040486. 2008. 28. Casella G. Refresher on Bayesian and frequentist
concepts: Models, assumptions, and inference. Amer Coll Clin Pharmacol; 2008; Philadelphia, PA.
29. Denegar CR, Wilkerson GW. Bridging the chasm between research & clinical practice in athletic training: A discussion of methods and analysis. Paper presented at: 2013 National Athletic Trainers' Association Educator's Conference; January 12, 2013; Dallas, TX.
30. Childs JD, Cleland JA. Development and application of clinical prediction rules to improve decision making in physical therapist practice. Phys Ther. 2006;86(1):122.
https://doi.org/10.1093/ptj/86.1.122
31. Starkey C. Reforming athletic training education. J Athl
Training. 1997;32(2):113-114.
32. Commission on Accreditation of Athletic Training Education. Standards for Accreditation of Professional
Athletic Training Programs. Austin, TX: Commission on
Accreditation of Athletic Training Education; December 4, 2015.
33. McClintock JC, Gravlee GP. Predicting success on the certification examinations of the American Board of Anesthesiology. Anesthesiology. 2010;112(1):212-219. doi: 210.1097/ALN.1090b1013e3181c1062e1092f
http://ukpmc.ac.uk/abstract/MED/20010419 34. Johnson SB. Examination review for 2009-10 testing
year: Board of Certification (BOC) certification
examination for athletic trainers. Princeton, NJ April 20
2010.
35. Vendrely AM. An investigation of the relationships among academic performance, clinical performance, critical thinking, and success on the physical therapy licensure examination. J Allied Health.
2007;36(2):e108-123.
http://ukpmc.ac.uk/abstract/MED/19759986 36. Common Data Set Initiative. Common daat set
2012-2013. 2012; http://www.commondataset.org/. Accessed July 14, 2013.
37. The Carnegie Foundation for the Advancement of Teaching. A classification of institutions of higher education: 2010 Edition. The Carnegie Foundation for
the Advancement of Teaching [Website database]. 2010;
http://classifications.carnegiefoundation.org/. Accessed July 13, 2013.
38. Ruopp MD, Perkins NJ, Whitcomb BW, Schisterman EF. Youden index and optimal cut-point estimated from
observations affected by a lower limit of detection.
Biometrical J. 2008;50(3):419-430.
https://doi.org/10.1002/bimj.200710415
39. Portney LG, Watkins MP. Foundations of clinical
research: Applications to practice. 2nd ed. Upper Saddle
River, NJ: Prentice Hall; 2000.
40. Hosmer DW, Lemeshow S. Applied logistic regression.
2nd ed. Hoboken, NJ: John Wiley & Sons, Inc.; 2000. 41. Teyhen DS, Flynn TW, Childs JD, Abraham LD.
Arthrokinematics in a subgroup of patients likely to benefit from a lumbar stabilization exercise program.
Physical Therapy. 2007;87(3):313-325.
42. Bruce SL, Wilkerson GB. Clinical prediction rules, part 1: Conceptual overview. Athlet Ther Today.
2010;15(2):4-9. https://doi.org/10.1123/att.15.2.4
43. Kuijpers T, van der Windt DAWM, Boeke AJP, et al. Clinical prediction rules for the prognosis of shoulder pain in general practice. Pain. 2006;120 (3):276-285.
https://doi.org/10.1016/j.pain.2005.11.004
44. Field A. Discovering statistics using SPSS. 3rd ed. Thousasnd Oaks, CA: SAGE Publications; 2009.
45. Mertler CA, Vannetta RA. Logistic regression. In: Adv
Multivar Statist Meth. 3rd ed. Los Angeles, CA: Pyrczak
Publishing; 2005:313-330.
46. Verhagen E, Van Mechelen W. Sports injury research. Vol 11. New York, NY: Oxford University Press; 2009. 47. Meeuwisse WH. Athletic injury etiology: distinguishing
between interaction and confounding. Clin J Sport Med.
1994;4(3):171-175.
48. Soe MM, Sulliva KM. Open Source Statistics for Public Health. Power Cohort Study 2010;
http://www.openepi.com/Power/PowerCohort.htm. Accessed July 2, 2013.
49. Dean AG, Sullivan KM, Soe MM. OpenEpi: Open Source Epidemiologic Statistics for Public Health, Version. 2013; 3.0: www.OpenEpi.com, . Accessed October 1, 2013.
50. Teyhen DS, Flynn TW, Childs JD, Abraham LD.
Arthrokinematics in a subgroup of patients likely to benefit from a lumbar stabilization exercise program.
Phys Ther. 2007;87(3):313-325.
https://doi.org/10.2522/ptj.20060253
51. Commission on Accreditation of Athletic Training Education. Becoming an athletic trainer. 2013;
http://caate.net/public/. Accessed December 4, 2015. 52. Cleland JA, Childs JD, Fritz JM, Whitman JM, Eberhart SL.
Development of a clinical prediction rule for guiding treatment of a subgroup of patients with neck pain: use of thoracic spine manipulation, exercise, and patient education. Phys Ther. 2007;87(1):9-23.
https://doi.org/10.2522/ptj.20060155
53. Flynn T, Fritz J, Whitman J, et al. A clinical prediction rule for classifying patients with low back pain who demonstrate short-term improvement with spinal manipulation. Spine. 2002;27(24):2835.
https://doi.org/10.1007/s00586-009-0909-9
54. Wilkerson GB, Giles JL, Seibel DK. Prediction of core and lower extremity strains and sprains in collegiate football players: a preliminary study. J Athl Training.