Title
Measuring the Burden of Indirect Taxation Including Consumption Tax in
Japan by Income Group
Author(s)
Uemura, Toshiyuki, 上村, 敏之; Adachi, Yoshimi, 足立, 泰美; Saitoh,
Yurie
Citation
Issue Date
URL
http://hdl.handle.net/10236/14233
Right
Kwansei Gakuin University Repository
DISCUSSION
PAPER
SERIES
Discussion paper No. 141
MEASURING THE BURDEN OF INDIRECT TAXATION
INCLUDING CONSUMPTION TAX IN JAPAN
BY INCOME GROUP
Toshiyuki Uemura
School of Economics, Kwansei Gakuin University
Yoshimi Adachi
Faculty of Economics, Konan University
Yurie Saitoh
School of Modern Management, Sugiyama Jogakuen University
March, 2016
SCHOOL OF ECONOMICS
KWANSEI
GAKUIN
UNIVERSITY
1-155 Uegahara Ichiban-cho Nishinomiya 662-8501, Japan
1
MEASURING THE BURDEN OF INDIRECT TAXATION
INCLUDING CONSUMPTION TAX IN JAPAN BY
INCOME GROUP
Toshiyuki Uemura, Kwansei Gakuin University
Yoshimi Adachi, Konan University
Yurie Saitoh, Sugiyama Jogakuen University
ABSTRACT
In the context of an aging population, a consumption tax was introduced in Japan as a means to secure financing for social security programs, and was raised on a number of occasions. While consumption taxes are regressive, excise taxes also place a burden on household finances. In this paper, we estimate the portion of income captured by consumption and excise taxes for different income groups, considering the proportion of the tax burden associated with excise taxes. The results indicate that regressivity is present for both consumption and excise taxes. In particular, indirect taxes on food are considered highly regressive, giving grounds for measures aimed at reducing the tax burden on low-income earners. Accordingly, we quantify the redistributive effects of several policy patterns aimed at lessening indirect tax burdens. For taxes on food, the redistributive effects of reduced taxes, zero rates of taxation, and tax refunds were not significant. This is because these measures lower the tax burden across all income groups and do not target low-income earners only. As a result, alleviating the regressivity of indirect taxes requires social security policies closely targeted at low-income earners.
1. INTRODUCTION
Since the cost of social security in Japan is rising due to an aging population and a low birthrate, an enormous quantity of long term public bonds have been issued in order to cope with the lack of funding for social security programs. As part of its efforts to reform and secure financial resources for social security, the Japanese government implemented a “Comprehensive Reform of Social Security and Tax,” thus raising the consumption tax.
Japan introduced the consumption tax as a value added tax in April 1989 in response to its aging society. This tax has increased from 3% in 1989 to 5% in April 1997, and to 8% in April 2014. A
2
further rate rise to 10% is planned for April 2017. While Japan’s current consumption tax rate includes both national and local consumption taxes, in this paper, “consumption tax” refers to these taxes taken together.
Consumption taxes are noted for their regressivity due to larger tax burdens incurred by lower income groups. Policy measures aimed at reducing this regressivity have been considered in the past, including reduced tax rates and zero taxes on food products, as well as tax refunds to lower income earners. As such, the Japanese government is planning to reduce food taxes once the consumption tax increases to 10%.
However, indirect taxation in Japan includes excise taxes in addition to the consumption tax. Figure 1 shows the burden of indirect taxes as a percentage of national income for a number of developed countries. As with the European VAT and American sales and use tax, the burden of excise taxes accounts for a considerable share of national income. According to Figure 1, in 2012, consumption tax accounted for a 3.7% share of national income (including local consumption tax). As the consumption tax rate in 2010 was 5%, calculations for a rate of 8% yield a share of around 5.92% of national income, while a 10% rate yields a share of around 7.4%. Nonetheless, the burden of consumption tax as a percentage of national income will decrease if reduced tax rates are applied to food products.
Figure 1. International comparison of consumption tax burden as percentage of national income
Source: Ministry of Finance, “Consumption taxes as percentage of national income” (National and local taxes), 2012; OECD, “Revenue Statistics 1965-2013” and “National Accounts.”
Japanese excise taxes account for 3.5% of national income. In other words, they account for a 0.7 1.9 0.7 10.1 (VAT) 5.4 2.8 1.6 0.8 9.5 (VAT) 4.6 1.8 (18.9) (7.1) (5.5) (14.9) (14.1) 0.1 0.3 0.3 0.4 13.7 (VAT) 5.1 1.2 2.7 0.5 (15.5) (Liquor) (I nd iv id ua l Ind ir ect T ax ) 2.2 0.8 0.8 2.4 (sales use tax) 3.0 2.3 9.3 (VAT) 5.6 DEU (2012) FRA (2012) 15.0 10.0 5.0 1.8 3.5 3.7 consumption tax (National & 1.1 1.3 0.7 0.0 20.0 (%) SWE (2012) JPN (FY2012) USA (2012) GBR (2012) (Tabacco) (Oil) (Other) 0.2 0.2
3
roughly similar share of national income to that of the consumption tax with a rate of 5%. The burden of excise taxes in Britain, Germany, France, and Sweden also accounts for an approximate 5% share of national income.
Accordingly, when considering the burden of indirect taxes on households, it is necessary to take into account the burden of excise taxes in addition to that of consumption ones. Any arguments on the regressivity of consumption taxes are bound to be inadequate if they fail to consider excise taxes. Previous studies attempting to estimate indirect tax burdens on households include those by Poterba (1991), Delfin et al. (2005), and André et al. (2010). Poterba (1991) investigates the regressivity of gasoline tax for households across different expenditure classes, showing that the burden of the gasoline tax as a share of total expenditure was less regressive than as a share of household income. Delfin et al. (2005) use a social accounting matrix to evaluate South African VAT and find that it was mildly regressive. They also consider an increase in VAT when zero tax rates were applied to daily necessities as a means to ameliorate regressivity and secure government revenues. André et al. (2010) analyzes the regressivity of indirect taxes (VAT and commodity taxes) by income group in five European countries (Belgium, Germany, Hungary, Ireland, and Britain). They conclude that these indirect taxes are regressive in relation to disposable income levels in each of the five countries.
Mirrlees et al. (2010, 2011) argue for consideration to be given to low-income earners in light of the acknowledged regressivity of the VAT, and provide proposals for British taxation reform following the Meade report. They also conclude that a more comprehensive and uniform system of indirect taxation, as well the application of a single VAT rate to a wide range of goods would be preferable.
Each of the studies mentioned found evidence for the regressivity of indirect taxes. While these studies analyze the burden on households of VAT, individual excise taxes or aggregated indirect taxes, they do not specifically measure the burden of all indirect taxation, including consumption and excise taxes.
Japanese studies that calculate indirect tax burdens on households include those by Hayashi and Hashimoto (1993), and Uemura (2006).1 Although they analyze the impacts of most typical indirect taxes on representative households, they do not measure indirect tax burden by income group. These measurements are essential in order to assess the degree of indirect tax regressivity.
Accordingly, this paper measures the burden of excise and consumption taxes by income group and explains the structure of indirect tax burdens inclusive of excise taxes in Japan.2 On this basis, we consider measures to ameliorate the regressivity of indirect taxes, including the consumption tax.
1
Uemura (2006) measures the tax burden on households for the commodity tax, an excise tax prior to the introduction of the consumption tax.
2
4
The paper is structured as follows: section 2 provides an overview of the regime of indirect taxes paid by Japanese households; section 3 estimates the burden of indirect taxes according to income group; section 4 evaluates the structure of the estimated indirect tax burden according to income group; section 5 considers the policy response to multiple tax rates debated in recent years, such as a lower or zero tax on food products; and conclusions and policy implications are given in section 6.
2. AN OVERVIEW OF INDIRECT TAXATION IN JAPAN
This section provides an overview of the system of indirect taxation in Japan and analyzes national and local taxes separately. Japan’s consumption tax was raised to 8% in April 2014, while the data used is prior to 2012. Hence, this study examines the system of indirect taxation as of 2012 with a consumption tax rate of 5%. As the purpose of this paper is to establish the burden of indirect taxation on households, subsections 2.1 and 2.2 present the indirect taxes paid by households.
2.1 NATIONAL INDIRECT TAXATION
First, the consumption tax was initially designed to be paid by households and is levied on transactions, with businesses paying at each stage of the commodity distribution process. The amount of tax payable is obtained by multiplying the tax rate by the amount of taxable sales and deducting the amount of tax paid at the time of purchase. Purchase tax deductions are carried out by using a books of accounts method that requires the keeping of accounts and the preservation of invoice amounts.
Between April 1997 and the end of March 2014, the local consumption tax was calculated by multiplying the local rate of 25% by the amount of payable consumption tax at the national rate; that is, the tax rate of 5% included the national consumption tax rate of 4% and the local tax converted rate of 1%. Since April 2014, the consumption tax was raised to 8%, which is comprised of a 6.3% national tax and a converted local tax rate of 1.7%.3
Two special consumption tax related measures aimed at small and medium sized businesses have been established in Japan: an exemption of tax liability and a simplified tax system. Under the tax exemption system, businesses with annual taxable sales of less than 10 million yen are not required to pay the consumption tax. Meanwhile, the simplified tax system is aimed at businesses with annual taxable sales of less than 50 million yen, whereby the input tax may be calculated by multiplying the deemed purchase rate by the tax on sales.4
3
From April 2017, the consumption tax will be set at 10%. This will be comprised of a national consumption tax rate of 7.8% plus a 2.2% local tax rate.
4
The deemed purchase rates are set at 90% for Type 1 Businesses (wholesalers), 80% for Type 2 Businesses (retailers), 70% for Type 3 Businesses (producers), 60% for Type 4 Business (other
5
Under the tax liability exemption system, when a tax liability is exempted, it creates a tax profit. Within the simplified tax system, where the deemed purchase rate is higher than the actual purchase rate, tax amounts to the difference between the two tax profits. Tax profits are considered legal business earnings, just as if they were profits, which the business would have to pay taxes for without any preferential treatment.
Nonetheless, compared to when the consumption tax was originally introduced, the scope of tax profits has been gradually reduced owing to the multiple adjustments carried out since then.5 In addition, Japan’s consumption tax is not applied to all goods and services, with some non-taxable transactions being specified.6
The second is the liquor tax, which is levied at different rates depending on the type of alcohol. For example, for every liter, a tax of 220 yen is payable for beer, 120 yen for sake rice wine, 200 yen for shochu sprits, 80 yen for wine, and 370 yen for whiskey. The tax rate on happoshu, a low-malt beer, differs according to the percentage of malt used, with a rate of 178.125 yen per liter of product containing between 25% and 50% malt, and 134.25 yen for one containing less than 25% malt. The third is the national tobacco tax. The tobacco tax is set as 106.04 yen per box of 20 cigarettes. In addition, a special tobacco surtax of 16.4 yen is levied.
The fourth are the various energy related indirect taxes. A gasoline tax is levied at a rate of 48.6 yen, and a local gasoline tax is levied at a rate of 5.2 yen per liter.7 A motor vehicle tonnage tax is collected at 5,000 yen per 0.5 tons of weight for passenger vehicles along with a promotion of power resources development tax of 400 yen per 1,000 kilowatt-hour of electricity sold.
2.2 LOCAL INDIRECT TAXATION
While many local indirect taxes were abolished with the introduction of the consumption tax in April 1989, some have remained.
The most representative local indirect taxes are the local tobacco taxes. A prefectural tobacco tax is levied at 21.48 yen, and a municipal one at 65.96 yen per box of 20 cigarettes. From April 2013, these rates were set at 17.2 yen and 105.24 yen, respectively.
A further local indirect tax is the automobile acquisition tax, which is levied at the point of
types) and 50% for Type 5 Businesses (service industry, etc.).
5
In principle, the consumption tax was not intended to be paid by businesses but by consumers. However, due to the circumstances surrounding its introduction, preferential measures were put in place for small to medium sized businesses.
6
Non-taxable transactions involve land, securities, interest on loans, postal stamps, revenue stamps, government administrative fees, services provided under the Health Insurance Act and Long-Term Care Insurance Act, services provided under the Social Welfare Services Act, midwifery services, burial or cremation charges, school fees at certain schools, school textbooks, and housing loans.
7
6
acquisition. This tax is set at 5% of the value of private vehicles, and 3% of the value of business vehicles, and a light oil delivery tax is levied at 32.1 yen per liter. In addition, there exists a golf course utilization tax with a standard rate of 800 yen per person per day, and a bathing tax of 150 yen per person per day.8
3.ESTIMATION OF INDIRECT TAX BURDENS BY INCOME GROUP
In this section, we describe the method used to estimate indirect tax burdens by income group. For estimation, we use data from the Statistics Bureau of the Ministry of Internal Affairs and
Communications, including the Family Income and Expenditure Survey (FIES), the National Survey of Family Income and Expenditure, the Population Census, Linked Input-Output Tables, the White Paper on Local Public Finance, and the National Tax Agency’s Annual Statistics Report. The estimation period covers the 12 years from 2001 to 2012.
Following the example of Hayashi and Hashimoto (1993), Murasawa et al. (2005), and Uemura (2006), the effective indirect tax rate, τij,against consumption expenditure item j for income group i
is measured using equation (1). Rijindicates the macro indirect tax revenue against consumption item
j of income group i. Cij indicates macro household consumption of consumption expenditure j of
income group i. A is an adjustment factor.
𝜏𝑖𝑖 =𝑅𝐶𝑖𝑖𝑖𝑖𝐴 (1)
“Consumption expenditure item” refers to the 10 major consumption items in FIES (j = 1, …, 10) and income groups are divided into the ten brackets in the same survey (I = 1, …, 10). Below, we explain the procedure followed in estimating the indirect tax burden rates according to income groups.
The indirect effective tax rate, τi, is based on the macro indirect tax revenue, Rij, from
consumption item j paid by income group i, divided by macro household consumption, Cij, of
consumption item j by income group i. As the data comes from sampling surveys, the difference between the figures for aggregated tax revenues derived from FIES and the actual macro tax revenues is problematic. Thus, we use the adjustment factor, A, as proposed by Murasawa et al. (2005).
Some excise taxes are paid by both households and businesses. By extracting the portion paid by households from the Linked Input-Output Tables, we estimate the amount paid by these. Additionally, from the estimated indirect effective tax rate, τij, we calculate the indirect tax contribution rates, bij
and Bi, in order to identify regressivity. In summary, the steps for estimating the indirect tax burden
8
Local governments independently levy a number of indirect taxes. These taxes vary widely in type and do not bring in significant revenues, and thus are not discussed in this paper.
7 are:
Step 1: Estimation of macro household consumption by income group
Step 2: Sorting of macro indirect tax revenues into 10 major consumption expenditure items Step 3: Estimation of household burden ratio
Step 4: Adjustment of indirect effective tax rate, τij, of consumption expenditures by income group
Step 5: Estimation of indirect tax burden rate by income group and consumption expenditure items.
bij, and indirect tax burden rate by income group, Bi.
First, we estimate macro household consumption, Cij, for consumption item j of income group i,
which is the denominator for the indirect tax effective tax rate in equation (1). “Consumption expenditures” and “yearly income” against each of the 10 major expenditure items are obtained from the “Yearly amount of expenditures and purchase frequency of commodities per household (total households)” within FIES. Consumption expenditures for each of the 10 major consumption items correspond to each of the individual consumption expenditure items within the definition of the effective indirect tax rate. Consumption expenditures by consumption item are as follows:
“Consumption expenditures” for income group i
= Food + Housing + Fuel, light and water charges + Furniture and household utensils + Clothing and footwear
+ Medical care + Transportation and communication + Education + Culture and recreation
+ Other consumption expenditures. (2)
The above consumption also includes some expenditure not subject to the consumption tax. Accordingly, these are captured as follows:
Consumption expenditures for income group i not subject to consumption tax = Rents for dwelling and land (housing) + Medical services (medical care)
+ School fees (education). (3)
The data obtained above are from calendar years, and have been converted to fiscal year data. For example, the 2001 fiscal year data is obtained by summing up three-quarters of the data from the 2001 calendar year and one-quarter of the data from the 2002 calendar year. The reason for this is that the revenue from indirect taxes is collected per financial year, not per calendar year. Data for monthly amounts is converted into annual amounts by multiplying it with 12.
8
Census. This census is carried out every five years, thus for each of the years for which there is no data the total number of households is estimated by linear interpolation across the estimation period of 2001-2012. As there is no data collected on the number of households in each income group, the total number of households obtained from the Population Census was divided into ten income groups.
Consequently, we estimate macro household consumption, Cij,according to consumption items in
each income group by multiplying household consumption data for each item and income group in each fiscal year, as obtained in FIES, by the total number of households in each income group obtained from the Population Census. This is the denominator of the effective indirect tax rate, τij,in
equation (1).
We subsequently estimate the macro indirect tax revenue, Rij, for each consumption item by
income group, which is the numerator of the indirect effective tax rate, τij,in equation (1). For
national taxes, we have used general and special accounts tax revenue data from the “Tax and stamp revenues” of the National Tax Agency Annual Statistics Report. For data on local taxes, we have used prefectural and municipal inhabitant taxes revenue data of the Ministry of Internal Affairs and Communications “White Paper on Local Public Finance”.
In order to measure the indirect tax burden according to consumption item and income group, we distribute macro indirect tax revenue data for each income group amongst the consumption
expenditure items. Revenues from indirect taxation are distributed proportionally across each consumption expenditure item and consumption tax applied to most goods and services is apportioned to consumption items by income group via shares, from which untaxed consumption expenditures from FIES have been deducted. Consumption share by income group is obtained by dividing household consumption data for each consumption item at each decile by household consumption data for each consumption item.
Table 1 shows at a glance how revenues from each indirect tax are apportioned across the 10 major consumption expenditure items.
The gasoline tax, local road tax, light oil delivery tax, promotion of power sources development tax, and the automobile acquisition tax are borne by both businesses and households. Thus, we have extracted the tax revenues from households by measuring the proportion of the indirect tax burden borne by households from the Linked Input-Output Tables. For details on how the proportion of household burden was measured, please refer to the addendum.
Hitherto, we have distributed indirect tax revenues across consumption expenditure items according to income group for the financial years 2001-2012. With macro consumption for each consumption item and income group, Cij, as denominator and the indirect tax revenues for each item
and income group as numerator, we calculate the unadjusted effective tax rates of indirect taxes. While macro consumption, the indirect tax effective rate denominator, is estimated using FIES
9
data, consumption data from this survey is known to be underestimated in comparison with macro consumption data.9 Accordingly, dividing the effective consumption tax rate, tN, derived from the
nominal tax rate by the estimated effective consumption tax rate, tE, gives adjustment factor A, which
is multiplied by the pre-adjusted effective indirect tax rate to obtain the effective indirect tax rate, τij.
In measuring adjustment factor A we refer to Murasawa et al. (2005).
A=𝑡𝑁
𝑡𝐸 (4)
Table 1. Indirect tax types and distribution of revenues among 10 major consumption expenditure items
Tax Distribution amongst 10 consumption items National Taxes
Consumption tax and local consumption tax Proportional distribution amongst 10 major consumption expenditure items via consumption shares by income group from which untaxed consumption from FIES is deducted
Liquor tax ‘Food’
Tobacco tax, special tobacco surtax ‘Other consumption expenditures’
Gasoline tax ‘Transportation and communication’, extracting household burden from Linked Input-Output Tables
Local road tax ‘Transportation and communication’, extracting household burden from Linked Input-Output Tables
Promotion of power resources development tax ‘Fuel, light and water charges’, extracting household burden from Linked Input-Output Tables
Prefectural taxes
Prefectural tobacco tax (Prefectural tobacco consumption tax)
‘Other consumption expenditures’ Golf course utilization tax (Recreational facility
utilization tax)
‘Culture and recreation’ Special local taxes (Food and beverage consumption tax,
amusement and drinking tax)
‘Food’
Automobile acquisition tax ‘Transportation and communication’, extracting household burden from Linked Input-Output Tables
Municipal Taxes
Municipal tobacco tax (Municipal tobacco consumption tax)
‘Other consumption expenditures’ Bathing tax ‘Culture and recreation’
With a national consumption tax rate of 4% and a local consumption tax rate of 1%, the effective consumption tax rate, tN, obtained from the nominal one, using an aggregated nominal tax rate of 5%
9
10
is 4.762% (i.e., 5% / (1 + 5%)). Meanwhile, the estimated effective consumption tax rate, tE, is the
estimated effective rate of consumption taxes excluding indirect taxes other than those obtained up to this point (i.e., macro consumption tax revenues against consumption expenditure item j for income group i / household consumption excluding macro untaxed items of consumption expenditure item j for income group i).
Adjustment factor A has an approximate value of 0.5.10 While the adjustment factor has been obtained by focusing on consumption tax, the disparity between FIES consumption data and macro consumption data is believed to affect all indirect taxes.
Applying adjustment factor A to equation (1), we estimate the effective indirect tax rate, τij,for
each consumption expenditure item by income group. Concerning consumption tax, the effective indirect tax rate for adjusted consumption tax only equals the effective consumption tax rate, tE,
obtained from the nominal tax rate.
In order to check for regressivity within indirect tax burdens by income group we measure the proportion of tax burden as a share of income. Hitherto, we have measured the (adjusted) effective indirect tax rate, τij,by consumption item and income group. Consequently, we are able to obtain the
indirect tax burden rate, bij, by consumption items and income groups as per equation (5):
𝑏𝑖𝑖 =𝜏𝑖𝑖𝑦𝑐𝑖𝑖
𝑖 . (5)
FIES consumption data by item and income group is represented by cij, and yearly income by yij. The
indirect tax burden rate by income group with aggregated consumption expenditure items, Bi, is
obtained using the equation below:
𝐵𝑖=∑ 𝜏𝑖𝑦𝑖𝑖𝑖𝑐𝑖𝑖. (6)
4.THE BURDEN OF INDIRECT TAXATION BY INCOME GROUP
Figure 2 displays indirect tax burden rates by income group as calculated using the procedure described above. While results have not been obtained for every financial year between 2001 and 2012, due to the absence of any large-scale tax reforms during the estimation period, no particularly significant differences can be seen among the analyzed years. Indirect tax burden rates by income group are shown in relation to indirect taxation overall, consumption tax, and excise tax.
As an overall trend, the indirect tax burden of low-income earners is relatively high. Regarding the burden of indirect taxation overall, the first decile is up to three times larger than the tenth. Accordingly, we can confirm the regressivity of indirect taxation inclusive of excise taxes.
10
Estimations by Uemura (2006), and Saitoh and Uemura (2011) use an adjustment factor of around 0.5.
11
Figure 2. Indirect tax burden rates by income group
Looking at the burden of consumption and excise taxes, the burden rate for the former is higher than that of the latter. While consumption and excise taxes account for a similar portion of national income, we have only considered the proportion of excise taxes paid by households, which is proportionally lower than the amount paid by businesses.
From the figure, we see that consumption tax burden rate drops more steeply than that for excise tax from the first to tenth decile. This indicates that the relative weight of consumption tax
regressivity is larger than that of excise tax.
As no significant differences exist amongst the years, the discussion below is based on data from FY2012. Figure 3 shows the indirect tax burden rate for each consumption expenditure item and income group.
From each of the tax burden rates shown, we can see which consumption items account for regressivity in consumption taxation. Figure 3 shows that the consumption tax burden rate for food, in particular, drops steeply from the first decile to the tenth, and hence regressivity is relatively high.11 The fact that consumption taxes applied to food are particularly regressive may provide justification for measures to reduce the tax burden of low-income earners.
11
Yearly income for each decile in 2012, as reported by FIES, were as follows (in yen, millions): 1.26, 2.14, 2.79, 3.37, 3.96, 4.65, 5.46, 6.54, 8.13, and 13.17, from the first to the tenth decile.
0% 1% 2% 3% 4% 5% 6% 7% 1st
decile decile2nd decile3rd decile4th decile5th decile6th decile7th decile8th decile9th decile10th
FY2001
FY2004
FY2007
FY2010
FY2012
All Indirect Taxation
Consumption Tax
12
Figure 3. Consumption tax burden rates by consumption expenditure item and income group (FY2012)
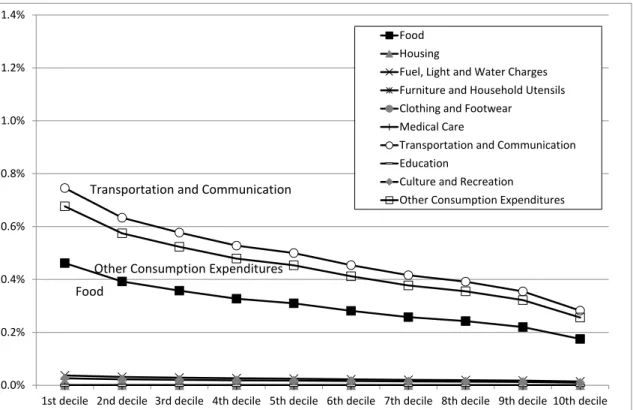
Figure 4 shows the burden rates of excise taxes for each consumption expenditure item. For ease of comparison, units along the vertical axis in both Figures 3 and 4 are aligned. As with the consumption tax figures, regressivity can be noted amongst most consumption items. Nonetheless, burden rates for consumption tax shown in Figure 3 are higher than those for excise taxes shown in Figure 4.
However, “Transportation and Communication” shows a higher burden rate for excise tax than it does for consumption tax, due to the burden of excise taxes such as the gasoline tax. In addition, while the burden rate for “Food” is higher than that of other consumption items, the main cause of this is the liquor tax. The burden rate for “Other Consumption Expenditures” is largely driven by tobacco related taxes.
0.0% 0.2% 0.4% 0.6% 0.8% 1.0% 1.2% 1.4%
1st decile 2nd decile 3rd decile 4th decile 5th decile 6th decile 7th decile 8th decile 9th decile 10th decile Food
Housing
Fuel, Light and Water Charges Furniture and Household Utensils Clothing and Footwear
Medical Care
Transportation and Communication Education
Culture and Recreation
Other Consumption Expenditures
Food
Other Consumption Expenditures
13
Figure 4. Excise tax burden rates by consumption expenditure item and income group (FY2012)
5.THE EFFECTS OF A CONSUMPTION TAX INCREASE ON INDIRECT TAX BURDEN
RATES
Hitherto, this paper discusses the structure of indirect tax burden rates inclusive of consumption taxation by income groups in Japan. The consumption tax has been raised in the past in an effort to secure funding for social security programs. Accordingly, we apply an analytical framework to consider the effects of an increase in the consumption tax on the household indirect tax burden rates. We give particular attention to the issue of regressivity associated with the consumption tax.
Figure 5 shows the results of test calculations for several policy patterns related to the consumption tax, based on the indirect tax burden rates by income group for FY2012. The graph indicates five patterns of indirect tax burdens corresponding to each of the five cases described. Case 1 is used as a benchmark whereby the consumption tax is set at 5%. Cases 2 to 5 all involve an increase to 10%.
As consumption tax increases are criticized for their regressivity, we consider several policy patterns including a tax reduction on food, a zero tax rate on food, and a partial tax refund.12
As such, the following cases are considered:
12
Case 5 considers providing a refund of the 5% consumption tax levied on food.
0.0% 0.2% 0.4% 0.6% 0.8% 1.0% 1.2% 1.4%
1st decile 2nd decile 3rd decile 4th decile 5th decile 6th decile 7th decile 8th decile 9th decile 10th decile Food
Housing
Fuel, Light and Water Charges Furniture and Household Utensils Clothing and Footwear
Medical Care
Transportation and Communication Education
Culture and Recreation
Other Consumption Expenditures
Other Consumption Expenditures Transportation and Communication
14 Case 1: Consumption tax 5% + Excise taxes (present rates) Case 2: Consumption tax 10% + Excise taxes (present rates)
Case 3: Consumption tax (excluding food) 10% + Food consumption tax 5% + Excise taxes (present rates)
Case 4: Consumption tax (excluding food) 10% + Food consumption tax 0% + Excise taxes (present rates)
Case 5: Consumption tax 10% + Food consumption tax – 5% + Excise taxes (present rates)
Figure 5.Indirect tax burden rates for each income group under an increased consumption tax scenario
Consumption tax regressivity rises relative to the tax increase. In particular, the lines in Figure 5 decline more steeply from the first decile in Cases 2, 3, and 4 compared to the other two cases. We consider a reduced tax rate and zero tax rate applied to food as a means of ameliorating regressivity. Case 3 leaves the consumption tax on food at 5%, while Case 4 applies a zero tax rate to food. Nonetheless, as can be seen in the indirect tax burden rate under Case 4, regressivity is not easily dealt with, even when a zero tax rate on food is applied.
Thus, as a further means of mitigating regressivity, we consider Case 5, in which a negative 5% rate on food is applied, that is, measuring the effects of refunding the 5% tax burden on food to
0% 2% 4% 6% 8% 10% 12%
1st decile 2nd decile 3rd decile 4th decile 5th decile 6th decile 7th decile 8th decile 9th decile 10th decile
Case 1 Consumption tax 5% + Excise taxes (present rates) Case 2 Consumption tax 10% + Excise taxes (present rates)
Case 3 Consumption tax (excluding food) 10% + Food consumption tax 5% + Excise taxes (present rates) Case 4 Consumption tax (excluding food) 10% + Food consumption tax 0%+ Excise taxes (present rates) Case 5 Consumption tax 10%+ Food consumption tax -5% + Excise taxes (present rates)
15
households. Relative to the other cases, the descending trend from the first decile is somewhat flatter, indicating a slight reduction in regressivity. Nevertheless, in all cases the overall tax burden for each income group is higher than the benchmark Case 1.
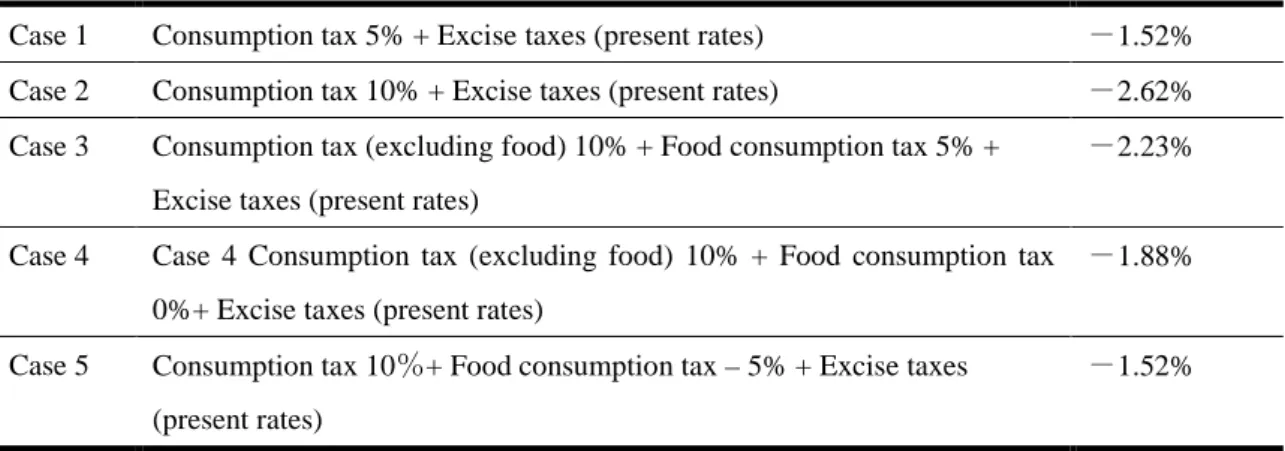
Finally, in order to evaluate these regimes of indirect taxation as a whole, we calculated
redistribution effects by finding the extent of improvement in the Gini coefficient in each case. The redistribution effect, E, is obtained by the following equation:
E(%) = 100(𝐺𝐼−𝐺𝑇)
𝐺𝑇 . (7)
Here, GI represents the Gini coefficient for yearly income, and GT indicates the Gini coefficient of
yearly income minus indirect tax burden. Results are shown in Table 2.
Table 2. Redistribution effect under different tax regimes by income group
Case 1 Consumption tax 5% + Excise taxes (present rates) -1.52% Case 2 Consumption tax 10% + Excise taxes (present rates) -2.62% Case 3 Consumption tax (excluding food) 10% + Food consumption tax 5% +
Excise taxes (present rates)
-2.23%
Case 4 Case 4 Consumption tax (excluding food) 10% + Food consumption tax 0%+ Excise taxes (present rates)
-1.88%
Case 5 Consumption tax 10%+ Food consumption tax – 5% + Excise taxes (present rates)
-1.52%
The negative values for the redistribution effect, E, is due to the regressivity of indirect taxation. From Table 2, the most regressive scenario is that of Case 2, whereby the consumption tax rate is raised to 10%. Cases 3 and 4 are considered as a means of mitigating this regressivity by seeing the effects of reduced or zero rates, but these do not result in positive improvements in the Gini coefficients.
Moreover, even providing a tax refund produced no marked improvement over the benchmark Case 1. This is because reducing tax rates, setting zero tax rates, and refunding tax lowers the tax burden for low and high-income earners alike. Thus, attempts to mitigate tax regressivity associated with a rise in the consumption tax should involve social security policies heavily targeted towards low-income earners, as opposed to the application of reduced/zero tax rates or refunds.
6.CONCLUSIONS
In this paper, we have explained the structure of indirect tax burdens including excise taxes in Japan by measuring the burden of excise and consumption taxation by income group.
16
The results of our analysis can be summarized as follows. Firstly, low-income earners are exposed to a relatively high burden of indirect taxation. Comparing the first and tenth deciles of income earners, the first decile was found to have an overall indirect tax burden rate of around three times the size of that of the tenth decile. Thus, we can conclude that the system of indirect taxation overall, even including excise taxes, is a regressive one.
Secondly, consumption tax was found to be more regressive than excise taxation. In particular, the tax burden rate associated with food was found to be relatively regressive and most onerous amongst the first decile of income earners. This may require some type of policy measure aimed at reducing the regressivity of consumption tax applied to food for low-income earners.
Thirdly, regarding the excise tax burdens, for “Transportation and Communication” the excise tax burden rate is higher than the consumption tax. This is due to the presence of excise taxes such as the gasoline tax.
Finally, we considered the effects on household indirect tax burdens occasioned by an increase in the consumption tax. Estimating the outcomes of several policy patterns, we found that regressivity increases alongside the consumption tax rate. Our measurements of redistributive effects show that, even accompanied by policies aimed at mitigating this regressivity, an increase in the consumption tax produces a negative redistribution across all income groups. This is because policies providing for reduced tax rates, zero tax rates, or tax refunds lower the tax burden for both low- and
high-income earners alike.
In order to lower the tax regressivity accompanying any increase in the consumption tax, social security policies closely targeting low-income earners are required, instead of lowering tax rates, setting zero tax rates or providing tax refunds to all income earners.
In Japan’s “Comprehensive Reform of Tax and Social Security,” the increase in revenue afforded by raising the consumption tax is to be used for social security expenditures. Instead of using lower tax rates to redistribute income, a more effective policy would redistribute income via social security spending. Highly target and efficient income redistribution policies will be more important than policies seeking to lower the burden of indirect taxation.
ADDENDUM. MEASURING THE PROPORTIONS OF HOUSEHOLD INDIRECT TAX BURDENS
Here we measure the proportion of household indirect tax burdens. In principle, this is calculated from the Linked Input-Output Tables, which is released every five years. For the four-year periods in between reporting years, figures are estimated by linear interpolation. As the data from 2006 onwards was unavailable, we used the same proportions as those in 2005.
17
Input-Output Tables we define the household burden proportion, Sn, for indirect tax n as per equation
(8). Household consumption expenditure is represented as Cn, total domestic demand as Tnand
increase in stocks as In.
𝑆𝑛=(𝑇𝐶𝑛
𝑛−𝐼𝑛) (8)
The increase in stocks, In,is obtained by the sum of the increase in producer’s stocks of finished
goods, Pn, the increase in semi-finished goods and works in progress, Hn, the increase in dealer’s
stocks of goods, Dn, and the increase in stocks of raw materials and supplies, Rn.
𝐼𝑛 =𝑃𝑛+𝐻𝑛+𝐷𝑛+𝑅𝑛 (9)
The proportions of household burdens, Sn, thus estimated are shown in Figure 6.
Figure 6. Proportions of household burdens
REFERENCES
Decoster, A, J. Loughrey, C. O’Donoghue, and D. Verwerft (2010) “How Regressive Are
Indirect Taxes? A Microsimulation Analysis for Five European Countries,” Journal
of Policy Analysis and Management, 29(2): pp. 326-350.
Go, S. D., M. Kearney, S. Robinson, and K. Thierfelder (2005) “An Analysis of South
Africa’s Value Added Tax,” World Bank Policy Research Working Paper 3671.
18
The Journal of Yokkaichi University, 5(2): pp. 1-10. (in Japanese)
Iwamoto, Y., S. Ozaki and Y. Maekawa (1995) “The divergence of the household savings trends between “Family Income and Expenditure Survey” and “National Accounts”
part 1,” Financial Review, 35: pp. 51-82. (in Japanese)
Iwamoto, Y., S. Ozaki and Y. Maekawa (1996) “The divergence of the household savings trends between “Family Income and Expenditure Survey” and “National Accounts”
part 2,” Financial Review, 37: pp. 82-112. (in Japanese)
Mirrlees, J, S. Adam, T. Besley, R. Blundell, S. Bond, R. Chote, M. Gammie, P. Johnson, G. Myles, and J. Poterba (2010) “Dimensions of Tax Design,” The Mirrlees Review, Oxford University Press for Institute for Fiscal Studies.
Mirrlees, J, S. Adam, T. Besley, R. Blundell, S. Bond, R. Chote, M. Gammie, P. Johnson, G. Myles, and J. Poterba (2011) “Tax by Design” The Mirrlees Review, Oxford University Press for Institute for Fiscal Studies.
Murasawa, T., M. Yuda and Y. Iwamoto (2005) “A Trade-off between Efficiency and
Equity in Adopting Differential Rates to the Consumption Tax,” The Economic
Analysis 176: pp. 19-41, The Economic and Social Research Institute (ESRI). (in Japanese)
Poterba, J.M. (1991) “Is the Gasoline Tax Regressive?” NBER Working Paper No. 3578.
Saitoh, Y. and T. Uemura (2011) “Indirect Tax Burden of Income Groups in Japan,” The
Journal of the Board of Audit, 44: pp. 27-40, The Board of Audit in Japan. (in Japanese)
Uemura, T. (2006) “Household Indirect Tax Burden and the Future of Consumption Tax
in Japan,” The Journal of the Board of Audit, 33: pp. 11-29, The Board of Audit in