Inter-American Development Bank September 2011
Brazil
2007-2010
Inter-American Development Bank
September 2011
Original: English
Country Program Evaluation
Brazil
2007-2010
iii
Contents
Acronyms Abstract Executive Summary I. Introduction ...1II. Country Context. ... 5
III. Relevance ...11
A. The Bank’s Niche: The Business Model ...14
B. Sector And Borrower...17
C. Lending Instruments ...19
IV. Operational Efficiency in Delivery ... 21
A. Portfolio Performance ...21
B. Use Of Country Systems ...25
C. Other Official External Financing Agencies ...26
D. Adequacy Of Resources ...27
V. Efficacy: Development Effectiveness and Knowledge... 29
A. Development Effectiveness: Bottom Up Approach ...29
B. Knowledge And Technical Cooperation ...35
iv
Banobras Banco Nacional de Obras y Servicios Públicos in Mexico
BNDES National Bank for Economic and Social Development
CEF Caixa Economica Federal
CPE Country Program Evaluation
FINDETER Financiera de Desarrollo Territorial in Colombia
FNDR National Fund for Regional Development
FRL Fiscal Responsibility Law
NSG Non-sovereign loans
NGOs Non-governmental organizations
OVE Office of Evaluation and Oversight
PAC Plan to Accelerate Growth
PIU Project Implementation Unit
PTI Poverty Targeted Investment
SEAIN Secretaria Assuntos Internacionais
SCF Structure and Corporate Finance Department
SEQ Social Equity Enhancement
SFC Secretaria Federal de Controle
SMEs Small and Medium-sized enterprises
v This evaluation was led by Inder Jit Ruprah, under the general direction of Cheryl
W. Gray. The team was composed Silvia Raw, Julia Sekkel, Jose Ignacio Sembler, Fernando Vargas, and Patricia Sadeghi.
Brazil is the largest country in Latin America and the world’s fifth largest country, both by geographical area and by population with over 193 million people.
vii
Executive Summary
Summary
The evaluation concludes that:
■ The program was relevant. Faced with de-clining federal demand, the Bank was able to maintain its relevance in the country due to the change in its operational model.
■ However, there were issues regarding op-erational efficiency and development effective-ness partly due to the operational model.
The previous Country Program Evaluation (RE-335) was dis
-cussed with the country authorities in early 2009 and by the
Board in September 2009. It evaluated the two most recent
Country Strategies, 2000-2003 and 2004-2007, in anticipation of
a new strategy. However, since then no new strategy document
has been produced, only updates extending the 2004 strategy
to the end of 2010. Currently the Bank is preparing a Country
Strategy Document for Brazil for the period 2011-2014.
This Country Program Evaluation (CPE) covers the period 2007 to 2010. It draws lessons from past Bank activities, with an emphasis on the interface between the Bank and Brazil, as an input for the future country program. It also reviews rel-evant issues that were raised in the previous CPE in light of developments since 2007, including the consolidation of a new Bank business model in the country, the Bank’s initiation of a new capital increase with specific priorities and targets, and the inauguration of a new President, Dilma Rousseff, in January 2011.
Between 2007 and 2010, the Bank’s portfolio increased by 49% in terms of the number of projects and by 79% in terms of the dollar value of the outstanding loan balance. The Bank’s average annual approvals and disbursements in the period represented 0.15% of Brazilian GDP, but accounted for 21% of total Bank lending and 16% of the total number of projects during this period. This asymmetrical relationship has implied that the Bank has had to search for niches in the country over and above that of pure financ -ing. Thus, a new business model with Brazil emerged in 2006 and was consolidated over the period. While the business model has not been formalized in any specific Bank documents, it can be deduced from the pattern of approvals. The model rests on three types of clients: (a) sub-national governments; (b) the National Bank for Economic and Social Development (BNDES) and (c) the private sector. The Bank’s business model in Brazil is unique. However, it may be a harbinger of a profile of interventions in other borrowing countries as their sub-national governments become eligible for foreign bor-rowing and as the Bank’s supply of lending to the private sector increases.
viii Country Program Evaluation: Brazil 2007-2010
The analysis carried out in the CPE with respect to the evaluative criteria of rele-vance, efficiency and efficacy leads to the following conclusions. While relevance of programming intent could not be evaluated in the absence of a new country strategy document since 2004, the composition of approvals was relevant. The diversification of clients embodied in the new business model allowed the Bank to maintain its relevance to the country in the face of declining demand for fed-eral projects and the small amount of resources relative to the size of the Brazil’s economy. The program was relevant with respect to country ownership and the country’s development challenges as outlined in its flagship development pro -gram, Plan to Accelerate Growth (PAC). Interviews with government officials re -veal high country ownership. The data shows that the Bank is a responsive devel-opment partner as it has adjusted its portfolio towards “bricks and mortar”, credit, and institutional strengthening projects, while moving away from country-wide programs and structural reforms featured in the portfolio prior to 2007.
However, the CPE found worrying trends in terms of operational efficiency in the delivery of services to Brazil. Preparation time and cost measures have generally worsened and compare badly with other “A” countries. This is a result of a number of factors. The first is the higher proportion of lending to sub-national govern -ments in the portfolio, given that operational efficiency indicators for state and municipality projects are more akin to B and C&D countries’ averages. The second is the relative lack of standardisation of umbrella operations to sub-regional gov-ernments; this is especially true in the case of Procidades, the pilot Bank initiative mainly composed of infrastructure for municipal governments. Third, there is in-sufficient use of local partners in the delivery and supervision of projects. Fourth, there is an almost exclusive use of the investment lending instrument, and within investment lending, limited adoption of country systems. The World Bank, in con-trast, has used policy-based loans and adopted the sector-wide approach, SWAp, modality for investment loans. Thus, in the World Bank’s case, over half of the value of its portfolio is effectively budget support.
In terms of efficacy, i.e., development effectiveness, the Bank’s portfolio shows an im -provement in the clarity of measurable expected results of projects and the greater use of ex ante cost benefit calculations. There is no commensurate improvement in the mea -surement of actual development results. For a large number of active and closed projects no data were or are being collected to document development results. However, where there are data, it shows the Bank is often achieving development results according to existing PCRs. The results of the Bank’s technical cooperation are also unknown. The absence of a tracking system for outputs and the lack of a dissemination system to facili-tate third party access to those outputs reduce the value of knowledge generated. This shortcoming is not unique to the Brazilian portfolio but a common finding by OVE in its CPEs. However, unlike many countries, Brazil has high institutional capacity in this area.
ix
Executive Summary
Finally, the CPE identified two recent developments that need to be taken into ac -count in the next -country strategy document. First, the Bank needs to discuss with Government authorities how to better align sector interventions with those pro-posed under IDB-9, including poverty and equity, climate and environment, and regional integration. IDB-9 also specifies operational efficiency and development effectiveness targets, themes that echo the Paris Declaration. Given the weight of Brazil in the Bank’s portfolio, the Bank is more likely to meet its regional targets if they are incorporated into the upcoming strategy. Second, the administration in Brazil has emphasized the elimination of extreme poverty as a new government priority, an area in which this evaluation has found the Bank’s portfolio wanting.
The findings of the evaluation suggest that the Bank consider a number of op -tions which, without eviscerating the functional partnership and business model developed with the Brazilian authorities, may enhance relevance, efficiency and efficacy of its future portfolio.
The Bank, in its new country strategy document, should ensure the appropri-ate focus in the program by specifying ex ante criteria it will use to consider the mix of operations, including the strategic orientation that will guide the choice of non-sovereign loans. In order to enhance relevance, the Bank needs to consider pro-poor, regional integration and climate change projects that are currently under-represented in the Brazilian portfolio. The criteria could be based on geographical targeting or on the Bank’s own PTI/SEQ classification of projects. The Bank’s “bricks and mortar”, credit, and institutional strengthening projects, the mainstay of the Bank’s intervention in Bra-zil, if targeted to poor regions would support the pro-poor bias specified in IDB-9 while also contributing to Government priorities (Brazil without Misery and PAC II). In the area of regional integration, another IDB-9 priority, the Bank could enhance its col -laboration with BNDES, which is beginning to expand its coverage to other countries in the Region, under the auspices of programs such as the Initiative for the Integration of the Regional Infrastructure. Recent IDB private sector operations for green credit are an option for incorporating the private sector to address climate change in Brazil; working with the country’s regional development banks may provide another option.
The new country strategy document should explicitly include the measures the Bank will adopt to improve operational efficiency. Several non-mutually exclu-sive approaches could be considered: standardising its sub-national products carefully to obtain economies of scale in preparation; increasing collaboration with local partners that can strengthen the delivery and supervision of its projects; and adopting a different instrument and modality mix that may also help to improve efficiency. Given the simi -lar business models of the IDB and the World Bank, a joint working group under the tutelage of the Ministry of Planning, would help in defining the rules of engagement. In order to correct the operational deficiencies found in umbrella operations, it is critical for the Bank to conduct an evaluation of the pilot program Procidades, as planned. Analyses of Profisco, a program for institutional strengthening in the fiscal area for states, and the
x Country Program Evaluation: Brazil 2007-2010
SME operations with BNDES could provide valuable inputs on possible trade-offs be-tween operational efficiency and development effectiveness.
The new country program should include an action plan with time bound tar-gets for improving the measurement and dissemination of development effectiveness. In order to document the Bank’s development effectiveness and generation of knowl-edge, it needs to effectively partner with local entities for data gathering and evaluation and to disseminate results to third parties. Given the country’s human capital resources and capacity, the Bank could work with Brazilian institutions to create a system of ex post development effectiveness studies and disseminate findings through a depository of reports (studies and progress measurement) available to third parties.
M
anageMentC
oMMentsBefore responding to the three main recommendations of the OVE Country Program Evaluation, it is worth noting that Brazil’s new business model reflects advances as a medium-income country, with plenty of market access, sound macroeconomic policies and declining appetite for IDB funding at the federal level. In this context, Brazil is becoming a client with increased appetite for sub-national financing, and knowledge transfer and dissemination.
Adaptation to Brazil’s new business model was accompanied by corporate decisions to increase the effectiveness of the Bank’s actions, to pursue evaluable results, and to cul-tivate greater rapprochement with customer expectations. The institutional profile en -countered among the new sub-national borrowers has revealed several key circumstances: (i) the deficiency and inexperience of the agencies to prepare and oversee operations with multilateral financing, (ii) increased demand for training in relevant technical matters, as well as in relatively basic administrative and financial matters, which were of critical importance to successful project implementation, (iii) increased cost of preparing and monitoring projects, as a result of institutional weakness and the vast geographic disper-sion, and (iv) an unfounded assumption within the Bank that strong institutions were guaranteed at all levels in Brazil, which turns out is not the case when dealing with some states and municipalities and, therefore, that operational indicators for “A” countries are not always appropriate.
xi
Executive Summary
The following table presents a summary of OVE’s recommendations and Manage-ment responses.
OVE Recommendations and Management’s Response OVE Recommendations in the Country
Program Evaluation
Administration’s Response and Link to Country Strategy 2011-2014 Recommendation 1:
Focus on the program, setting ex-ante criteria to decide on the mix of operations, includ-ing the strategic orientation that will guide the choice of non- sovereign loans. Recom-mendation includes considering operations targeted at the poor that foster regional in-tegration and are aimed at intervening in the climate change agenda.
Partially agree. Given the diversity of sub-national actors that comprise the uni-verse of borrowers, whose demand is screened by the federal government, it is not possible to define ex-ante criteria to decide on the mix of operations. In addition, the pent-up demand for investment projects in Brazil already requires significant coordination and prioritization effort at the federal level. In view of the restrictions currently affecting the funding envelope, it would be risky to present additional operations that could impact negatively on annual disbursements or compete with ongoing operations.
It is important to highlight, as well, that the methodology developed by VPC, agreed with the Board of Executive Directors and applied to all countries, explicitly separates strategic intent from programming decisions. While the county strategy does indicate the priority areas and strategic objectives that will be pursued during a pre-defined period (many of which are closely aligned to OVE recommendations), the mix of operations is a programming decision that requires both the commit-ment by the Governcommit-ment and a definition of the budget and financial capacity of the Bank. As such, these decisions will be taken on an annual basis during the Bank’s programming exercise.
The strategy does, however, assign high priority to operations targeting the poor, due to the primary focus on the Northeast and the emphasis on strategic interven-tions in the education, social protection and health sectors. Likewise, it highlights the growing importance of addressing climate change as both an area in itself and as a cross-cutting element present in the indicators and targets of other strategic sec-tors. The strategy defines a cross-sectional space for the generation and funding of regional integration projects.
Finally, the strategic sectors highlighted in the strategy will provide guidance to defining non-sovereign loans. Programming of non-sovereign operations follows a different path outside the prioritization and analysis performed by the ministries of Planning and Finance.
Recommendation 2:
Explicitly include measures that will be taken to improve operational efficiency. Measures that could be included are: standardizing the products of sub-national operations; (ii) working with local partners to improve the service provision; and (iii) establishing a working group with the World Bank, co-ordinated by the Ministry of Planning. In addition, carry out evaluations of PROCI-DADES and analysis of PROFISCO and BNDES to provide inputs on trade-offs be-tween operational efficiency and develop-ment effectiveness.
Partially agree. The strategy focuses on efforts to enhance the performance of sub-national activities, using economies of scale resulting from standardized work with the councils of sectoral secretariats such as Finance, Planning and Environment, and building on advances in standardization achieved by PROFISCO. The coun-cils of sectoral secretariats are an effective medium for working with local partners. COFIEX, as the agency charged with planning external resources to support the government, defines the distribution of debt among multilateral agencies according to both the value added of each one and client preferences. Formation of the work-ing groups, the evaluations and analyses recommended by OVE will be undertaken.
Recommendation 3:
Include an action plan to improve measure-ment and dissemination of developmeasure-ment effectiveness.
Agree. The results matrix reflects the multiple sectoral analyses and contains the relevant indicators related to country and Bank priorities. SPD review and valida-tion of the results matrix showed a strong degree of evaluability, which will guide the efforts to improve measurement and dissemination.
1
Map of Brazilian states and main cities.
1
“Head 1”: Unit bold
48/40
#
Introduction and
Context
Summary
The country program evaluation covers the period 2007-2010, and draws les-sons for the future Bank strategy. It also considers aspects of the previous evalu-ation in light of the major events that occurred since 2007:
■ Change in the operation-al model of the country ■ Portfolio growth ■ Beginning of the new
capital increase in the Bank
■ Election of the new Bra-zilian president, Dilma Rousseff, who took office in January 2011
The previous Country Program Evaluation (RE-335) was dis
-cussed with the country authorities in early 2009 and by the
Board in September 2009. It evaluated the two most recent
Country Strategies, 2000-2003 and 2004-2007,
1in anticipation
of a new strategy. However, since then no new strategy has
been produced; the 2004 strategy was extended to the end of
2010. Currently the Bank is preparing a Country Strategy
Docu-ment for Brazil for the period 2011-2014.
This Country Program Evaluation (CPE) covers the period 2007 to 2010. It draws lessons from past Bank activities, with an emphasis on the interface between the Bank and Brazil, as an input for the future country program. It also reviews relevant issues that were raised in the previous CPE under the light of develop-ments since 2007. Three developdevelop-ments are important to note.
The first major development is a change in the business model, accompanied by a growing portfolio. During the period 2007-2010 the size of the portfolio increased by 49% in terms of the number of projects and by 79% in terms of the dollar value of the outstanding project balance.2 The increase reflects the approval of 102 projects for approximately US$10 billion, while 57 projects were closed. A new business model with Brazil, initiated in 2006, was consolidated over the period.3 Specifically, the
Bank shifted from a business model characterised mainly by lending to the federal 1 Most of the data used in the CPE (RE-335, July 2010) ended in 2007; the year 2008 was incorporated
primarily in the macroeconomic section, leading to disagreement with Bank management about the reference period.
2 Note that in this CPE “projects” refers to loans using ordinary capital while “operations” refers to projects as well as technical cooperation and MIF projects, both loans and grants. The outstanding project balance was US$2.85 billion in December 2006 and increased to US$5.13 billion by December 2010, while the number of active projects increased from 68 to 101. These numbers include sovereign and non-sovereign projects (including TTFPs) using as a source the PISTA system. Project approvals during 2007-2010 were US$10,130 billion (i.e. 102 projects), compared to US$4.1 billion (i.e. 43 projects) in the previous four year period (2003-2006). The total operation approvals during 2007-2010 was US$10,260 billion (257 operations), based on OVEDA.
3 The CPE begins in 2007 precisely to capture the changing business model.
2 Country Program Evaluation: Brazil 2007-2010
government to lending directly to sub-national governments, and consolidating its re-lationships with the National Bank for Economic and Social Development (BNDES) and the private sector.
The CPE analyzes whether the issues identified in the previous evaluation have improved or worsened in light of the growing portfolio and the new business model.
The second important development since 2007 is the Bank’s initiation of a new capital increase. IDB-9 sets out targets to be achieved by 2015, in terms of sec -toral priorities and improvements in both operational efficiency and develop -ment effectiveness.4 Such targets are set at the regional level, not for specific
countries. However, given that Brazil is the Bank’s largest client, the probability of achieving the Bank-wide targets will be enhanced to the degree that the Bra-zilian portfolio is in line with those targets. Thus, IDB-9 provides a convenient framework to examine the status of the current portfolio and the challenges for the coming program cycle. IDB-9’s three sets of targets, corporate sector priori -ties, operational efficiency, and development effectiveness, closely correspond to the country program’s evaluative criteria of relevance, efficiency and efficacy. The third development is the inauguration of President Rousseff in January 2011 for a four-year term. The Bank’s new program needs to incorporate the new admin-istration’s priorities. The formal four year development plan is programmed to be approved by the end of 2011, but one important priority has already emerged in her discourse, the elimination of extreme poverty,5 a goal shared by the Bank.
During the period covered in this CPE the government’s flagship development program was the Program to Accelerate Growth (PAC), which covered 2007-2010 and is used as a benchmark for relevance. For the coming programming cycle PAC II, which covers the period 2010 through 2014, will be the relevant benchmark.6 In addition, it should be noted that investment is needed to
up-4 See: “Report on the Ninth General Increase in the Resources of the Inter-American Development Bank,” AB-2764 (May 2010).
5 The program Brazil without Misery (Brasil Sem Miséria) was launched by President Rousseff in June 2011.
The program’s objective is to remove 16.2 million people from extreme poverty in four years, with an
estimated annual cost of R$20 billion. It targets families with per capita income below R$70 per month. It includes activities such as cash transfers, social inclusion programs and access to public services such as education, health, social assistance, electricity, water and housing. In cooperation with states, municipali-ties, the private sector and NGOs, the plan is to create new programs and expand and integrate the existing ones. See: http://www.brasilsemmiseria.gov.br/conheca-o-plano/
-3 1 Introduction
grade infrastructure for two international sports events (the World Cup in 2014 and the Olympics in 2016) as well as exploration of new oil fields.
The previous CPE raised a number of issues, not all of which were accepted by Management.7 Some disagreements are no longer relevant and are now only of historical interest. Management did not agree with the reference period of the CPE, the evaluation’s speculation of the potential impact of the international cri-sis on the Brazilian portfolio, and the assertion that the Bank’s realignment had initially produced negative effects on country dialogue. Other disagreements, such as the strategy’s inability to anticipate results and the low predictability of the program, cannot be re-examined in the absence of a new strategy docu-ment.
There was also disagreement on the CPE’s findings on project cycle delays rela -tive to the Bank average and the role of both the Fiscal Responsibility Law and IDB’s institutional constraints as contributing factors. Management requested a second look at the law as well as an additional exercise comparing Brazil to other large federative countries such as Mexico and Argentina, which are car-ried out in the current document. Moreover, Management proposed specific measures to shorten project cycles, which are also examined.
There was less disagreement with respect to development effectiveness. The Administration accepted the need to increase the measurement of develop-ment effects of individual projects but argued that broad measures of devel-opment, included in the country strategy’s document result matrix, are not relevant given the marginal contribution of the Bank to the achievement of eco-nomic and social objectives. There was also agreement on the need to expand the use of country systems, the need to align non-sovereign guarantee opera-tions with country programming, and the need for the articulation of knowl-edge generation through technical cooperation. These issues are addressed in this document.
tric power generation and oil and gas exploration (R$466 billion); urban renewal (R$57 billion); urban and rural social programs (R$23 billion); housing (R$278 billion); water, sanitation and electrification (R$31 billion); and transportation (R$105 billion).
7 The CPE recommendations are presented in Annex I. Management’s response is contained in
doc-ument RE-355-1 (September 2009). It is important to note that Management did not concentrate on the recommendations themselves, but rather on the findings of the document.
2
Stage II of the Fernão Dias Highway Widening Program in Pouso Alegre, Minas Gerais.
5
“Head 1”: Unit bold
48/40
#
Country Context
Summary
■ The period from 2007-2010 was characterized by a continuation of:
■ High economic growth;
■ Lower inflation;
■ Reduction in poverty and income inequality. ■ At the sub-national level
(26 states, the Fed
-eral District, and 5,565 municipalities), Brazil is characterized by high inequality at the regional level.
■ In addition to the obstacles posed by the size and heterogeneity of Brazil, the Bank’s operat-ing model implies diffi-culties in the design and execution of operations
A Country Program Evaluation typically includes a description
of the macroeconomic evolution of the economy and its major
development challenges, in order to contextualise and obtain
evaluative benchmarks for the Bank’s intervention, in terms of
programming intent and delivery.
Although analyses of macroeconomic conditions and country-wide develop-ment and reform challenges are important inputs for a CPE, this must be quali-fied in the Brazilian case. First, as shown in this CPE the Bank has focused on “bricks and mortar” and “institutional strengthening” and has not been engaged in policy reforms in the country. Second, not only does the size of the economy make the Bank’s financing insignificant in terms of economy-wide measures, but financing has been acyclical. Third, the new business model based on lend -ing to sub-national governments implies that it has to address highly diverse, regionally-specific development challenges, which do not necessarily correspond to national developments. Fourth, lending to sub-national governments requires that they are in compliance with the country’s Fiscal Responsibility Law.
Brazil is the largest country in South America, occupying almost half of the South American continent, and the fourth largest in terms of coterminous area in the world. It borders every other South American nation except Chile and Ecuador. Brazil’s economy is the largest in the Region, accounting for 45% of regional GDP. It is the main trading partner for a number of countries in the Region and absorbs about a quarter of the exports of Argentina, Bolivia, Uruguay and Paraguay. It is also an increasing source of outward direct foreign investment for a number of countries in the region. Thus, Brazil represents a key actor in terms of regional inte-gration amongst the Bank’s borrowers.
The 2007-2010 period in Brazil was characterised by a continuation of high economic growth that began in 2004, with only a shallow recession in 2009 (GDP fell by 0.7%), a fall in inflation since 2002, and the reduction of poverty (from 2003 onwards) and
6 Country Program Evaluation: Brazil 2007-2010
Brazil’s ranks 49.3 in the Gini coefficient index; the richest 10% receive 42.7% of the nation’s income and the poorest 10% receive less than 1.2%.
© Willie Heinz, 2005
income inequality (starting in 2001) to historical lows. The country is well on the way to reach the Millennium Goals (see Chart II.1 and Table II.1 in Annex). This performance was a result of prudent macroeconomic policies, a generally favourable external environ-ment and an emphasis on social policies. According to the IMF, perspectives for 2011 to 2015 are positive. Economic growth of 7.5% in 2010 is expected to converge to about 4% p.a., and inflation is forecast to decline to 4.5% p.a. The current account of the bal -ance of payments, which had turned into a deficit in 2008, is expected to grow, as are official foreign reserves. This scenario assumes that the favourable external environment, particularly the commodity boom, will continue.8
At the subnational level, the focus of the business model, Brazil is divided into 26 states plus the Federal District and 5,565 municipalities, characterized by wide regional in -equalities. The GDP per capita of Brazilian states run the gamut of all the Bank’s bor-rowing members, as shown in Table 1 below. The relatively poor regions as measured by GDP per capita are the North (US$1,944) and Northeast (US$2,431) while the richest are the Center-West (US$6,020), Southeast (US$5,322) and the South (US$4,913). Thus, within one country, the Bank faces the same challenges it confronts amongst its borrowers.
Nonetheless, there are indications of a convergence as the poorer states grew at a higher rate than the richer states in recent years. A similar general pattern can be seen for educa-tion (proporeduca-tion of the populaeduca-tion with at least eight years of educaeduca-tion), poverty, and the proportion of the population covered by potable water and sewerage systems. The changes have implied a fall in inequality (measured either by the GINI coefficient or the Theil index) for all the indicators. However, inequality within states remains a challenge 8 See Brazil-Staff Report for the 2011 Article IV Consultation, SM/11/152, and July 1, 2011.
7
2 Country Context
T
able 1. Regional Ineq
ualit
y
within Brazil and Comp
ar ison with o ther Countr ies in the Region IDB Borr owing Countries B razilian S tates and R egions Countr y GDP per capita* (2008) State GDP per capita* (2008) H uman D ev elop -ment I ndex** (2007) Po ver ty I nten -sity** (2006) A verage an -nual gr owth*** GDP per capita (2007-2008) R egion (GDP per capita) Trinidad and T obago $10.909 D istrito F ederal $12.171 0,74 4,2 3,3% Center-W est (US$6,020) D ominican R epublic $3.623 G oiás $3.409 0,71 6,1 6,3% B eliz e $3.691 M ato G rosso do S ul $3.756 0,68 6,3 8,2% B razil $4.469 M ato G rosso $4.746 0,68 6,0 12,6% Paraguay $1.516 Alagoas $1.649 0,55 13,0 2,8% N or theast (US$2,431) G uatemala $1.893 B ahia $2.218 0,61 10,7 2,9% G uatemala $1.893 Ceará $1.883 0,65 11,4 4,9% Paraguay $1.516 M aranhão $1.616 0,59 13,2 7,2% E cuador $1.784 Paraíba $1.818 0,60 11,3 4,3% G uatemala $1.893 Pernambuco $2.135 0,65 11,2 3,9% H onduras $1.436 Piauí $1.422 0,60 12,8 5,5% G uatemala $1.893 Rio G rande do N or te $2.171 0,65 10,3 3,1% Suriname $2.623 Sergipe $2.589 0,63 10,8 6,3% Suriname $2.623 Ac re $2.620 0,61 8,6 11,1% N or th (US$1,944) B eliz e $3.691 Amaz onas $3.710 0,62 7,8 1,8% Pe ru $2.921 Amapá $2.921 0,57 6,7 6,5% G uatemala $1.893 Pará $2.116 0,60 8,7 5,7% Colombia $3.121 R ondônia $3.170 0,61 8,0 11,8% Colombia $3.121 R oraima $3.136 0,63 9,7 6,8% E l S alv ador $2.672 Tocantins $2.706 0,64 9,6 11,5% Costa Rica $5.187 Espírito S anto $5.356 0,75 6,7 7,8% Southeast (US$5,322) Jamaica $3.824 M inas G erais $3.768 0,78 6,0 6,1% Panama $5.688 Rio de J aneir o $5.724 0,80 4,4 3,2% M exico $6.592 São P aulo $6.474 0,87 3,5 4,7% B razil $4.469 Paraná $4.481 0,82 5,2 6,3% South (US$4,913) Costa Rica $5.187 Rio G rande do S ul $4.865 0,76 5,0 6,0% Panama $5.688 Santa Catarina $5.392 0,79 2,8 6,6%
8 Country Program Evaluation: Brazil 2007-2010
Memorandum to Table 1: Change in inequality between Brazilian states
Inequality
Coefficient GDP per capita Life Expectancy
% pop 8 or + years of education
Household in-come, per capita
Percentage of population cov-ered by water supply networks Percentage of population cov-ered by sewerage network GINI THEIL 2004 2008 2004 2008 2004 2008 2004 2008 2004 2008 2004 2008 0.294 0.149 0.283 0.138 0.020 0.001 0.018 0.001 0.113 0.020 0.093 0.014 0.199 0.064 0.189 0.061 0.105 0.020 0.082 0.013 0.249 0.104 0.177 0.051
Source: IMF statistics; * IPEA and the World Bank (constant 2000 US$); ** FIRJAN system and FIRJAN Municipal Development Index; *** IPEA (poor families in 100 people).
See: http://www.firjan.org.br/data/pages/40288094212F790101213013CD7D651D.htm;and http://www.ipea.gov.br/portal/
and there are large differences in GDP per capita, the Human Development Index, the institutional capacity index of individual municipalities within the individual states (see Table II.2 in Annex).9
In addition to the challenges posed by Brazil’s size and heterogeneity, the Bank’s business model implies challenges in both the design and delivery of its operations lending to sub-national governments is conditional on eligibility under the Fiscal Responsibility Law. Brazil enacted a Fiscal Responsibility Law (FRL) in 2000, which covered all three levels of government (federal, states, and municipalities).10 This contributed to the reduction of fiscal disequilibrium in sub-national governments that had been an important source of 9 This index was constructed by OVE using principal component analysis for indicators in the areas of
in-stitutional, legal--regulatory and education level of public employees. The data is from the IBGE survey
Pesquisa de Informações Básicas Municipais 2009.
10 The Fiscal Responsibility Law (LRF) established a framework of fiscal planning, execution, and trans-parency at the federal, state, and municipal levels. The LRF requires fiscal administration reports at four-month intervals, with data on budget execution and compliance with the LRF. LRF sets ceilings on personnel spending at 50% of Federal Government spending and 60% of state and local government spending. If these limits are breached in any given four-month period, the lapse must be redressed within the following eight months. In terms of public debt, the LRF and complementary legislation set a ceiling of 120% of current revenue at the national and state levels. If this ceiling is breached, the debt has to be brought back within the ceiling over the following 12 months, and no form of borrowing is permitted until that happens. There is also a “golden rule” provision, stating that net borrowing cannot exceed the volume of capital spending. Lending between the national, state, and municipal governments are prohib-ited. The LRF contains two escape clauses that suspend the debt ceiling: (i) the case of a Congressional declaration of a state of national calamity or state of siege, and (ii) in the case of an economic recession, defined as a growth rate of less than 1% of GDP over a period of one year. In the latter case, the period
9 2 Country Context
instability in earlier periods.11 The number of states violating the FRL threshold fell from 14% in 2000 to 6% by 2008, although under bilateral agreements between individual states and the Federal government most states are required to reduce debt levels below those defined by the FRL. The debt to revenue ratio of municipalities has generally fallen and the few that breached the threshold have adjusted. The primary fiscal balance of mu -nicipalities has hovered around 0.1% of GDP and of states plus mu-nicipalities about 1% of GDP during the 2007 to 2009 period. According to the international Budget Partner -ship 2008 Open Budget Index, Brazil scores 74% for openness in its budget process, i.e. in the “substantial” category of budget openness.
for redressing a breach in the debt ceiling is doubled to two years. The escape clauses also apply to the limits on personnel spending.
11 For a history see F. Cazeiro Lopreato, “O Colapso das Finanças Estaduais e a Crisis da Federação” (2002). http://www.iececon.net/arquivos/publicacoes_44_1427145249.pdf for an evaluation of the Law’s im-pact on fiscal accounts see: Chapter VI of Brazil: Selected Issues, SM/10/169, IMF, July 2010.
3
From the pattern of approvals, it can be deduced that the Bank’s lending strategy rested on three types of clients: (a) sub-national governments; (b) the National Bank for Economic and Social Development (BNDES) and (c) the private sector.
11
“Head 1”: Unit bold
48/40
#
Relevance
S
ummaryDuring the evaluation period:
■ The volume of the IDB’s portfolio in Brazil in-creased significantly;
■ A new business model was consolidated in the country. According to this model, funding is concentrated on three clients:
1. Sub-national governments
2. The National Bank of Economic and Social Development 3. The private sector
Relevance, in terms of both programming intent and actual
delivery, refers to the degree to which the Bank’s country
pro-gram is consistent with the needs of the country as well as the
Government’s strategies and priorities for addressing these
needs. The Bank’s institutional priorities, reflecting its strate
-gic goals, comparative advantages, and performance targets
can also be used as an evaluative benchmark, since the
coun-try program should reflect a consensus between demand and
supply.
As in the case of several countries in the Region, relevance in terms of programming in-tent cannot be evaluated since there was no new Board-approved country document for the period under consideration. Updates were produced for several of the countries, in-cluding Brazil,12 as the Bank continued to debate the format of country strategies. In this context, the Report of the Chairperson of the Programming Committee of the Board: “expressed some concerns with respect to issues such as the criteria for setting the effective periods of the updates; the update of strategies that expired long ago during this transition period and their extended effective period; consideration of country systems, with the matter of procurement still pending; evaluability of the updates; and due consideration of risk ar-eas as well as significant changes that may have occurred during the period that had elapsed since the expiration of the previous strategies. In addition, it noted that “OVE indicated that it had been duly informed, that the updates as such were not evaluable, and that it would be necessary to determine whether the original strategy and update taken together would be.” 13
12 The 2008 update (GN-2477-2) essentially contained a Bank-wide update of projects in the pipeline for 2008 (see GN-2477-2). The 2010 update (GN-2570), included Argentina, Brazil, Dominican Republic, Jamaica, Mexico, Trinidad and Tobago, Uruguay, and Venezuela.
13 GN-2570-2 (June 2010), http://sec.iadb.org/Site/Documents/DOC_Detail.aspx?pSecRegN=GN-2570-2.
12 Country Program Evaluation: Brazil 2007-2010 Poverty in Brazil stems more from the
existence of high inequalities than low level of average income. Like in other countries, education is the best tool for improving social mobility. © Willie Heinz, 2005
The concerns raised by the Programming Committee were realised, at least for the Brazilian case. Although the original strategy document was approved seven years ago and the Bank’s business model for Brazil had been changing since 2006, the updates did not include revisions of the priority areas or sectors nor of the results framework, nor did they mention the new business model. Thus relevance of intent cannot be judged, only relevance of delivery.
Between 2007 and 2010 the Bank approved approximately US$10 billion in new lending. All projects were deemed consistent with the four priority areas identi-fied in the 2004 Strategy: (a) productivity and infrastructure, according priority to small and medium-sized enterprises (SMEs) and to the use of public-private partner -ship models in new investments; (b) poverty, equity, and human capital formation, with emphasis on income-distribution programs as a short-term measure for pov-erty alleviation and education and health programs as sustainable measures for en-hancing equity; (c) living conditions and efficiency in cities, integrating actions for reducing poverty in urban areas through improvements in habitability, efficiency, and environmental quality in cities; and (d) modernization of the State and institu -tional strengthening, with emphasis on the sub-na-tional areas of government.14 These
areas were defined broadly enough to accommodate a wide variety of programs.
13 3 Relevance T able 2. IDB’ s F inancing Impor
tance for Brazil
INDICA T ORS UNIT 2007 2008 2009 2010 A verage B razil A ppr ov als / Total IDB A ppr ov als (in per cent of IDB A ppr ov als) 18% 28% 19% 18% 21% B razil D isbursement / Total IDB D isbursements (in per cent of IDB D isbursements) 26% 18% 22% 21% 22% Total A ppr ov als / GDP (in per cent of GDP) 0,12% 0,19% 0,18% 0,11% 0,15% Total D isbursement / GDP (in per cent of GDP) 0,14% 0,10% 0,18% 0,11% 0,13% Total A ppr ov als in P A C sectors / P A C (in per cent of P A C) 12% 25% 16% 6% 14,91% Total D isbursement in P A C sectors / P A C (in per cent of P A C) 13% 16% 14% 5% 11,73% Total F ederal A ppr ov als / Total P rimar y E xpen -ditur e F ederal G ov ernment (in per cent of Total P rimar y E xpenditur e F ed -eral G ov ernment ) 0,01% 0,03% 0,06% -0,03% Total Federal D isbursements / Total Primar y E xpenditur e F ederal G ov ernment (in per cent of Total P rimar y E xpenditur e F ed -eral G ov ernment ) 0,04% 0,03% 0,01% 0,01% 0,02% Total State and M unicipality A ppr ov als / Total Primar y E xpenditur e S tates and M unicipalities (in per cent of Total P rimar y E xpenditur e S tates and M unicipalities ) 0,07% 0,79% 0,80% 0,89% 0,64% Total S tate and M unicipality D isburse -ments / Total P rimar y E xpenditur e S tates and M unicipalities (in per cent of Total P rimar y E xpenditur e S tates and M unicipalities 0,21% 0,16% 0,46% 0,33% 0,29% Total State and M unicipality A ppr ov als / T rans -fers fr om the federal go vernment (in per cent of Transfers fr om the federal go v-ernment ) 0,26% 2,70% 2,98% 3,25% 2,30% Total S tate and M unicipality D isbursements / Transfers fr om the federal go vernment (in per cent of Transfers fr om the federal go vernment 0,75% 0,56% 1,73% 1,19% 1,06% Total D ev elopment B anks A ppr ov als /F ed -eral go
vernment transfers to public financial
institutions
(in per
cent of Loans to public financial
institutions) 72,7% 6,0% 1,9% nr 26,87% Total D ev elopment B anks D isbursements /
transfers to public financial institutions
(in per
cent of Loans to public financial
institutions) 68,7% 0,9% 2,0% 1,7% 18,33% A ppr ov
als to BNDES to BNDES loans
(in per
cent of BNDES's loan disbursements)
3% 2% 1% nr 2% D
isbursements to BNDES loans
(in per
cent of BNDES loan disbursements)
2,84% 0,30% 1,51% nr 2% A ppr ov als
To BNDES to BNDES SME cr
edit
(in per
cent of BNDES loans to MPMES R$
billion) 6,25% 4,55% 4,17% nr 4,99% D
isbursements to BNDES SME cr
edit
(in per
cent of BNDES loans to MPMES R$
billion) 5,91% 0,70% 4,29% nr 3,63% Sour ce: B ank ’s data war ehouse, IMF’ s Ar ticle IV (2010), Annual R epor ts (BNDES)
14 Country Program Evaluation: Brazil 2007-2010
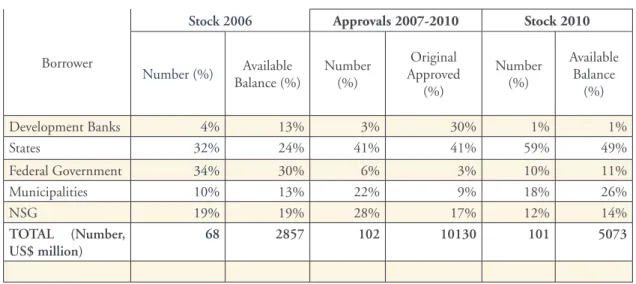
Table 3. Financing Stocks and Flows by Borrower
Borrower
Stock 2006 Approvals 2007-2010 Stock 2010
Number (%) Available Balance (%) Number (%) Original Approved (%) Number (%) Available Balance (%) Development Banks 4% 13% 3% 30% 1% 1% States 32% 24% 41% 41% 59% 49% Federal Government 34% 30% 6% 3% 10% 11% Municipalities 10% 13% 22% 9% 18% 26% NSG 19% 19% 28% 17% 12% 14% TOTAL (Number, US$ million) 68 2857 102 10130 101 5073
Source IDB’s data warehouse
Historically, the Bank has been the largest external development agency in Brazil, al-though it was surpassed by the World Bank during this period. However, both institu-tions remain small actors in terms of overall development financing in Brazil, and the country is in the driver’s seat. The Bank’s average annual approvals and disbursements were 0.15% and 0.13% of GDP (see Table 2 below). In contrast, from the point of view of the Bank, Brazil is the largest borrower: it accounted for 21% of total Bank lending and 17% of the total number of projects from 2007 to 2010. This asymmetrical relation has implied that the Bank has had to search for niches in the country over and above that of pure financing. These niches, more than the specific priority areas identified in the strategy, best describe the actions of the Bank between 2007 and 2010.
a. t
heB
ank’
sn
iChe: t
heB
usinessM
odelThe niches are embodied in a business model, evolving since 2006 at the request of the Government, led by the Ministry of Planning, Budget and Management. While the business model has not been formalized in any specific Bank documents, it can be deduced from the pattern of approvals.The model rests on three types of clients: (a) sub-national governments; (b) the National Bank for Economic and Social Development (BNDES) and (c) the private sector. This diversification of clients has allowed the Bank to maintain its relevance to the country in the face of declining demand for federal proj-ects and the small amount of Bank resources relative to the size of the country.
The consolidation of the business model is shown in Table 3. From 2007 to 2010 the dollar value of approvals was US$10.130 billion (102 projects) distributed as follows: Sub-nationals with 50% (63% of the number of loans), divided between states with
15 3 Relevance
Table 3. Financing Stocks and Flows by Borrower
Borrower
Stock 2006 Approvals 2007-2010 Stock 2010
Number (%) Available Balance (%) Number (%) Original Approved (%) Number (%) Available Balance (%) Development Banks 4% 13% 3% 30% 1% 1% States 32% 24% 41% 41% 59% 49% Federal Government 34% 30% 6% 3% 10% 11% Municipalities 10% 13% 22% 9% 18% 26% NSG 19% 19% 28% 17% 12% 14% TOTAL (Number, US$ million) 68 2857 102 10130 101 5073
Source IDB’s data warehouse
41% (41%) and municipalities 9% (22%); BNDES with 30% (3%), and the private sector with 17% (28%). The residual of 3% (6%) represented direct loans to the Federal Government. The difference in dollar value and number reflects differences in the aver -age size of the projects. Table 3 also shows the evolution and consolidation of the model in terms of the outstanding portfolio: comparing December 2006 to December 2010, the US$ value of the stock of federal loans decreased from 30% to 11% while the stock of loans to sub-national entities increased from 37% to 74%.15
Sub-national governments. Average annual approvals and disbursements by the Bank to sub-national governments represented about 0.64% and 0.29% of states’ and munici -palities’ primary expenditure. Direct lending to sub-national governments, both states and municipalities, has taken place either through umbrella operations which can be ap-plied to a number of entities, such as Profisco and Procidades,16 or through ad hoc specific
operations, and is a unique feature of the Bank’s business model in Brazil. In other coun-tries in which the Bank works with sub-national entities, lending is usually carried out through existing systems of fiscal transfers. For example, in Mexico, sub-national projects have been traditionally carried out through a budget line item (Branch 33) while Bano -bras, a second-tier federal public bank, transfers as grants and/or on-lends to sub national governments. In Chile, the Bank reaches sub-national entities through the country’s Na-tional Fund for Regional Development (FNDR), while in Colombia the Financiera de Desarrollo Territorial (FINDETER) on lends to sub-nationals. These models, based on lending to a national entity that on-lends to sub-national governments is not feasible in Brazil, since the country’s Fiscal Responsibility Law prohibits credit operations between different levels of governments. The portfolio in Argentina is perhaps the most similar to the Brazilian model. From 2007 to 2010 the Bank approved projects with four prov-inces; however, these represented only 8% and 11.4% of the total approvals in terms of number and dollar value, respectively. The Argentinean portfolio remains dominated by loans to the Federal government.
BNDES.Lending to the National Bank for Economic and Social Development, BNDES, a second tier public development bank, has been a mainstay of the Bank in Brazil. Over the period 2007-2010 Bank approvals (disbursements) of US$3 billion represented 2% (2%) of total BNDES lending, but accounted for almost one third of the total dollar value of Bank approvals to Brazil. In fact lending to BNDES has represented 26% of total cumulative lending to Brazil since 1995 (fluctuating between 22% and 30% for every four-year period since 1995). In no other country does one single borrower represent such a large proportion of total lending to that country. These loans were designed to 15 Between 2007 and 2010, the category “Development Banks” included only the BNDES. However, the outstanding stocks in 2006 and 2010 include a loan to Banco do Nordeste (BR- 0323, Prodetur II), a tour-ism loan for the Northeast Region) that was approved in 2002 for a value of US$240 million. The available balance in December 2010 was US$43 million.
16 Profisco was approved as a Conditional Credit Line (CCLIP) in November 2008 to improve tax and expenditure systems through direct loans to states. Procidades was approved in 2006 as a mechanism to finance municipal development projects through direct lending in local currency.
16 Country Program Evaluation: Brazil 2007-2010
co-finance BNDES existing credit line to small and medium, and in the last loan, micro enterprises. In 2009 alone, BNDES lent about US$96 billion, including US$13.6 billion in 387,000 individual operations to SMEs. Hence, Bank lending to BNDES is a very cost effective means to reach a large number of these enterprises. On a less systematic basis, in the past the IDB provided loans to Northeast Bank (Banco do Nordeste, BNB), which covers areas with a high prevalence of poverty. 17
Private sector. Operations with BNDES provide indirect support to the private sector. The Bank also lends directly to the private sector through non-sovereign loans (NSG). As in the case of the public sector, the Bank accounts for a very small part of financing to the private sector, but from the point of view of the Bank, Brazil’s private sector is an important client. Specifically, the country accounted for 28% of total dollar value of approvals and 20% of the number of projects from 2007 to 2010.18 The previous CPE
identified the need to align the NSG program with national priorities. Management agreed, “…pointing out that the programming work in Brazil has already been improved to encompass a more integrated approach, focusing on Bank’s group interventions.”19 However,
the incorporation of NSG into the country program document and its strategic align-ment with country priorities remains at odds with the Structure and Corporate Finance Department’s (SCF) ad hoc and opportunistic way to generate business. This modus operandi is inconsistent with presenting a list of potential projects over the program-ming cycle, but it could change. First, the future will likely involve the development of an inventory of infrastructure projects, particularly potential public-private partner-ships related to the World Cup (in 2014). This creates the opportunity for the sovereign and non-sovereign arms of the Bank to define a strategic orientation for NSG lending, aligned with national priorities without explicit listing of individual projects. Second, Brazil’s share of non-sovereign loans to the private sector (NSG) may have to take into account the changes that IDB-9 imposes, especially the emphasis placed on lending to C&D countries.20
17 There are four large development banks in Brazil, in addition to BNDES: Banco da Amazonia and Banco do Nordeste both sub- regional banks; and two others whose field of operations is national: Banco do Brasil and Caixa Economica Federal (CEF). BNDES, BB and CEF together supply 42% of all credit operations of the 50 largest banks.
18 These figures include private sector investment, private sector PST (TFFPs) and private sector supplemen-tary loans.
19 RE-355-1, paragraph 2.19.
20 Under IDB-8 (1994), the Bank launched the private non-sovereign window with a 5% of commitment limit, in 1998 the ceiling was changed to 5% of outstanding loan balance (excluding emergency loans), and in 2001 the ceiling was raised to 10% of the aggregate outstanding amount of loans and guarantees (excluding emergency loans). IDB-9 proposes replacing gradually the existing limit to one where risk capital requirements for NSG operations will not exceed 20% of Bank equity.
17
3 Relevance
B. s
eCtorandB
orrowerThis section looks at the relevance of delivery with respect to Brazil’s Program to Accelerate Growth (PAC), pro-poor targeting and IDB-9, by looking at sec -tors and borrowers. According to the sectoral classification used by the Bank (see Table III.2 in Annex), five sectors accounted for 81% of US$ value of ap -provals over the period: BNDES (30%), transportation (19%); potable water and sanitation (13%); public management (10%), and energy (9%). Thus, overall the Bank’s business in Brazil has been largely concentrated in infrastructure and credit to small and medium enterprises through BNDES. The sectoral classifica -tion is closely related to the type of borrower: transporta-tion loans were made to states (82%) and the private sector (13%) with the remaining 5% going to the Federal Government. Potable water and sanitation loans were made to the states (73%), municipalities (19%) and private sector (8%). Public management was largely directed at the states through Profisco (81%) with the rest to the Fed -eral Government. Ninety-nine percent of energy loans went to the private sec-tor (see Table III.3 in Annex).
Given the importance of non-sovereign loans in approvals, it is important to bring out their sectoral distribution: energy (52%), loans to commercial banks (20%), and transportation (15%). Together these represented 87% of private dollar approvals (see Tables III.4 and III.5 in Annex).
The sector distribution of the loans approved between 2007 and 2010, com-bining both the sovereign and non-sovereign portfolio, can be compared with the country’s own priorities, expressed in the Plan to Accelerate Growth (PAC). The PAC, approved at the end of 2006, is an investment program designed to overcome bottlenecks to growth, increase productivity, and reduce regional and social disparities through strategic investments. It also includes policy and institutional measures designed to improve the investment climate, promote access to credit, and reduce the fiscal burden. As shown in Table III.6 in Annex, PAC’s planned investments for 2007-2010 in the value of R$504 billion were dis -tributed among three key areas: logistical infrastructure, including roads, ports, and airports (12%); energy (54%) and social and urban infrastructure (34%). The corresponding Bank portfolio, in contrast, was distributed in the following man-ner; transportation (19%), energy (9%) and social, urban infrastructure, includ -ing water and sanitation (22%). Thus, with the exception of the energy sector, the Bank’s sectoral focus has been consistent with PAC priorities; its approvals and disbursements in these priority sectors represented an average of 15% and 11% of the Federal Government’s expenditure on PAC, respectively.
The sectoral composition of the portfolio is not particularly useful in judging the rel-evance of the Bank’s delivery with regards to pro-poor interventions, an objective shared by the Bank and the country. For example, the Bank’s project Proacesso (BR-L1027)
18 Country Program Evaluation: Brazil 2007-2010
is classified as an infrastructure-transport project, which finances the construction and rehabilitation of roads in poor municipalities in the north of the State of Minas Gerais. To the extent that these roads increase access to markets and jobs, the resulting increase in household income may have sustained poverty reduction effects. In fact, under the PAC the government emphasizes the role of infrastructure in decreasing inequality and poverty.
The Banks pro-poor classification of projects into Poverty Targeted Investment (PTI) and Social Equity Enhancement (SEQ) provides a better measure of projects’ intent regarding poverty and equity. Comparing the 2006 and 2010 portfolios, the US$ value of pro-poor projects fell from 54% in 2006 to 46% by 2010. Approximately 88% of the municipal projects, 49% of states’ projects, 2% for Federal and 0% private borrowers are classified as PTI/SEQ (see Table III.7 in Annex).
PTI lending can go to states and the private sector as well as to municipalities. An ex-ample is the project Proares, a PTI classified project, where the borrower is the State of Ceará. This project finances improvements in municipal social services, particularly for youth in poor municipalities. Capital Investments CELPA is a PTI-classified project to a private concessionaire for the distribution of electricity in the State of Pará. One of the project’s objectives was to expand access to electricity in rural areas as part of the federal government program “Light for Everyone” (Luz para Todos). Another alternative is for the Bank to work through regional development banks that cover poorer areas of the country, such as Banco da Amazonia and Banco do Nordeste.
The portfolio’s sectoral distribution can also be compared with IDB-9 priorities to judge relevance. IDB-9 sets targets for lending volumes for poverty reduction and equity en -hancement, climate change, and regional integration, as well as target outputs for the Bank’s contribution to Regional Development Goals in priority areas. Given Brazil’s weight in the Bank’s portfolio, regional targets are more likely to be met if the priority areas are incorporated in Brazil’s upcoming strategy. While the targets refer to future ap-The IDB financed the widening of the
Fernão Dias highway between the states of São Paulo and Minas Gerais.
19 3 Relevance
provals, not to the existing stock, a rough reclassification of existing stock of active proj -ects as of December 2010 reveals the challenge facing the Bank in its next programming cycle: poverty and equity account for 3% of the portfolio; climate and environment 13%; and regional integration 0% (see Table III.8 in Annex).21
There are new opportunities to meet these IDB-9 challenges. The Bank has been gaining experience in non-sovereign lending for green credit, an option to explore for private sec-tor non-sovereign loan projects but possibly also of interest to the country’s development banks.22 In the area of regional integration, BNDES, which currently lends approxi-mately US$35 million a year, has recently begun to expand its services in other countries. This suggests a potential opportunity for the IDB to collaborate with BNDES in the area of regional integration under the auspices of programs such as the Initiative for the Integration of the Regional Infrastructure in South America (IIRSA).
C. l
endingi
nstruMentsRelevance can also be judged by appropriate use of lending instruments. During this period, the Bank concentrated on loans to state and commercial banks that re-lend to private borrowers, “bricks and mortar”, and institutional strengthen-ing. Despite these differences, the Bank relied almost exclusively on investment loans. There was only one policy-based loan to the State of Bahia. This contrasts markedly with the instruments used by the World Bank, as discussed in a later section.
The type of investment loans utilized reflected the Bank’s business model with the country. Specifically, among sovereign loans there was an increase in um -brella operations (global multiple works, CCLIP, and sector facilities) which to -gether represented 47% of the dollar value of approvals. Taking into account loans that closed during this period, the stock of umbrella operations increased from 7% in number in 2006 to 31% in 2010 (see Table III.9 in Annex).
While the business model in Brazil contrasts sharply with the Bank’s typical approach in other countries, the corporate modus operandi, i.e. use of its own systems for sov-ereign loans, is still largely practiced in Brazil23. The business model combined with
the modus operandi has contributed towards low operational efficiency, as described in the next chapter.
21 Using the indicative classification in Table III.2 titled The Bank’s Strategic Priorities and its Relation to Ongoing Activities and Business Areas.
22 For an example see the project BESI Lending Facility (RG-L1038, July 2011), a project which is part of an indicative target of green lending of US$10 billion by 2015. In recent years there have been six “green” loans for a total of US$120 million.
4
The Brazilian government sees housing construction as a priority for driving economic growth and is focusing its efforts on the second stage of a subsidized program for low=income families.
21
Operational Efficiency
in Delivery
s
uMMaryIndicators of operational efficiency (time and cost) worsened and compared negatively with other coun-tries in Group A. This is largely due to:
■ The highest
propor-tion of financing was given to subnational governments. Efficiency indicators for state and municipal projects are more similar to the averages of B, C and D countries;
■ Little standardization
of “umbrella” programs (e.g. Procidades);
■ Almost exclusive use of
investment loans;
■ Limited adoption of
national systems.
Operational ef
ficiency is concerned with the Bank’s delivery
of services to its clients. The previous CPE argued that delays
in both preparation and disbursement periods, compared to
Bank averages, were a distinctive feature of doing business in
Brazil. It also noted the slow progress in adopting country
sys-tems. Both of these represent priorities under IDB-9.
a. P
ortfolioP
erforManCeDelays in project preparation have generally worsened relative to other countries,
as shown in Table 4 below. Project preparation time in Brazil (from pipeline to ap
-proval) increased from an average of 20.3 months (2000-2006) to 21 months (2007-2010), while the Bank average declined from 18.6 to 17.6 months. The reduction
in the average for A countries, suggested by Management to be a more relevant
comparator group, was even more marked, declining from 18.3 to 15.9 months and
thus widening the gap with Brazil. The time between approval and eligibility as well
as the time between eligibility to first disbursement were reduced in Brazil, but re -mained above both the Bank average and the A countries’ average.
Preparation costs per US$ million approved decreased from US$2,522 (2000-2006) to US$1,956 (2007-2010), but remained above the average for A countries. Execu
-tion costs per million disbursed increased significantly between the two periods, from US$939 to US$1,570, while the average for A countries declined from US$992 to US$885. In other words, the increasing gap is due to a combination of improved
performance in other countries and a worsening in the Brazilian portfolio.
These indicators should be treated with caution as measures of operational inefficiency of
the Bank in Brazil. Longer periods and higher costs were to be expected given the Bank’s new business model in the country, emphasizing direct lending to sub-national entities.
Such a model involves smaller size loans; lending to authorities with little to no expe
-rience working with the Bank; having counterparts with generally weaker institutional
22 Country Program Evaluation: Brazil 2007-2010 Table 4. O perational Efficiency I ndicators Aggr egate 2000-2006 2007-2010 Inde x D escr iption B razil A Countries* B Countries C&D countries B ank B razil A Coun -tries* B Countries C&D countries B ank Pr eparation T ime Fr om pipeline to appr ov al (months) 20.3 18.3 16.8 18.9 18.6 21.0 15.9 16.2 17.4 17.6 Fr om A ppr ov
al to first elegibility (months)
15.2 10.3 8.8 12.4 11.7 11.6 8.7 6.1 8.8 8.9 Fr
om first elegibility to first disbursement
(months) 3.3 1.7 1.7 0.9 1.3 1.6 1.2 0.8 1.1 1.2 Cost Pr
eparation cost (per US$ million
appr ov ed) 2,522 1,634 3,155 6,204 3,306 1,965 972 2,367 4,162 2,198 E
xecution cost (per US$ million disbursed)
930 992 1.893 7,585 2,481 1,570 885 3,110 5,568 2,378 B y Borr ow er 2007-2010 0,59 13,2 7,2% Index D escr iption Federal* States M unicip . N otes: O nly loans. E xcluding: E mergency Loan, P riv ate S ector Loan, P roj -ect Pr eparation Facilities.; A* Countries: Argentina, M exico, and V ene zu -ela. Federal;* denotes that it includes BNDES. Information of Pr eparation Costs since 2003. Information of E xecution Costs since 2002. Sour ce: B ank ’s data war ehouse Pr eparation T ime Fr om pipeline to appr ov al (months) 18.4 20.2 25.2 Fr om A ppr ov
al to first elegibility (months)
14.6
10.5
13.6
Fr
om first elegibility to first disbursement
(months) 5.6 0.8 0.6 Cost Pr
eparation cost (per US$ million
appr ov ed) 546 2,179 6,238 E
xecution cost (per US$ million disbursed)
551
2,375
23 4 Operational efficiency in delivery
capacity than the federal government; and having to fulfil the requirements of the Fiscal Responsibility Law. While compliance with the law represents an incentive for good fis -cal management at the sub-national level, it increases preparation time, uncertainty and costs. Sub-national entities must demonstrate compliance with the law at two different points in time: initially when presenting a proposal to the agency in the Ministry of
Plan-ning (SEAIN/COFIEX) responsible for authorizing its presentation to the Bank and again once technical preparation is complete and prior to official negotiations with the Bank.
Municipalities often lack knowledge about the documentation and processes required for compliance.
As expected, preparation time from pipeline to approval, the period most affected by
country requirements, was longer for state (20.2 months) and municipal (25.2) projects than for federal ones (18.4 months). However, the major effect of the consolidation of
the business model was on costs. Loans to sub-national entities are on average smaller
(see Table IV.2 in Annex).24 Preparation costs for state and municipality projects were
US$2,179 and US$6,238 per million dollar disbursed respectively, compared to US$546 for federal loans Execution costs were US$2,375 and US$7,140 compared to US$551 for federal loans (see Table IV.3 in Annex). These figures suggest that the relevant comparators
for the Brazilian portfolio are not other A countries, but B countries for state level loans and C&D countries for municipal level loans, in which case the Brazilian portfolio is more in line with costs and times.
The expectation that umbrella type sub-national projects, such as Procidades and
Profisco, would be more time and cost effective has not been uniformly borne out. In the case of Procidades, preparation times were slightly shorter than for municipal
projects as a whole, but preparation costs per US$ million approved were 25% high -er. In the case of Profisco, preparation times were significantly shorter than for state
projects as a whole, but execution costs per US$ million approved were double (see
Table IV.3 in Annex).
Management’s response to the previous CPE’s findings of low op