By
Anuj K. Pradhan
Department of Mechanical & Industrial Engineering University of Massachusetts Amherst, MA 01003 Telephone: 413-545-3393 Fax: 413-545-1027 Email: [email protected] Kim R. Hammel
Department of Mechanical & Industrial Engineering University of Massachusetts Amherst, MA 01003 Telephone: 413-545-3393 Fax: 413-545-1027 Email: [email protected] Rosa DeRamus
Department of Mechanical & Industrial Engineering University of Massachusetts Amherst, MA 01003 Telephone: 413-545-3393 Fax: 413-545-1027 Email: [email protected] Alexander Pollatsek Professor Emeritus Department of Psychology University of Massachusetts Amherst, MA 01003 Telephone: 413-545-2650 Fax: 413-545-1027 Email [email protected] David A. Noyce Professor Department of Transportation University of Massachusetts Amherst, MA 01003 Telephone: 413-545-2509 Fax: 413-545-1027 Email: [email protected] Donald L. Fisher Professor
Department of Mechanical & Industrial Engineering University of Massachusetts
Amherst, MA 01003 Telephone: 413-545-1657 Fax: 413-545-1027
Paper Number: 03-4478 Review Committee: A3B02
Prepared for 82nd Annual Meeting of the Transportation Research BoardWashington, D.C. January 2003 Length of Paper:
6049 words, 3 figures @ 250 words each 6799 equivalent words
ABSTRACT
Younger, novice drivers (16 year olds with 6 months driving experience or less) continue to have the highest fatality rates. In the past, this was attributed to increased risk taking or undeveloped psychomotor skills necessary for driving. More recently, the high fatality rate has been attributed to the relative inability of younger, novice drivers to acquire and assess information relevant to the recognition of inherently risky situations. The current study seeks to determine whether this is the case by recording participants’ eye movements while they drove through a total of sixteen risky scenarios in an advanced driving simulator. Seventy-two participants (24 younger, novice drivers; 24 younger, experienced drivers; and 24 older, experienced drivers) were run. Some scenarios were designed so that an element of information vital to safe navigation of the situation was either obscured or occluded from the driver’s view during approach. Other scenarios required the driver to deduce a chain of events for appropriate navigation of the vehicle, where all elements contributing to the events were clearly visible. In either case, the participant’s point of gaze (recorded in real time) was assumed to indicate whether he or she had successfully acquired the appropriate information. It was hypothesized that the younger, novice drivers would recognize the risks least often and that the older, experienced drivers would recognize the risks most often. The results indicate significant age related differences in driver scanning behavior consistent with the hypotheses. Keywords: Driver Behavior, Risk Perception, Younger Drivers, Older Drivers, Eye Tracker
INTRODUCTION
Younger, novice male drivers (sixteen year olds with at most six months of driving experience) are some nine times more likely to be involved in a fatal crash (per 100 million miles of vehicle travel) than the drivers in the safest cohorts, those between the ages of 45 and 60 (1). Younger, novice female drivers (again, 16 year olds) are almost four times more likely to be involved in a fatal crash than the drivers in the safest cohorts (see Figure 1). Perhaps the most frequent explanation for this increased involvement is that younger, novice drivers have not yet reached the emotional maturity of their older counterparts, yielding the hypothesis that obvious risk taking behaviors such as drunk driving or excessive speeding are to blame. However, the statistics do not bear this out. Intoxication, for example, is a factor in less than 15% of young adult (16-20 years of age) traffic fatalities, a ratio smaller than that recorded for older adults (21-24 years of age: 27%, 25-34 years of age: 24%, 35-44 years of age: 22%) (1).
More recent studies have focused on teenage drivers' ability to acquire and assess information relevant to the recognition of risks in the road ahead (1,3,4). In one study (5), up to 70% of all novice driver crashes have been attributed to the lack of driver experience. Perhaps one of the most direct ways to determine whether experience improves drivers' ability to recognize risks is to record drivers' eye fixations. The early, pioneering research indicates that novice drivers do not scan as widely as do more experienced drivers (6), perhaps missing the peripheral risk relevant elements in a scenario. But, since fixations on such elements were not reported, we do not know whether the two groups of drivers were paying equal attention to these elements. The current study seeks to extend the earlier research by comparing the scanning behaviors of novice teenage drivers (drivers 16 and 17 years old with six months or less of driving experience) and more experienced drivers nineteen to twenty-nine years of age while the two groups are driving through a variety of scenarios in which the risk relevant elements are clearly defined. Drivers who do not gaze at the risk relevant elements may fail to appreciate the potential dangers. For example, the occluding edges of a bus parked on the side of the road to let off passengers should command a considerable amount of attention from appropriately cautious drivers and such drivers should in general be more likely to fixate, say, the front of the bus (one risk relevant element in this scenario). We hypothesize that the younger, novice drivers will scan the risk relevant elements less often than the more experienced younger drivers, an indication that they are also failing to predict the risks entailed by these relevant elements.
If eye fixations on a risk relevant element are indeed a measure of drivers' appreciation of the risk creating potential of that element, then drivers' fixations on risk relevant elements ought to increase with experience and therefore age, especially among older drivers 60 – 75 years of age. However, other factors besides experience influence performance among older adults. Specifically, older drivers are physically not as capable as the younger drivers. Moreover, they experience a decline in their general physiological abilities, such as vision (7) and reaction time (8), and a reduction in the useful field of view (UFOV), a measure of visual attention and processing speed (9). In order to compensate for these problems, older drivers in general are more cautious, for example, following at longer distances (10) or traveling at slower speeds (11), as well as avoiding risky situations, such as rush hour traffic and nighttime driving (12) But, in what may be an apparent contradiction to this increasing caution, older drivers are observed to scan scenes of traffic scenarios less broadly than younger, experienced drivers, at least when sitting still (13). However, we do not know whether older adults are concentrating their attention on the elements most likely to signal risk or, instead, are missing those elements altogether. Given the generally more cautious behavior of older drivers, we hypothesize that they do take much more care to scan the risk relevant elements in a scenario and try to predict ahead where dangers will occur. Thus, we hypothesize that drivers 60-75 years of age are even more likely than young experienced 19-29 year old drivers to scan for risk relevant elements.
In summary, we hypothesize that younger, novice drivers will scan the environment ahead for the critical risk relevant elements less frequently than younger, experienced drivers because the younger, novice drivers are simply unaware of potential problems. And we hypothesize that older drivers 60-75 years of age will scan the environment for risk relevant elements more than the younger, experienced drivers both because they have more experience and because they are aware that they need to compensate for a decline in visual, motor and cognitive skills.
EXPERIMENT
In order to test the above hypotheses about the deployment of attention, we measured the eye movements of drivers in risky scenarios. Clearly, it is difficult if not impossible to do so on the open road. However, today’s advanced driving simulators make it possible to expose drivers to risks in realistic scenarios without also endangering those drivers. Specifically, we used a fixed-base driving simulator surrounded by three screens in front. Participants sat in an actual car, a 1995 Saturn, and maneuvered through the virtual environment displayed on the three screens in
front of the car just as they would through the real environment. A head mounted eye tracker was used to record the position of their eyes throughout each scenario.
We created a set of 16 risky scenarios. A subset of these scenarios is described in detail below. In each case, areas of the visual field were identified prior to testing as critical to the determination that the scenario is a risky one. For example, in one scenario a truck was parked by the side of the road. It obscured potential pedestrians in a crosswalk. We noted whether drivers fixated the area just in front of the truck as they passed by the truck (the risk relevant element). This would indicate that the driver had some understanding of the potential for risks to materialize in front of the truck. It is important to note that the actual risk was never allowed to materialize in a scenario. For example, in the parked truck scenario described above, a pedestrian could have walked out from in front of the truck impeding the participant driver, but we never allowed such an event to occur. We worried that if we were to let risky events materialize, drivers would become over attentive to the occurrence of such events. Moreover, the extent to which the simulation departed from reality would be magnified were such events to occur because crashes would not have the consequences on the simulator that they do in the real world.
Subjects
A total of 72 participants were run in the experiment (24 younger, novice drivers in their first 6 months of driving experience, all 16 or 17 years old; 24 younger, experienced drivers, 19-29 years old; and 24 older, experienced drivers, 60-75 years old). The average age of the each group was 16.3, 21.3, and 66.9 years respectively, with standard deviations of 0.4, 2.2, and 6.4 years. All participants were licensed or permitted drivers. They were recruited from among the students and staff at the University of Massachusetts and Amherst Regional High School, and by flyers posted around the city of Amherst and surrounding areas.
Materials
Driving Simulator.
The driving simulator includes a Saturn sedan, as noted above, and the driver operates its controls just as he or she would in any vehicle on the open road. The visual world is displayed at a resolution of 1024 X 768 pixels on each of three different screens, one in front of the car and two on each side. The semicircular arc formed by the screens around the driver subtends 150 degrees in the horizontal direction and 30 degrees in the vertical direction. As the driver turns the wheel, brakes or accelerates, the roadway that is visible to the driver changes appropriately. The images themselves are updated 60 times a second, using state of the art Silicon Graphics computers (including a Silicon Graphics Infinite Reality Engine). The sound system for the simulator is controlled by another computer, the Acoustetron, and consists of four speakers, two mid/high frequency speakers located on the left and right sides of the car and two sub-woofers located under the hood of the car. The system provides realistic road, wind and other vehicle noises with appropriate direction, intensity and Doppler shift.
A visual database-modeling tool (Designer's Workbench, Centric Software) is used to build virtual worlds that include freeway, rural and suburban sections as well as intersections, parking lots, and other roadway geometries. Buildings can be efficiently represented by only those surfaces that would be visible to the subject while operating on an adjacent roadway. Similarly, tree lines and forests need only be represented as they would appear to the subject while in the simulator. In addition to populating the visual database with static objects (buildings, signs, etc.), it is possible to program the movement of a test vehicle or to coordinate the movement of other vehicles, pedestrians and signals with the movement of the driver's vehicle. To do such, we have software,
Real Drive Scenario Builder (Monterey Technologies), which greatly facilitates the coordination. Vehicles can be
programmed to move along road surfaces at a normal speed (1-120 mph) under computer or workstation control. Motorized vehicles have the appropriate number of light points to represent headlights, parking lights, turn signals and stoplights. Pedestrians can be programmed to move along other surfaces as well.
Eye Tracker
The eye tracker used in this study was the ASL Series 5000 with head mounted optics. This unit is able to sample the eye position at 60 Hz and allows the subject’s head a full range of motion. The system converts eye position to external point of gaze by superimposing cross hairs upon a video of the scene that is being viewed by the subject. Additionally, the unit records a host of other data relevant to scanning behavior and pupil size. Participants, especially older adults, will sometimes complain that the unit is too heavy, but no one ever discontinued the study because of problems with the weight of the eye tracker.
Design
Each participant drove four blocks, where each block contained four risky scenarios all joined by one continuous section of roadway. Thus, the participants were exposed to a total of 16 different risky scenarios. Between the four scenarios in a block, the driver had to navigate varying roadway geometries, traffic patterns and traffic signs and signals. These sections between scenarios were meant to represent the relatively easy, risk free driving conditions that are more symptomatic of everyday traffic. For a complete counter-balancing of the order in which the blocks were presented to subjects in a group, we needed 24 subjects for each of the three groups.
Procedure
The participants were asked to fill out an informed consent form. They were then given written instructions about the experiment. In the instructions, the subjects were told to follow a particular vehicle (the lead vehicle) throughout the drive and were asked to maintain a 3 second following distance between the lead vehicle and themselves. After the participants read the instructions, they were asked if they had any other questions about the study. The
participants were then fitted with a head mounted eye-tracker and asked to get into the driving simulator. A
calibration routine for the eye-tracker was carried out after which the participant was given a test drive with a visual database built for that purpose. The test drive incorporated possible roads, signs, and vehicular and pedestrian traffic that the participant might encounter in the actual blocks. The participants were allowed to take as many test-drives as they wished to get comfortable with the simulator. Participants spent on average about 10 minutes in this practice phase. The participants then drove through the blocks in the necessary order while data was recorded both from the eye tracker, for eye movements and other eye data, and from the driving simulator, for vehicle velocities, vehicle coordinates, and other vehicle data. Each block took about eight minutes to drive. After the four blocks were driven, the participants were asked to fill out a payment voucher and were debriefed.
Scenarios and Dependent Variables
A complete record of the position and velocity of the vehicle was obtained 60 times per second as well as a complete record of the areas where the subjects were fixating (the point of gaze). In this report, we will concentrate on the use of eye movements to index safe behavior, although we also include two gross measures of the car position (e.g., whether the participant's car stopped before reaching a specific target such as a crosswalk) as indices of safe behavior. All 16 scenarios that we developed can be viewed on the web (www.ecs.umass.edu/hpl) by clicking on the Link Foundation button on the left side. Of the 16 scenarios that were developed, we will describe only six partly due to space limitations (also see Discussion):
• Right Turn with Walk Signal: The driver is approaching a red light at an intersection behind two other vehicles. The vehicle directly in front of the driver has its right turn signal on. There is a pedestrian on the right sidewalk. When the light turns green the first vehicle (the lead vehicle) goes straight through the intersection, and the second vehicle turns right. At the same time that the second vehicle turns right, the pedestrian crosses the intersection from the right, making it necessary for the right-turning vehicle to brake/slow down suddenly. The key dependent variable in this scenario is whether the driver fixates in the region of the pedestrian, as this indicates that the driver is likely to have deduced the probable risk.
• Intersection with Hidden Sidewalk: This is a four-way intersection that the driver and the lead vehicle are both approaching. The lead vehicle is signaling a right hand turn. There is a stop sign on the right, a stop line, and a pedestrian crosswalk. However, the sidewalk on the right side of the road is very difficult for the driver to see because it is almost completely hidden by a high hedge. Moreover, the stop sign and pedestrian crossing are located much before the actual intersection, making it necessary for the driver to stop at the stop line in front of the pedestrian crossing, and then creep up to the intersection to get a clear view of approaching traffic from the left. In this scenario, the key dependent variable is whether the driver stopped before the stop line or went over the pedestrian crossing and stopped only at the edge of the intersection.
• Truck Left Turn: The driver and lead vehicle approach a signalized four-way intersection. They are heading straight through the intersection and have a green light. There is a truck in the left turn lane just before the intersection signaling that it wants to make a left turn. When the driver passes the truck on the left, the truck blocks the driver's view of any traffic in the opposing lane across the intersection. The key dependent variable in this scenario is whether the driver fixates near the right occluding edge of the truck on the left. Such fixations would indicate that the driver is cognizant of a possible risk emerging from that hidden area.
• Reverse Truck Left Turn: The driver and lead vehicle are approaching a four-way intersection, where the lead vehicle wants to make a left turn. In the opposing lane across the intersection, there is a truck with its left turn
signal on, indicating that the truck intends to make a left turn. The approaching truck effectively hides any incoming traffic behind or to the left of it (from the participant driver's perspective). Safe driving behavior would be to scan the opposing lane at the left occluding edge of the truck for hidden traffic as the driver is taking the left turn. The key dependent variable is whether the driver fixates in the region around the left edge of the truck.
• Curved Stop Ahead: There is a gently curving road to the right with an intersection and a stop sign at the end of the curve. At the beginning of the curve, there is a Stop Ahead sign. The stop sign at the end of the curve is partially hidden by trees and bushes and is visible only as the driver is at the end of the curve. There are two key dependent variables in this scenario: (a) whether the driver fixates near the Stop Ahead sign; and (b) whether the driver actually stops at the stop sign.
• Truck Parked in Front of Crosswalk: There is a truck parked on the right side of a two lane straight stretch of road in a suburban neighborhood immediately before a pedestrian crosswalk marked with standard pavement striping. As the driver approaches the truck to pass to the left of it, there is an approaching vehicle in the opposing lane. The key dependent variable is whether the driver fixates near the left front edge of the truck. A safe driver would be expected to recognize the occluded part of the road in front of the truck as a possible risky area and scan the left front edge of the truck for possible pedestrians while approaching and passing the truck.
RESULTS
Overall, 25.82% of the younger, novice drivers engaged in behaviors which indicated that they recognized the risks in a scenario, 40.14% of the younger, experienced drivers engaged in such behaviors, and 69.59% of the older drivers engaged in such behaviors. Using a simple sign test, we can reject the hypothesis that the performance of the younger, experienced drivers is identical to that of the younger, novice drivers across all seven measures of risk recognition behavior (p < .01). And we can reject the hypothesis that the performance of the older drivers is identical to that of either the younger, experienced drivers or the younger, novice drivers (p < .001 for both comparisons). Below, we report a series of separate statistical tests for each scenario.
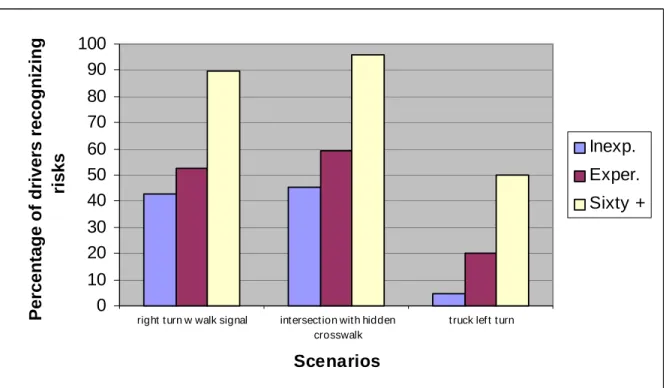
For the first scenario, Right Turn with Walk Signal, the key dependent variable was whether there are any fixations on the pedestrian to the right. We observed that 89.5% of the older drivers made a fixation in this region versus 42.9% and 52.4% for the younger novice and experienced drivers, respectively (see Figure 2). The difference between the younger novice and experienced drivers was not significant; however both younger groups were significantly different from the older group (t-test: novice, p < .001; experienced, p < .001)
In the Intersection with Hidden Sidewalk scenario, the key dependent variable was whether the driver stopped at the stop line, or went beyond it. The younger, novice drivers stopped at the stop line 45.5% of the time, as compared to 59.1% of the younger, experienced drivers and 95.7% of the older drivers. Again, there was no significant difference between the younger novice and experienced drivers, but both were significantly different then the older drivers (novice, p < .001; experienced, p = 0.0025).
For the Truck Left Turn scenario, 4.5% of the younger, novice drivers scanned beyond the right edge of the truck as compared to 20.0% of the younger, experienced drivers and 50.0% of the older drivers. Again, the
difference between the two younger groups was not significant, but the differences between both younger groups and the older drivers were significant (novice drivers, p < .001; and experienced drivers, p = 0.048).
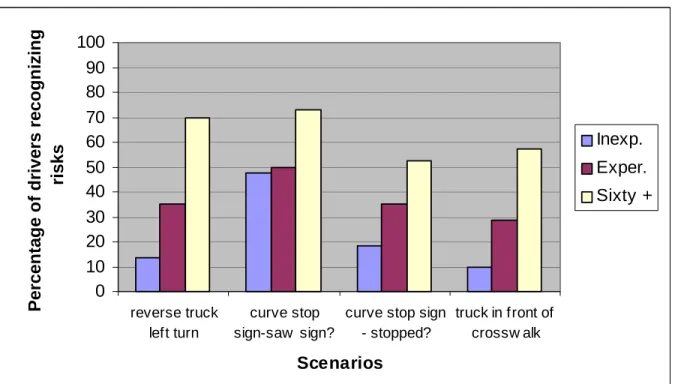
The dependent variable in the Reverse Truck Left Turn scenario is whether the driver scans beyond the left occluding edge of the truck. In fact, 13.6% of the younger, novice drivers, 35.0% of the younger, experienced drivers and 70.0% of the older drivers scanned the critical area (see Figure 3). As before, only the differences between the two younger groups and the older drivers were significant (novice drivers, p < .001; and experienced drivers, p = 0.026).
In the Curved Stop Ahead scenario, the two dependent variables were: a) whether the Stop Ahead sign was fixated; and b) whether the driver stopped short of the cross walk. On the first measure, 47.6% of the younger, novice drivers looked at the sign, as compared to 50.0% of the younger, experienced drivers and 72.7% of the older drivers. Though a trend is clearly present here, none of the differences were significant at the p = .05 level. On the second measure, 18.2% of the younger, novice drivers, 35.0% of the younger, experienced drivers and 52.2% of the older drivers actually stopped at the stop line. Only the difference between the younger, novice and older drivers was significant (p = .017).
Finally, in the Truck Parked in Front of Crosswalk scenario, 9.5% of the younger, novice drivers scanned beyond the left edge of the parked truck, as compared to 28.6% of the younger, experienced drivers and 57.1% of the older drivers. Again, only the difference between the younger, novice and elderly drivers was significant (p < .001).
DISCUSSION
The data indicate significant differences in the overall performance among the three groups whose analyses we reported above (using a simple sign test across all seven measures of risk recognition). Moreover, on all of the individual risk recognition measures, it is clear that the older drivers are both (a) looking more often at areas in which risky events could occur and (b) responding accordingly by stopping more quickly than the other two groups. Similarly, on all measures, the younger, experienced drivers are showing more recognition of the potential risks than the younger, novice drivers. Although the differences were significant overall between any pair of groups, when individual measures were considered this was not always the case.
As noted earlier, we actually ran participants in a total of 16 scenarios. Data were not available from two (because the point of gaze cannot be accurately determined when the head is in motion, as was the case in the two scenarios in question). Of the 12 out of 14 scenarios in which we actually gathered data (this includes the six we reported above), one and the same pattern was observed: the younger, novice drivers always were less safe than the younger, experienced drivers who, in turn, were always less safe than the older drivers. In one discrepant scenario we did not report, the younger, experienced drivers are slightly less safe than the younger, novice drivers and in the second discrepant scenario the older drivers were less safe than the younger, experienced drivers. In these two discrepant scenarios the number of good observations is very small and so we do not know yet whether what we are observing is something real, or simply the result of noise.
Five aspects of the results deserve particular mention. First, we were surprised that the differences between novice and experienced younger drivers weren't bigger than the ones we observed between the younger and older experienced drivers since the reduction in fatality rates is largest over the first year of driving. However, it is difficult to know exactly what size differences in our measures would correspond to the observed differences in fatality rates between these two groups. Thus, the additional scanning that the younger, experienced drivers do may be enough to cause a large reduction in the fatality rates. Moreover, the older adults may actually be doing more scanning than would be helpful for the younger, experienced drivers because the older adults need to compensate for losses in vision.
Second, we need to think more about our hypothesis that younger, novice drivers cannot predict risks as well as more experienced drivers. Perhaps they can predict such risks, just not when controlling the vehicle. However, in this regard it is important to note that all novice drivers had many hours behind the wheel before they ran in the experiment. Studies show that after as few as two hours novice drivers control the car just well as do more experienced drivers (14). There is a related argument one could make. In particular, in our experiment not only were drivers required to navigate the roadways, but they were also required to follow a lead vehicle, keeping a headway of three seconds. However, the three second headway was not strictly enforced nor was it meant to be. Rather, the primary purpose of the lead vehicle was to serve as a guide through the database. If the distance between the lead vehicle and the driver became too great, then the lead vehicle simply slowed down and waited for the driver. Participants therefore did not overly focus on maintaining the three second headway between their vehicle and the lead vehicle. Thus, while we cannot rule out the fact that novice drivers might have been better able to predict risks ahead in some scenarios if they had not been asked to follow a lead vehicle, we do not think that it would have contributed to the problems they had in most scenarios.
Third, we need to think more about our hypothesis that older drivers are focusing more often on risks than younger drivers because they are compensating for losses in other functions important to driving. Recent studies report that older drivers take much longer to scan a traffic scene for a sequence of numbers embedded in that scene (13). Perhaps older drivers are compensating for actual changes in scanning ability, not just for changes in other functions. This would make all the more likely their observed overcompensation since the older drivers would immediately notice the benefits of more narrowly confining their search to the risk relevant elements in a scene. We also need to make clear why we believe that the increased scanning among the older adults is actually compensating for a loss of function. These drivers have a fatality rate almost identical to the younger, experienced drivers between the ages of 20 and 25 (Figure 1). Presumably, the fatality rate of the older drivers is not smaller than that of the younger drivers, even though the older drivers show more awareness of the risks, because of decreases in the older drivers' cognitive, perceptual and motor status. We would argue that the increasing risk awareness just compensates for changes in this status.
Fourth, we can ask what implications the above findings have for the use of training to remediate the problems that we have identified above for the younger, novice drivers. Needless to say, it would be nice to know that the differences we observed between the younger novice and experienced drivers were reliable for each
prediction ability. However, at a minimum, we could provide younger, novice drivers with exposures to the full range of potentially risky situations. The AAA Foundation for Traffic Safety has a training program designed to do just this. It is a PC-based, risk awareness training program. Evaluations of the effectiveness of this program on a driving simulator suggest that it can increase the risk awareness of younger drivers (1). However, it provided a somewhat limited gain. For example, whereas none of the untrained younger drivers braked in the Truck Left Turn Scenario, thirty percent of the trained drivers braked there. However, that is still a relatively small percentage given we would like all trained drivers to brake. Thus, it is clear that more than mere exposure to risky scenarios will be required. Rather, it would appear that training must demand of the younger drivers some more active prediction of the risks ahead.
Fifth, the mechanics of successful driving are certainly a more complicated matter than simple eye movements can reveal. The results reported herein use the point of gaze (or fixation) as the major dependent variable indexing attention allocation. Although it is true that a driver's point of gaze is not necessarily the focus of his or her attention, a significant amount of research has shown that when there is a disparity between the point of gaze and the focus of attention (i.e., a region is being processed parafoveally or peripherally), the subsequent fixation tends to be on or near the attended region (15). We believe that it is highly unlikely that an individual would make various eye movements in an environment without at least once fixating a critical region of the visual field (such as a signal of a risky event) even if the risk were first detected in the periphery.
CONCLUSIONS
Younger, novice drivers can be as much as nine times more likely to die in a crash as drivers between 20 and 65 (1). It has been hypothesized that the primary reason for this comparatively high fatality rate is younger drivers' inability to attend to the risk relevant elements in a scenario as it unfolds. However, there has been no direct test of this hypothesis to date. For example, other investigators have looked at the differences in the behavior of vehicles driven by younger, novice and younger, experienced drivers (1), inferring from this behavior whether the drivers were aware of the impending risks. However, the study reported herein is the first to determine whether drivers in the two groups differed in the extent to which they actually attend to the areas in which the risks may materialize, a much more direct indication that they have predicted the risk relevant elements of a scenario. We find that across scenarios, younger, novice drivers are indeed less likely to attend to risk relevant elements in a scenario. As we have discussed above, we believe that this has strong implications for training.
We also determined that older drivers between the ages of 60 and 75 are much more likely to attend to risk relevant areas than drivers in either of the younger groups. We know that older drivers are in general more cautious, having longer headways for example (e.g., Evans and Wasielewski, 1983). However, no studies have actually documented whether older drivers are able to predict specific areas of high risk in a scenario. We find that this is indeed the case. We further argued that the increased risk awareness in older adults helps them to compensate for certain losses in motor and perceptual functions. While this is true overall, it may be the case that among the cohort of older drivers risk awareness varies considerably. Thus, we could perhaps decrease older adults' fatality rates as well by appropriately targeting risk awareness training to those older adults who, for whatever reason, show little evidence of the compensatory scanning behaviors of the majority of their cohort.
ACKNOWLEDGMENTS
Portions of this research were funded by grants from the Link Foundation for Simulation and Training and the National Science Foundation (Equipment Grant SBR 9413733 for the partial acquisition of the driving simulator). REFERENCES
1. National Highway Traffic Safety Administration (2000). Traffic Safety Facts 2000: Young Drivers (DOT HS 809 336). http://www-nrd.nhtsa.dot.gov/pdf/nrd-30/NCSA/TSF2000/2000ydrive.pdf. Accessed Nov 13, 2002. 2. Fisher, D. L., Laurie, N. E., Glaser, R., Connerney, K., Pollatsek, A. and Duffy, S. A. The use of an advanced
driving simulator to evaluate the effects of training and experience on drivers’ behavior in risky traffic scenarios. Human Factors, 2002. In press.
3. Mayhew, D. R. and Simpson, H. M. (1995). The role of driving experience: Implications for training and
licensing of new drivers. Insurance Bureau of Canada: Toronto, Canada.
4. Ranney, T. A. (1994). Models of driving behavior: A review of their evaluation. Accident Analysis and
5. Gregersen, N. P. (1996). Young car drivers: Why are they over represented in car accidents? How can driver training improve their situation? (VTI Rapport 409A). Linkoping: Swedish National Road and Transport Institute.
6. Mourant, R. R. and Rockwell, T. H. (1972). Strategies of visual search by novice and experienced drivers.
Human Factors 14, 325-335.
7. Klein, R. (1991). Age-related eye disease, visual impairment, and driving in the elderly. Human Factors, 33, 521-526.
8. Salthouse, T. A. (1985). A theory of cognitive aging. Amsterdam: North Holland.
9. Ball, K. and Owsley, C. Identifying correlates of accident involvement for the older driver. Human Factors,
33, 583-596.
10. Evans, L. and Wasielewski, P. (1983). Risky driving related to driver and vehicle characteristics. Accident
Analysis and Prevention, 15, 121-136.
11. Wasielewski, P. (1984). Speed as a measure of driver risk: Observed speeds versus driver and vehicle characteristics. Accident Analysis and Prevention, 15, 89-103.
12. Kline, D. W., Kline, T., Fozard, J. L., Kosnick, W., Schieber, F. and Sekuler, R. (1992). Vision, aging and driving: The problems of older drivers. Journal of Gerontology, 47, P27-34.
13. Maltz, M. and Shinar, D. (1999). Eye movements of younger and older drivers. Human Factors, 41, 15-25. 14. Harootyan, L. S., Jr. (1969). The effect of experience on longitudinal and lateral control characteristics of
automobile drivers. Unpublished master's thesis, The Ohio State University.
15. Rayner, K. (1998). Eye movements in reading and information processing. Psychological Bulletin, 124, 372-422.
Table of Figures
FIGURE 1 Driver Fatality Rates by Age and Sex, 1996. ... 12 FIGURE 2 Percentage of Participants Recognizing Risks in Scenarios 1 – 3... 13 FIGURE 3 Percentage of Participants Recognizing Risks in Scenarios 4 – 6... 14
0
10
20
30
40
50
60
70
80
90
100
right t urn w walk signal int ersect ion wit h hidden
crosswalk
t ruck lef t t urn
Scenarios
P
e
rc
e
n
ta
ge
of
dr
iv
e
rs
re
c
ogni
zi
ng
risks
Inexp.
Exper.
Sixty +
0
10
20
30
40
50
60
70
80
90
100
reverse truck left turn curve stop sign-saw sign?curve stop sign - stopped? truck in front of crossw alk
Scenarios
P
e
rc
e
nta
ge
of
dr
iv
e
rs
re
c
ogni
z
ing
risks
Inexp.
Exper.
Sixty +