Q. Wang et al. (Eds.): ICSP 2009, LNCS 5543, pp. 212–223, 2009. © Springer-Verlag Berlin Heidelberg 2009
Business Value: A Case Study
Qi Li1, Mingshu Li2, Ye Yang2, Qing Wang2, Thomas Tan1, Barry Boehm1, and Chenyong Hu2
1
Universy of Southern California
{qli1,thomast,boehm}@usc.edu
2
Institute of Software, Chinese Academy of Sciences
{mingshu,ye,wq,huchenyong}@itechs.iscas.ac.cn
Abstract. For a software project to succeed, acceptable quality must be achieved within an acceptable cost, providing business value to the customers, and keeping delivery time short. Software testing is a strenuous and expensive process and is often not organized to maximize business value. In this article, we propose a practical value based software testing method which aligns the in-ternal test process with the value objectives coming from the customers and the market. Our case study in a real-life business project shows that this method helps manage testing process effectively and efficiently.
Keywords: value, business importance, risk, cost, testing, AHP.
1 Introduction
Cost, schedule and quality are highly correlated factors in trustworthy software development. They basically form three sides of an under-resourced triangle [1]. Companies are often faced with time and resource constraints that limit their ability to effectively complete testing efforts. This situation can often be improved by regarding the testing activity as an investment during the software life cycle [2]. Maximizing the value contribution of software testing can help us maximize the return on investment during the software testing phase. Managing software testing based on value consid-erations promises to deal with increasing testing costs and required effort [3].
Testing is one of the most labor-intensive activities in software development life cycle and consumes between 30% and 50% of total development costs according to many studies [3, 4]. Traditional testing methodologies such as: path, branch, instruc-tion, mutainstruc-tion, scenario, or requirement testing usually treat all aspects of software as equally important [5], however, in practice 80% of the value often comes from 20% of the software [2, 6, 7], like a Pareto distribution. As Rudolf Ramler mentioned in [3], testing’s indirect contribution to product value leads to a value-neutral perception of testing. The common separation of concerns between development and testing exacerbates the problem. Testing is often reduced to a purely technical issue leaving the close relationship between testing and business decisions unlinked and the poten-tial value contribution of testing unexploited. He also points out that the key challenge in value-based testing is to integrate two dimensions: aligning the internal test process with the value objectives coming from the customers and the market [3].
The objective of this research is to apply value-based test management at the sys-tem level of trustworthy software development. We propose a value-based software testing method to better align investments with project objectives and business value. This method can provide decision support for test managers to deal with resource allocation, tradeoff and risk analysis, and time to market initiatives and software qual-ity improvement and investment analysis. We also conducted a case study in a real-life project.
2 Related Work
Our work is primarily relevant to the research areas of Value Based Software Engi-neering, and Software Testing Methodology. The initial theory of Value Based Soft-ware Engineering unveils the fact that successful quality should be achieved at a level that makes all key stakeholders winners[8]. [8]introduces the “4+1” theory of VBSE. The center of the theory is the success-critical stakeholder (SCS) win-win Theory W [9, 10], which addresses what values are important and how success is assured for a given software engineering organization. The four supporting theories that it draws upon are utility theory, decision theory, dependency theory, and control theory, respec-tively dealing with how important are the values, how do stakeholders’ values deter-mine decisions, how do dependencies affect value realization, and how to adapt to change and control value realization. The basic idea of value-based testing is a branch of value-based Verification & Validation (V&V) which is to treat each V&V activity (analysis, review, test) as a candidate investment in improving the software develop-ment process and ensuring that a software solution satisfies its value objectives [11].
Risk-based testing [12, 13], value-based testing [3] and value-based quality analy-sis [14, 15] are process strategies that are the most related with our research objective. Stale Amland introduces a risk-based testing approach [12] in which resources should be focused on those areas representing the highest risk exposure. However, this method doesn’t consider the testing cost which is also an essential factor during test-ing process. Besides we enhance its business importance calculation by Karl Wiegers’s method [16], incorporate risk analysis and improve it by introducing AHP (The Analytic Hierarchy Process) Method [17] to determine risk factors weights and reduce expert estimation bias. Rudolf Ramler outlines a framework for value-based test management [3], however, his outline doesn’t provide the implementation in details. Based on the COCOMO II cost-estimation model [18] and the COQUALMO quality estimation model [19], Liguo Huang proposes a quantitative risk analysis [20] which helps determine when to stop testing software and release the product. How-ever, her method is more macroscopic and doesn’t consider any controlling and moni-toring metrics of the testing process.
For adoption by industrial test teams, a prioritization technique with the following attributes would be beneficial [21]: 1) economical, not adding significant overhead or burden to the testing team; 2) improving customer-perceived software quality by decreasing field defects; 3) increasing business value for the customers. Our method is simple to follow and able to align software quality improvement with business value achievements from customers.
3 Method Overview
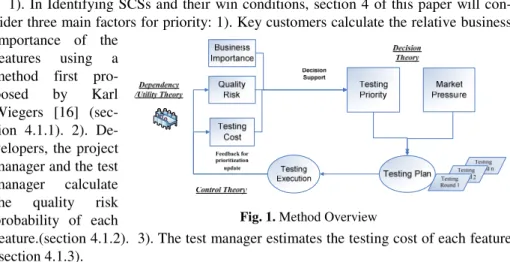
Fig 1 illustrates the whole process of this value-based software testing method. This method helps test manager enact the testing plan and adjust it during testing execu-tion. This method has three main steps:
1). In Identifying SCSs and their win conditions, section 4 of this paper will con-sider three main factors for priority: 1). Key customers calculate the relative business importance of the
features using a method first pro-posed by Karl Wiegers [16] (sec-tion 4.1.1). 2). De-velopers, the project manager and the test manager calculate the quality risk probability of each
feature.(section 4.1.2). 3). The test manager estimates the testing cost of each feature (section 4.1.3).
This step brings the stakeholders together to consolidate their value models and to negotiate testing objectives. They are according to the Dependency and Utility Theory in VBSE which help to identify all of the SCSs and understand how the SCSs want to win.
2). We put value, risk and cost together and calculate a value priority number for each feature (section 4.2). This is like a multi-attribute decision and negotiation proc-ess which follows the Decision Theory in VBSE. Features’ value priority helps us enact the testing plan, and resources should be focused on those areas representing the most important business value, the lowest testing cost and highest quality risk.
3). During the testing process, we adjust each feature’s value priority according to the feedback of quality risk indicators, and updated testing cost estimation (section 4.3). This step assists to control progress toward SCS win-win realization which is according to the Control Theory of VBSE.
Finally, the case study result analysis in section 5 shows that this method is espe-cially effective when the market pressure is very high.
4 Method with a Case Study
Our case study is based on a real-life business project in a software organization. This organization is a research and development organization in China which is appraised and rated at CMMI maturity level 4 in 2005. There is a research group in it focusing on the software process improvement and quantitative process management, which
has established some quantitative management methods [22, 23]. The group also developed a toolkit called SoftPM which is used to manage software project and has been deployed to many software organizations in China. Our case study is based on one of its web-based system development projects with a whole size of 553 KLOC. It employs iterative development method and CMMI process management. The recent iterative development covers 9 new features with an overall size of 32.6 KLOC Java codes. The features are mostly independent amendments or patches of some existing modules. We use F1,F2…F9 to denote these 9 features for short. We apply this method in its system testing process, and we manage and control our process of test-ing with the help of SoftPM.
4.1 Identify SCSs and Win Conditions
To provide a more practical set of guidelines for prioritizing, the first thing is to iden-tify SCSs and their win conditions. Direct stakeholders of testing are developers and project managers, who directly interact with the testing team. However, in the spirit of value-based software engineering important parties for testing are customers. Cus-tomers are the source of value objectives, which set the context and scope of testing. Marketing and product managers assist in testing for planning releases, pricing, pro-motion, and distribution[3].
We will look at three factors that must be considered when prioritizing the testing order of new features, and they represent SCSs’s win conditions:
1).The business importance of having the features. It gives information as to what extent mutually agreed requirements are satisfied and to what extent the software meets their value propositions.
2).The quality risk of each feature. For project managers it supports risk manage-ment and progress estimation. The focus is on identifying and eliminating risks that are potential value breakers and inhibit value achievements.
3).The cost estimation for testing each feature. Testing managers are interested in the identification of problems particularly the problem trends that helps to estimate and control testing process.
Because most projects are undertaken either to save or to make money, the first and third factors often dominate prioritization discussions. However, proper consid-eration of the influence of risk on the project is critical if we are to prioritize opti-mally. We will discuss them respectively in the subsequent three sections. They are according to the Dependency and Utility Theory in VBSE which help to identify all of the SCSs and understand how the SCSs want to win.
4.1.1 Business Importance
To determine business importance of each feature, we apply Karl Wiegers’ ap-proach [16] to our case study. This apap-proach considers both the positive benefit of the presence of a feature and the negative impact of its absence and this approach relies on expert judgment by representative customers. Each feature is assessed in
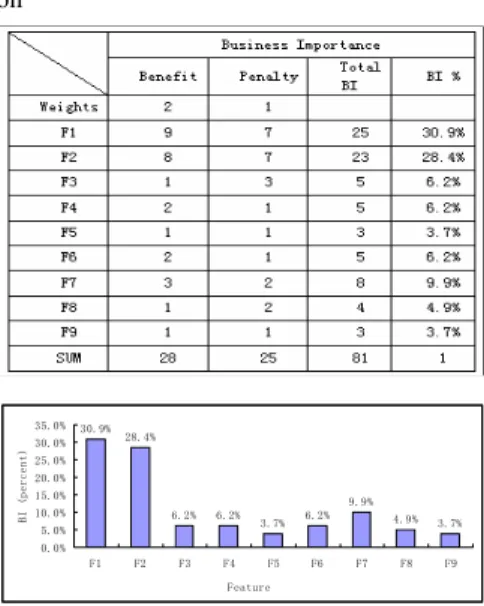
terms of the benefits it will bring if implemented, as well as the penalty that will be incurred if it is not imple-mented. The estimates of benefits and penalties are relative. A scale of 1 to 9 is used. The importance of including relative penalty should not be ne-glected. For example, failing to comply with a government regulation could incur a high penalty even if the cus-tomer benefit is low, as would omitting a feature that any reasonable customer would expect, whether or not they ex-plicitly requested it. For each feature, the relative benefit and penalty are summed up and entered in the Total BI (Business Importance) column in Table 1. Fi’s Total BI can be calculated by the following formula.
i Penalty
i
Benefit Benefit W Penalty
W * *
BI
Total i = +
The sum of the Total BI column represents the total BI of delivering all features. To calculate the relative contribution of each feature, divide its total BI by the sum of the Total BI column.
In our case study, we asked our key customers to determine each feature’s BI ac-cording to the above approach. They emphasize business benefit rather than penalty, and came to the agreement that weights the relative benefit as twice as important as the relative penalty. They gave the explanation that the 9 new features are amend-ments and updated functions for former version which has implemented the main functions ordered by customers and implementing these 9 features will bring more benefit to customers, while not implementing them will not greatly influence regular use. So in Table 1 they multiply the Relative Benefit by 2 before adding it to Relative Penalty to get the Total BI. Fig 2 shows the BI distribution of the 9 features. As we can see, there is an approximate Pareto distribution in which F1 and F2 contribute 22.2% of the features and 59.2% of the total BI.
4.1.2 Quality Risk
The risk analysis was performed prior to system test start, but was continuously up-dated during test execution. It aims to calculate the risk probability for each feature. There are three steps in quality risk analysis: the first is listing all risk factors based on history projects and experiences. Then use AHP (The Analytic Hierarchy Process) Method [17]to determine the weight for each risk factor and AHP consistency testing. The third is calculating the risk probability for each feature.
Step 1: Set up the n risks in the rows and columns of an n*n matrix. In our case study, according to Company A’s historical projects of the same type, we have six Table 1. Relative Business Importance Calcula-tion ) ) ) ) ) ) ) ) ) )HDWXUH %, S HUF HQW
main quality risks: Personnel Proficiency, Size, Complexity, Design Quality, Defects Proportion, and Defects Density.
Step 2: The test manager collaborated with the developing manager determine the weights of each quality risk using AHP method. The Analytical Hierarchy Process (AHP) is a powerful and flexible multi-criteria decision-making method that has been applied to solve
unstruc-tured problems in a vari-ety of decision-making situations, ranging from the simple personal deci-sions to the complex capi-tal intensive decisions.
In this case study, the calculation of quality risks weights is illustrated in Table 2. The number in
each cell represents the value pair-wise relative importance: number of 1, 3, 5, 7, or 9 in row i and column j stands for that the stakeholder value in row i is equally, moderately, strongly, very strongly, and extremely strongly more important than the stakeholder value in column j, respectively. In order to calculate weight, each cell is divided by the sum of its column, and then averaged by each row. The results of the final averaged weight are listed in the bolded Weights column in Table 2. The sum of weights equals 1.
If we were able to determine precisely the relative value of all risks, the values would be perfectly consistent. For instance, if we determine that Risk1 is much more important than Risk2, Risk2 is somewhat more important than Risk3, and Risk3 is slightly more important than Risk1, an inconsistency has occurred and the result’s accuracy is decreased. The redundancy of the pairwise comparisons makes the AHP much less sensitive to judgment errors; it also lets you measure judgment errors by calculating the consistency index (CI) of the comparison matrix, and then calculating the consistency ratio (CR). As a general rule, CR of 0.10 or less is considered accept-able[17]. In the case study, we calculated CR according to the steps in [17],the CR is 0.01, which means that our result is acceptable.
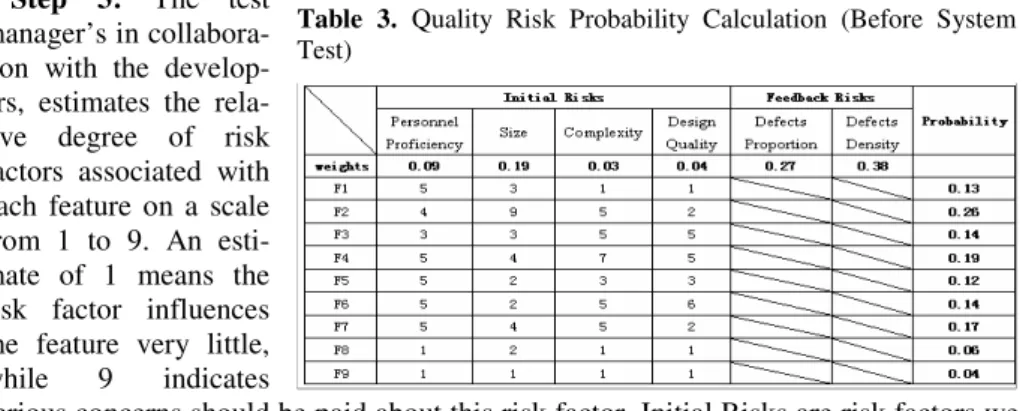
Step 3: The test manager’s in collabora-tion with the develop-ers, estimates the rela-tive degree of risk factors associated with each feature on a scale from 1 to 9. An esti-mate of 1 means the risk factor influences the feature very little, while 9 indicates
serious concerns should be paid about this risk factor. Initial Risks are risk factors we use to calculate the risk probability before the system testing and Feedback Risks such
Table 2. Risk Factors’ Weights Calculation-AHP
g
Table 3. Quality Risk Probability Calculation (Before System Test)
Table 4. Relative Testing Cost Estimation
as defects proportion and defects density are risk factors displayed during the testing process and serve to monitor and control the testing process. Qualitative risks such as Personnel Proficiency, Complexity, Design quality etc. are scored by the developing manager. Quantitative risks such as Size, Defects Proportion, Defects Density are scored based on project data, for example, if a feature’s size is 6KLOC and the largest feature’s size is 10KLOC, so the feature’s size risk is scored as 9*(6/10)
≈
5. The risk probability of Fi is 9 * 1 ,∑
= = n j j j i i W RP ∈
[ ]
0,1.R
i,jis Fi’s risk value of jth risk factor, Wj denotes the weight of jth risk factor. Table 3 will calculate the Probability of the total initial risks that comes from each feature before system test.4.1.3 Testing Cost
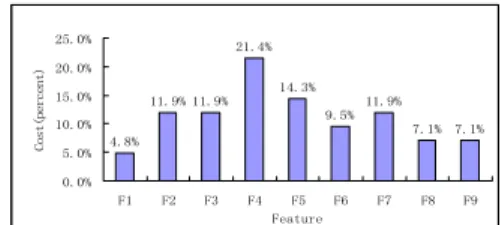
The test manager estimates the relative cost of testing each feature, again on a scale ranging from a low of 1 to a high of 9. The test manager estimates the cost ratings based on factors such as the developing effort of the feature, the feature complexity, and the quality risks. Table 4 will calculate the percentage of total cost for each fea-ture. In our case study, the estimating result is displayed in Table 4 and Fig 3 .
4.2 Put BI, Risk and Cost Together
This step is a multi-attribute decision and negotiation processing which is confirmed with the Decision Theory in VBSE. Once you enter the BI%, Probability and Cost% estimates into the spreadsheet (Table 5), it calculates a value priority number for each feature. The formula for the Value Priority column is:
Cost obability BI
iority
ValuePr = *Pr . Sort the list of features in descending order by calculated priority. The fea-tures at the top of the list have the most favorable balance of BI, cost, and risk. Features with high BI, high quality risk and low cost have high testing priority and should be tested first. The key cus-tomer and developer representatives should review the completed
spreadsheet to agree on the ratings and the resulting sequence. As we can see in Table Table 5. Value Priority Calculation
) ) ) ) ) ) ) ) ) )HDWXUH &R VW S HU FH QW
5, F1 and F2 have the highest Value Priority and should be tested first. They also have a stronger Pareto value, with 22% of the functions contributing 77% of the value.
4.3 Adjust Priority According to Feedback during Testing Process
Features’ testing value priority provides the decision support for the test manager to enact the testing plan and adjust it according to the feedback of quality risk indicators, such as defects numbers and defects density and updated cost estimation. Usually, we collect defects data, re-estimate cost after one testing round and provide feedback to adjust the next testing round plan. Features with higher priority should be tested to satisfy the stop-test criteria first. When the features with highest priority satisfy the stop-test criteria, delete
them from the spread-sheet, update feedback risk and cost estimation for features left and resort features accord-ing to the updated priority, continue this process when all fea-tures satisfy the stop-test criteria or it’s the
time to market. As the planning uncertainty is high for the first test round, the test manager decides to schedule the most valuable tests first so less important ones can easily be deferred if running out of time at the end of the cycle. This step helps to control progress toward SCS win-win realization which is according to the Control Theory of VBSE.
Table 6 shows the quality probability calculation after testing round 1 when F1, F2 have satisfied stop-test criteria, so we delete them from the spreadsheet and re-sort the remaining features.
Each organization has its own stop-test criteria. In our case study, the company has 4 criteria, and they are: test cases coverage rate is 100%, all planned test cases exe-cuted and passed; no defects with impact equal to, or below severity level 3 are de-tected during at least one day of continuous testing, and to satisfy the quality goal of 0.2 defects/KLOC when released.
5 Performance Evaluation
In our case study, the test manger plans to execute 4 rounds of testing. During each round, test groups focus on 2-3 features with the highest current priority, and the other features are tested by automated tools. The testing result is when the first round is over, F1 and F2 satisfy the stop-test criteria, when the second round is over, F3, F6, F7 satisfied the criteria, when the third round is over, F4, F8 satisfied the stop-test criteria, and the last round is F5 and F9. And initial estimating stop-testing cost and actual testing cost comparison can be shown in Fig 4.
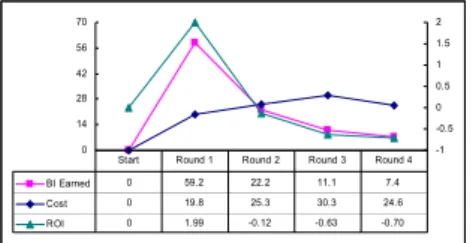
If we regard the testing activity as an in-vestment, its value is realized when fea-tures satisfy the stop-test criteria. As we can see in Fig 5 and Fig 6 , when we fin-ished the Round 1 testing, we earned 59.2% BI of all features, at a cost of only 19.8% of the all testing process, the ROI is as high as 1.99. During the Round 2, we earned 22.2% BI, cost 25.3% effort, and the ROI became negative as -0.12. We also can see, from Round 1 to Round 4, both the
BI earned line and the ROI line is descending. Round 3 and Round 4 earn only 18.5% BI but cost 54.9% effort. This shows that the Round 1 testing is the most cost effec-tive. Testing the features with higher value priority first is especially useful when the market pressure is very high. In such cases, one could stop testing after finding a negative ROI in Round 1. However, in some cases, continuing to test may be worth-while in terms of customer-perceived quality.
0 14 28 42 56 70 -1 -0.5 0 0.5 1 1.5 2 BI Earned 0 59.2 22.2 11.1 7.4 Cost 0 19.8 25.3 30.3 24.6 ROI 0 1.99 -0.12 -0.63 -0.70
Start Round 1 Round 2 Round 3 Round 4
6WDUW 5RXQG 5RXQG 5RXQG 5RXQG 5RXQG %, (DUQ HG3 HUFHQ W
Fig. 5. BI, Cost and ROI between Testing Rounds
Fig. 6. Accumulated BI Earned During Testing Rounds
In our case study, we use a simple function as follows to display the market pressure’s influence to BI:
(
)
Time Rate essure BI Initial BI esent 1 Pr Pr = +. Time represents the number of unit time cycle. A unit time cycle might be a year, a month, a week even a day. For simplic-ity, in our case study, the unit time cycle is a testing round. Pressure Rate is esti-mated and provided by market or product managers, with the help of customers. It represents during a unit time cycle, what is the percentage initial value of the soft-ware will depreciated. The more furious the market competition is, the larger the Pressure Rate is. As we can see from the formula above, the longer the time is, the larger the Pressure Rate is, the smaller is
Fig. 7. BI Loss (Pressure Rate=1%)
Fig. 8. BI Loss (Pressure Rate=4%) 7HVWLQJ5RXQG &RVW 3HUFHQ W (VWLPDWH $FWXDO
Fig. 4. Initial Estimating Testing Cost and Actual Testing Cost
the present BI, and the larger the loss BI caused by market erosion. In our case study, Due to we calculate the relative business importance, the initial total BI is 100(%). When the Round n testing is over, the loss BI caused by market
ero-sion is
(
)
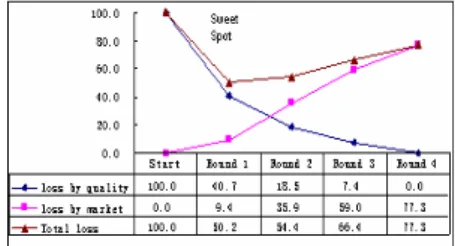
n essureRate Pr 1 100 100− + . On theother hand, the earlier the product enters the market, the larger the loss caused by poor quality. Finally, we can find a sweet spot (the minimum) from the combined
risk exposure due to both unacceptable software quality and market erosion.
We assume three Pressure Rates 1%, 4% and 16% standing for low, median and high market pressure respectively in Fig 7,8,9. When market pressure is as low as 1% in Fig7, the total loss caused by quality and market erosion reaches the lowest point (sweet spot) at the end of the Round 4.When the Pressure Rate is 4%, the lowest point of total loss is at the end of Round 3 in Fig 8, which means we should stop testing and release this product even F5 and F9 haven’t reached the stop-test criteria at the end of Round 3; this would ensure the minimum loss. When the market pressure rate is as high as 16% in Fig 9, we should stop testing at the end of Round 1.
6 Discussion of Limitation
y This method is based on the assumption that the features for prioritization are independent and the absentness of any features doesn’t influence the testing and re-leasing of others. If the prioritization has already been done in the implementation stage, testing is just a process that ensures the software satisfies customers’ needs, instead of a process of trade-offs between quality and time-to-market pressures, and our method becomes meaningless for this situation.
y This method is applicable for business critical projects, not suitable for safety critical domains. In safety critical domains, software organizations follow strict guidelines for testing. Sacrifice of quality to satisfy the business goal might be un-ethical and unprofessional in such situations.
y This method depends highly on accurate cost estimation to enact testing plans and testing rounds, however, as practical experiences show, it is often not possible to anticipate all influence factors at the beginning of a test cycle. Re-estimation during the testing process gives a solution to this problem. Updated test-ing cost estimation durtest-ing the testtest-ing process produces more accurate testtest-ing pri-orities.
y About the method validation, we used a simple function to display the mar-ket pressure’s influence to BI in our case study; however, this form of marmar-ket pres-sure may not fit the real life situation. There are other types of market prespres-sure functions as well[20]. The choice of which function to use depends on different project business cases.
7 Conclusion and Future Work
Software testing is a very resource-intensive activity in software development and not always organized to maximize business value. This paper has demonstrated a value-based approach for prioritizing features for testing which aligns the internal test process with the value objectives coming from the customers and the market. This involves prioritizing features based on their business importance, quality risk, and testing cost of each feature; adjusting feature’s value priority during the testing proc-ess; and providing stop-testing decision criteria based on the market pressure. In the organization’s case study, this method helps the test manager to identify features with high business importance, high quality risk and low cost, to focus testing effort on these features and to control and adjust testing plan toward SCSs win-win realization. The result shows that this method can help to improve ROI of testing investment at the early stage, especially when the market pressure is high.
In 2009, we plan to apply this testing approach to a set of e-Services projects at USC to get more empirical validation.
Acknowledgements
This work is supported by the National Natural Science Foundation of China under Grant Nos. 60573082, 60873072, and 60803023; the National Hi-Tech R&D Plan of China under Grant Nos. 2006AA01Z182 and 2007AA010303; the National Basic Research Program (973 program) under Grant No. 2007CB310802.
References
1. Boehm, B., Basili, V.R.: Software Defect Reduction Top10 List. IEEE Computer 34(1), 135–137 (2001)
2. Boehm, B.: Value-Based Software Engineering: Overview and Agenda. In: Value-Based Software Engineering. Springer, Heidelberg (2005)
3. Ramler, R., Biffl, S., Grunbacher, P.: Value-Based Management of Software Testing. In: Value-Based Software Engineering, pp. 226–244. Springer, Heidelberg (2005)
4. Beizer, B.: Software Testing Techniques, 2nd edn. International Thomson Computer Press, New York (1990)
5. Boehm, B.: Value-Based Software Engineering. ACM Software Engineering Notes, 28(2) (2003)
6. Bullock, J.: Calculating the Value of Testing. Software Testing and Quality Engineer-ing 2(3), 56–62 (2000)
7. Pyster, A.B., Thayer, R.H.: Software Engineering Project Management 20 Years Later. IEEE Software 22(5), 18–21 (2005)
8. Boehm, B., Jain, A.: An Initial Theory of Based Software Engineering. In: Value-Based Software Engineering, pp. 16–37. Springer, Heidelberg (2005)
9. Boehm, B., et al.: Using the WinWin spiral model: a case study. IEEE Computer 31(7), 33–44 (1998)
10. Boehm, B.: A Spiral Model of Software Development and Enhancement. IEEE Com-puter 21(5), 61–72 (1988)
11. Boehm, B., Huang, L.G.: Value-Based Software Engineering: A Case Study. IEEE Com-puter 36(3), 33–41 (2003)
12. Amland, S.: Risk Based Testing and Metrics. In: 5th International Conference EuroSTAR 1999, Barcelona, Spain (1999)
13. Raz, O., Shaw, M.: Software Risk Management and Insurance. In: Proceedings of the 23rd International Conference on Software Engineering (Workshop on Economics-Driven Software Engineering Research) (2001)
14. Lee, K., Boehm, B.: Empirical Results from an Experiment on Value-Based Review (VBR) Processes. In: International Symposium on Empirical Software Engineering (2005) 15. Boehm, B., et al.: The ROI of Software Dependability: The iDAVE Model. IEEE
Soft-ware 21(3), 54–61 (2004)
16. Wiegers, E.K.: First Things First: Prioritizing Requirements. Software Development 7(10), 24–30 (1999)
17. Saaty, T.L.: The Analytic Hierarchy Process. McGraw-Hill, New York (1980)
18. Boehm, B., et al.: Software Cost Estimation with COCOMOII, Har/Cdr th edn. Prentice-Hall, Englewood Cliffs (2000)
19. Chulani, S., Boehm, B.: Modeling Software Defect Introduction and Removal: CO-QUALMO (COnstructive QUALity MOdel),Technical Report, University of Southern California (2002)
20. Huang, L., Boehm, B.: How Much Software Quality Investment Is Enough: A Value-Based Approach. IEEE Software 23(5), 88–95 (2006)
21. Srikanth, H., Williams, L.: On the Economics of Requirements-Based Test Case Prioritiza-tion. In: EDSER 2005, Louis,Missouri,USA (2005)
22. Wang, Q., et al.: BSR: A Statistic-based Approach for Establishing and Refining Software Process Performance Baseline. In: Proceedings of the 28th International Conference on Software Engineering, Shanghai, China (2006)
23. Wang, Q., et al.: An Empirical Study on Establishing Quantitative Management Model for Testing Process in International Conference on Software Process (2007)