Fact-finding studies in support
of the development of an EU
strategy for freight transport
logistics
Lot 1: Analysis of the EU
logistics sector
Fact-finding studies in
support of the development
of an EU strategy for freight
transport logistics
Lot 1: Analysis of the EU logistics sector
CONTRACT NUMBER
FV355/2012/MOVE/D1/ETU/SI2.659384
The information and views set out in this report are those of the author(s) and do not necessarily reflect the official opinion of the Commission. The Commission does not guarantee the accuracy of the data included in this study. Neither the Commission nor any person acting on the Commission’s
behalf may be held responsible for the use which may be made of the information contained therein
Written by: Ecorys, Fraunhofer, TCI, Prognos and AUEB-RC/TRANSLOG January 2015
Table of Contents
... 2 Table of Contents ... 3 List of Tables ... 7 List of Figures ... 9 List of Abbreviations ... 12 Abstract ... 15 Résumé ... 15 Executive summary ... 16 Résumé ... 19 1. Introduction ... 23 1.1 Background ... 23 1.2 Report structure ... 241.2.1 Structure and relation between the chapters of the final report ... 25
2. Overview and performance of the EU logistics sector ... 27
2.1 Introduction ... 27
2.2 Preliminary analysis of data sources and data to collect ... 28
2.2.1 Source screening ... 28
2.2.2 Possible indicator assessment ... 30
2.3 Analysis of the logistics market structure ... 32
2.3.1 The EU logistics market structure – macro data ... 32
2.3.2 The EU logistics market structure – micro data ... 38
2.3.3 The EU logistics market structure – conclusions ... 48
2.4 Creating logistics costs transparency ... 49
2.4.1 Development of important cost elements ... 49
2.4.2 Cost structures by logistics segments ... 55
2.4.3 Road ... 56 2.4.4 Rail ... 57 2.4.5 Inland waterways ... 58 2.4.6 Sea ... 59 2.4.7 Air ... 60 2.4.8 Warehousing ... 61
2.4.9 Conclusions for the European logistics cost structures ... 62
2.5 Evaluation of the economic added value of logistics ... 63
2.5.1 Economic added value from logistics service activities on the economies of the EU and Member States ... 63
2.5.2 Economic added value from logistics service activities on industry sectors of the EU Member States ... 67
2.5.3 Conclusions from the economic added value analysis ... 74
2.6 Evaluation and comparison of the performance of logistics systems ... 75
2.6.1 Framework conditions – infrastructure ... 75
2.6.2 Absolute performance indicators – tonnage-oriented view ... 77
2.6.4 Conclusions on performance of logistics systems ... 84
2.6.5 General conclusions ... 86
3. Logistics trends and scenarios ... 88
3.1 Introduction ... 88
3.2 Identification of external factors ... 89
3.2.1 Political factors ... 92
3.2.2 Economic factors ... 101
3.2.3 Social and cultural factors ... 107
3.2.4 Technological factors ... 111
3.2.5 Legal factors ... 116
3.2.6 Environmental factors ... 119
3.2.7 Identification of main external factors ... 125
3.3 Identification of logistic strategies and trends ... 125
3.4 Impact assessment of main external factors, strategies and trends ... 132
3.4.1 Assessment of the impact of the main external factors ... 132
3.4.2 Impact assessment of main external factors and logistic strategies .... 134
3.4.3 Main conclusions of impact assessment ... 151
3.5 Scenarios for EU logistic development ... 152
3.5.1 EU Reference Scenario 2013 ... 152
3.5.2 Scenario development ... 154
3.5.3 Scenario assessment ... 156
3.5.4 Scenario conclusion ... 158
4. Mid to long-term logistics policy ... 160
4.1 Introduction ... 160
4.2 Problem definition ... 160
4.2.1 Rising logistics cost due to inefficiencies and market failures ... 164
4.2.2 Negative environmental impact ... 165
4.2.3 Increasing shortage of staff ... 166
4.2.4 Affected parties ... 167
4.2.5 Problem tree and root causes of the problems ... 172
4.2.6 How will the causes of logistics problems evolve in the future? ... 181
4.3 Definition of the objectives ... 182
4.4 Policy options ... 185
4.4.1 Introduction ... 185
4.4.2 The review of FTLAP 2007 ... 186
4.4.3 The development of policy options ... 195
4.5 Analysis of impacts ... 204
4.5.1 Analytical approach ... 204
4.5.2 Alternative policy options ... 205
4.5.3 Step 1: Identification of economic, social and environmental impacts . 205 4.5.4 Step 2: Identification of the most important impacts ... 223
4.6 Comparison of options ... 248
4.6.1 Introduction ... 248
4.6.2 Descriptive comparison of policy options ... 249
4.6.3 Quantitative analysis of the MCA results ... 249
4.6.4 Conclusion ... 252
4.7 Monitoring and evaluation ... 252
5. Performance indicators and best practices ... 257
5.1 Introduction ... 257
5.2 Analytical framework ... 258
5.3 Analysis of Logistics Performance Measurement at national level ... 258
5.4 Analysis of Logistics performance measurements on company level ... 261
5.5 Key Performance Areas (KPA) and Key Performance Indicators (KPI) ... 261
5.5.1 Key Performance Areas (KPAs) ... 262
5.5.2 Key Performance Indicators (KPIs) ... 267
5.6 Gap analysis and recommendations ... 273
5.6.1 Framework for analysis ... 273
5.6.2 Gap analysis ... 273
5.6.3 Recommendations ... 275
Annex I: Literature list ... 279
Annex II: Overview secondary sources ... 292
Annex III: Logistics Market Segments Descriptions from the Top 100 in European Transport and Logistics Services ... 308
Annex IV: Assessment of the Economic Value Added of Logistics via Symmetrical Input-Output Matrices ... 311
Annex V: Inventory of the statistical basis – Metadata ... 316
Indicator 1 - Tonnes (per transport mode) ... 316
Indicator 2 - Tonne-kilometres ... 319
Indicator 3 - Tonnes per inhabitant ... 321
Indicator 4 - Number of vehicles ... 325
Indicator 5 - Number of vehicle movements ... 328
Indicator 6 - Number of empty runs ... 328
Indicator 7 - Tonnes per vehicle ... 330
Indicator 8 - Total Turnover ... 331
Indicator 9 - Number of logistics service providers ... 332
Indicator 10 - Number of employees ... 333
Indicator 10b - Number of employees (LSP) ... 335
Indicator 11 - Average turnover per service provider ... 335
Indicator 12 - Average vehicle age ... 336
Indicator 13 - Average vehicle size ... 337
Indicator 14 - Average length of haul ... 338
Indicator 15 - Overall logistics expenses per country ... 340
Indicator 16 - Vehicle and train-tkm ... 341
Indicator 17 - Number of trips per 1,000 vehicle-kilometres ... 342
Indicator 18 - Share of road freight vehicles with EURO 4-6 standard ... 342
Indicator 19 - Owned and hired fleet share (poss. for road) ... 343
Indicator 20 - TEN-T lines per country ... 345
Indicator 21 - Modal share of intermodal transport ... 345
Indicator 23 - Share of logistics costs on total product costs ... 346
Indicator 25 - Share of value added of the logistics sector in total value added ... 347
Indicator 26 - Productivity (value added per employee) in the logistics sector .... 347
Indicator 28 - Transport performance (tkms) per GDP (Transport intensity) ... 349
Indicator 29 - a) Fuel prices b) capital costs c) warehouse rents d) road tolls ... 349
Indicator 30 - Average wages ... 351
Indicator 31 - Number of warehouses per country ... 352
Indicator 32 - m² per warehouse ... 352
Indicator 33 - Inventory stock turn rate ... 353
Indicator 36 - Share of inputs from ICT ... 354
Content & Quality ... 355
Annex VI: Problems of Data Availability ... 362
Annex VII: Stakeholder consultation ... 364
Workshop 4th of July 2014 - summary... 364
Stakeholder Questionnaire ... 367
Annex VIII: Analysis of Logistics Performance Measurement ... 393
Analysis of Logistics Performance Measurement at national level ... 393
Analysis of Logistics Performance Measurement at company level ... 398
Fact-Sheets of Logistics Performance Measurement studies on national level ... 404
Fact-Sheets of Logistics Performance Measurement studies on national level ... 404
Fact Sheets... 423
List of Tables
Table 1.1 Relation between the study tasks and report chapters ... 25
Table 2.1 Secondary data source evaluation ... 28
Table 2.2 List of indicators to be collected within task 1 ... 31
Table 2.3 Logistics expenses of the EU27 from 2008 to 2012 as a share of EU27 GDP ... 34
Table 2.4 Top 20 ranking of EU Member States logistics service providers in 2012 ... 35
Table 2.5 Nationalities of the 20 biggest logistics service providers in the EU28 in 2012 ... 36
Table 2.6 Data table: persons employed per enterprise in 2011 for selected Member States ... 47
Table 2.7 Data table – productivity per person employed in thousand € in 2011 for selected Member States ... 83
Table 3.1 Overview of external factors and resulting logistic strategies and trends ... 90
Table 3.2 Logistic strategies/trends and their impacts, based on the questionnaire results ... 130
Table 3.3 Main external factors and their influence on logistic strategies / trends ... 133
Table 3.4 EU27 population, share of population aged 65 or above and old age dependency rate in 2010 and 2030 ... 135
Table 3.5 Fact-sheet main external factor “Ageing society” ... 135
Table 3.6 Fact-sheet main external factor “Transport infrastructure development” . 137 Table 3.7 Fact-sheet main trend “Proliferaton of electronic business” ... 139
Table 3.8 Fact-sheet main trend “Information and communication technologies (ICT)” ... 141
Table 3.9 Fact-sheet main trend “Supply chain resilience” ... 144
Table 3.10 Fact-sheet main trend “Fossil fuel scarcity” ... 146
Table 3.11 Fact-sheet main trend “Raw material scarcity” ... 148
Table 3.12 Fact-sheet main trend “Energy costs” ... 150
Table 3.13 Impacts of scenarios on logistic strategies / trends ... 157
Table 3.14 Impacts of scenarios on logistic strategies on the EU28 wide transport performance (AAGR of Gtkm) between 2010 and 2030 ... 158
Table 4.1. Evidence base for the 11 problems ... 163
Table 4.2 Result of affected parties ... 168
Table 4.3. Number of companies ordered by type and size who responded to this study’s questionnaire. ... 169
Table 4.4. Objectives resulting from problems and their root causes ... 184
Table 4.5 List of action of policy option 1 “Continuation of FTLAP” ... 197
Table 4.6. List of action of policy option 2 “ Minimum intervention” ... 199
Table 4.7. List of action of policy option 3 “Creating full support for the logistics market” ... 202
Table 4.8 Identified impacts of policy options ... 206
Table 4.9 Results multi-criteria analysis: administrative costs ... 245
Table 4.10 Results multi-criteria predictability and speed of administrative processes ... 245
Table 4.11 Results multi-criteria logistic costs ... 246
Table 4.12 Results multi-criteria vehicle use ... 246
Table 4.13 Results multi-criteria vehicle capacity utilisation ... 246
Table 4.14 Results multi-criteria professional skills of logistics employees ... 247
Table 4.15 Results multi-criteria adjustment costs ... 247
Table 4.16 Results multi-criteria commercial data protection ... 247
Table 4.17. Results multi-criteria energy efficiency of transport ... 248
Table 4.18 Results multi-criteria CO2 emissions ... 248
Table 4.20 Weight sets used for the multi-criteria analysis ... 250
Table 4.21 KPI’s rising logistics costs due to inefficiencies and market failures ... 254
Table 4.22 KPI’s Negative environmental impact ... 255
Table 4.23 KPI’s Increase shortage of staff ... 256
Table 5.1 Main issues and problems in logistics sector, their association with the KPAs selected and applicable levels of analysis ... 262
Table 5.2 Sample Good Practice of Key Performance Indicators for Logistics ... 269
Table 5.3 Approach for gap analysis and recommendations ... 273
Table 5.4: Gap analysis of current vs. desired state of logistics performance assessment ... 274
Table A.IV 1 Availability of symmetric input-output tables (SIOT) ... 311
Table A.IV 2 Symmetrical input-output matrices – sector overview ... 312
Table A.IV 3 Symmetrical input-output matrices – detail for logistical analyses ... 314
Table A.VII. 1 workshop participants ... 364
Table A.VII. 2 Overview of questionnaire ... 368
Table A.VII. 3 Answers question 2 ... 369
Table A.VII. 4 Answers question 3 ... 369
Table A.VII. 5 Answers question 6 ... 370
Table A.VII. 6 Answers question 7 ... 371
Table A.VII. 7 Answers question 8 ... 372
Table A.VII. 8 Answers question 9 ... 373
Table A.VII. 9 Answers question 12 ... 375
Table A.VII. 10 Answers question 15 ... 376
Table A.VII. 11 Answers question 18 ... 378
Table A.VII. 12 Answers question 21 ... 379
Table A.VII. 13 Answers question 24 ... 381
Table A.VII. 14 Answers question 27 ... 383
Table A.VII. 15 Answers question 28 ... 384
Table A.VII. 16 Answers question 30 ... 385
Table A.VII. 17 Answers question 31 ... 386
Table A.VII. 18 Answers question 31 ... 387
Table A.VII. 19 Evaluation of the past FTLAP ... 390
List of Figures
Figure 1.1 Overview of the chapters – final report ... 25
Figure 2.1 Sub-tasks and content of this chapter ... 27
Figure 2.2 Source evaluation of Top 100 in European Transport and Logistics Services reports ... 30
Figure 2.3 Logistics market size in the EU Member States in 2012 ... 33
Figure 2.4 Logistics volume and cost components in EU28 in 2012 ... 35
Figure 2.5 Composition of top 15 service providers per EU28 Member State ... 37
Figure 2.6 Logistics market segments breakdown 2012 ... 37
Figure 2.7 Logistics market segments – outsourced share estimates for EU28 in 2012 ... 38
Figure 2.8 Number of logistics service providers per EU Member State in 2011 ... 40
Figure 2.9 Changes in number of logistics service providers per EU Member State from 2008 to 2011 – available Member States ... 41
Figure 2.10 Logistics market structure – enterprises by subsectors in 2011 for selected Member States and the EU27 ... 42
Figure 2.11 Logistics market structure – turnover by subsector in 2011 for selected Member States and the EU27 ... 43
Figure 2.12 Logistics market structure – turnover per enterprise and subsector in 2011 for selected Member States and the EU27 ... 44
Figure 2.13 Logistics market structure – persons employed per subsector in 2011 for selected Member States and the EU27 ... 45
Figure 2.14 Logistics market structure – persons employed per enterprise and subsector in 2011 for selected Member States and the EU 27 ... 46
Figure 2.15 Development of personnel costs 2006-2012 for the EU28 ... 50
Figure 2.16 Development of diesel prices 2006-2012 for the EU28 ... 52
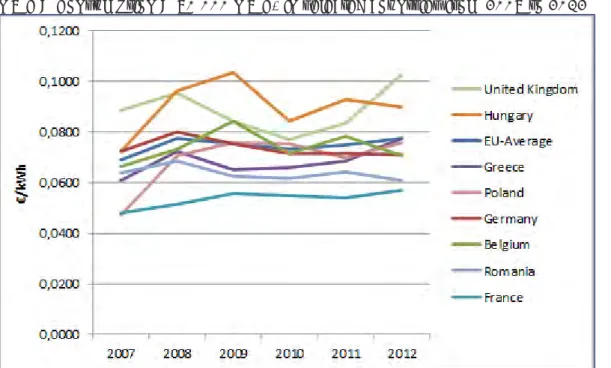
Figure 2.17 Development of electricity prices for big industrial customers (20 000 MWh < Consumption < 70 000 MWh) in selected countries from 2007 to 2012 ... 53
Figure 2.18 Development of interest rates on capital (loans) 2006-2012 for the EU28 ... 54
Figure 2.19 Development of warehouse rents 2006-2012 for the EU28 ... 55
Figure 2.20 The cost structure of road transportation in the EU Member States 2012 57 Figure 2.21 The cost structure of rail transportation in the EU Member States 2012 . 58 Figure 2.22 The cost structure of inland waterway transportation in the EU Member States 2012 ... 59
Figure 2.23 The cost structure of sea/ocean freight transportation in the EU27 Member States 2012 ... 60
Figure 2.24 The cost structure of air freight transportation in the EU27 Member States 2012 ... 61
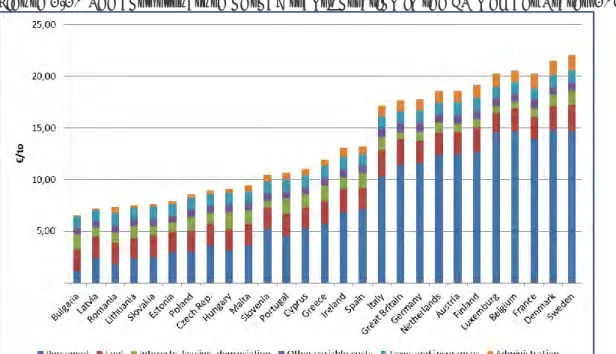
Figure 2.25 The warehousing costs per year per m² in the EU27 Member States in 2012 ... 62
Figure 2.26 Added value of outsorced logistics activities in total nationa product in the EU27 in 2008 and 2009 ... 63
Figure 2.27 Share of types of logistics services at overall added value – EU27 mean 2009 ... 64
Figure 2.28 Added value of outsourced logistics activities in total national product – sorted by overall contribution – Member State comparison 2010 ... 65
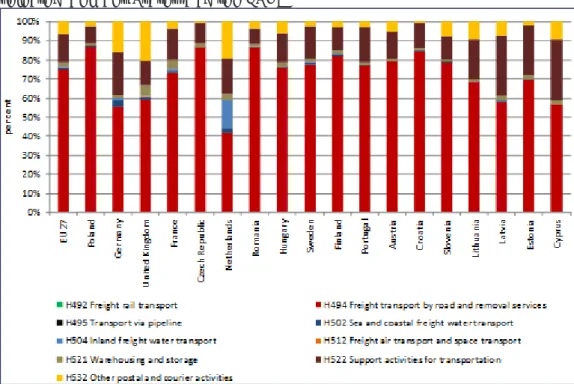
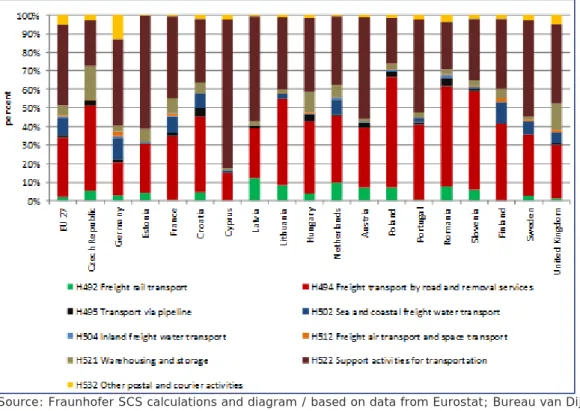
Figure 2.29 Composition of outsourced logistics activities input sorted by H49 Land transport services and transport services via pipelines for selected Member States in 2010 ... 66
Figure 2.30 Composition of outsourced logistics activities input sorted by H49 Land transport services and transport services via pipelines for selected Member States in 2010 ... 67
Figure 2.31 Share of types of logistics services at overall added value – 18 Member
States mean 2010 ... 67
Figure 2.32 Added value of outsourced logistics activities in construction and construction works – 18 Member States comparison 2010 ... 68
Figure 2.33 Changes in added value of outsourced logistics activities in construction and construction works – available Member States 2008 to 2010 ... 68
Figure 2.34 Added value of outsourced logistics activities in food products, beverages and tobacco products – 18 Member States comparison 2010 ... 69
Figure 2.35 Changes in added value of outsourced logistics activities in food products, beverages and tobacco products – available Member States 2008 to 2010 ... 70
Figure 2.36 Added value of outsourced logistics activities in machinery and equipment n.e.c. – 18 Member States comparison 2010 ... 71
Figure 2.37 Changes in added value of outsourced logistics activities in machinery and equipment n.e.c. – available Member States 2008 to 2010 ... 71
Figure 2.38 Added value of outsourced logistics activities in the manufacture of chemicals and chemical products – 18 Member States comparison 2010 ... 72
Figure 2.39 Changes in added value of outsourced logistics activities in the manufacture of chemicals and chemical products – available member states 2008 to 2010 ... 73
Figure 2.40 Added value of outsourced logistics activities in the motor vehicles, trailers and semi-trailers industry – 18 Member States comparison 2010 ... 73
Figure 2.41 Changes in added value of logistics services in the motor vehicles, trailers and semi-trailers industry – available Member States 2008 to 2010 ... 74
Figure 2.42 World Bank – Infrastructure quality score 2014 for the EU28 and selected extra-EU nations ... 76
Figure 2.43 Total transport 2012 – Road and rail for the EU28 ... 77
Figure 2.44 Total transport – Development 2005-2012 – Road and Rail ... 78
Figure 2.45 Short sea shipping 2012 – for 24 EU Member States ... 78
Figure 2.46 Tonne-kilometres in 2012 – Road and Rail – EU28 and extra-EU countries comparison ... 79
Figure 2.47 Total transport – Development 2005-2012 – Road and Rail ... 80
Figure 2.48 Tonne per inhabitant 2011 – EU28 ... 80
Figure 2.49 Tonne-kilometre per inhabitant 2011 – extra-EU countries comparison .. 81
Figure 2.50 Total and empty runs for the EU28 in 2012 ... 82
Figure 2.51 Development of productivity in the transportation and storage sector from 2008 to 2011 ... 84
Figure 2.52 World Bank – Logistics Quality 2014 for the EU28 and selected extra-EU countries ... 85
Figure 2.53 World Bank – Timeliness score 2014 for the EU28 and selected extra-EU nations ... 85
Figure 2.54 World Bank – Tracking and tracing score 2014 for the EU28 and selected extra-EU nations ... 86
Figure 3.1 Analytical framework for assessing the impact of the external environment of freight transport on logistics system characteristics ... 89
Figure 3.2 Modal split development of EU28 freight transport for inland modes 1995 – 2012 ... 94
Figure 3.3 Index of rail liberalisation (LIB Index) for rail passenger and freight transport in 2011 (maximum 1.000) ... 95
Figure 3.4 Comparison of fuel prices (without taxes) between selected EU Member States and the EU28 ... 98
Figure 3.5 Comparison of fuel prices (with taxes) between selected EU Member States and the EU28 ... 98
Figure 3.6 EU28 GDP in PPS (Purchasing Power Standard per inhabitant in constant prices) ... 102
Figure 3.7 Index of GDP in PPS (Purchasing Power Standard per inhabitant in constant
prices) 2013 in selected countries compared to the EU28 average (=100) ... 102
Figure 3.8 Absolute growth (in %) 2005-2012 of road transport in selected new Member States 2005/2006-2012 compared to the average of the EU27 ... 105
Figure 3.9 Selected results of the “Green Trends Survey” carried out by Deutsche Post DHL in six key global markets (India, China, the US, Brazil, the UK and Germany) . 110 Figure 3.10 Heavy goods vehicle stock 2007, 2008 and 2013 per EURO class in Germany ... 113
Figure 3.11 Freight transport activity of the EU28 Member States per mode (in Gtkm) between 2000 – 2050 according to the EU Reference Scenario 2013 (AAGR 2010 – 2030) ... 153
Figure 3.12 Allocation of external factors– Assessment of impact and uncertainty .. 154
Figure 3.13 Scenario structure (according to allocation of external factors and trends) ... 155
Figure 3.14 Estimation for changes within freight transport activity (transport performance in Gtkm) of EU28 Member States between 2010 and 2030 for the baseline and scenarios I – IV ... 158
Figure 4.1 Relevance of problems for the competitiveness of the EU logistics sector 161 Figure 4.2. Rising logistics costs, negative environmental impact and increasing shortage of staff as the main problem categories for the logistics sector ... 163
Figure 4.3 Logistics costs share in total production costs in Europe, 1987-2008 ... 164
Figure 4.4 Logistics costs share in total production costs in Europe, 2008-2013 ... 164
Figure 4.5 EU27 greenhouse gas emissions by sector and mode of transport, 2007 165 Figure 4.6. CO2 emissions per transport activity in EU28 and transport performance in Gross-tonne km ... 166
Figure 4.7 Age distribution in transport and logistics in Germany, Australia and the US ... 167
Figure 4.8 Stakeholder assessment of the impact and relevance of emissions and shortage of staff in logistics ... 171
Figure 4.9 Use of RFID (left) and vehicle on-board computers (right) by Dutch road freight transport companies by size (number of transport units) - figures 2012 ... 175
Figure 4.10 Energy consumption in freight transport for EU28 and freight transport activity ... 177
Figure 4.11. Share of renewable energy use; total, transport, electricity and heating and cooling for EU28 ... 178
Figure 4.12 The SuperGreen and TEN-T core network corridors ... 195
Figure 4.13 Alternative policy options ... 196
Figure 4.14 Approach for the analysis of the impacts of policy options ... 205
Figure 4.15 Likelihood-magnitude matrix of expected impacts of Policy Option 1 ... 242
Figure 4.16 Likelihood-magnitude matrix of expected impacts of Policy Option 2 ... 242
Figure 4.17 Likelihood-magnitude matrix of expected impacts of Policy Option 3 ... 243
Figure 4.18 Construction KPIs of the monitoring framework ... 253
Figure 4.19. Example of the use of alternative fuels in freight transport ... 254 Figure 5.1 Scheme for conducting “Performance measurement and Best Practice” . 257
List of Abbreviations
3PL Third Party Logistics Service Provider
4PL Fourth Party Logistics Service Provider
AA Association Agreement
AAGR Average Annual Growth Rates
ANS Air Navigation Services
ASEAN Association of South-East Asian Nations
ASLOG Association Française pour la Logistique
B2A Business to Administration
B2B Business to Business
B2C Business to Consumer
BE-LOGIC Benchmark Logistics for Co-modality
CEP Courier, Express and Parcel Services
CETA Comprehensive Economic and Trade Agreement
CO2 Carbon Dioxide
CSCMP Council of Supply Chain Management Professionals USA
DC Distribution Centre
DCFTA Deep and Comprehensive Free Trade Agreement
DDA Doha Development Agenda
EATMN European Air Traffic Management Network
EBIT Earnings Before Interest and Taxes
EDU Educational and vocational training institutions
EEA European Environment Agency
EEA European Economic Area
EETS European Electronic Toll Service
EFQM European Foundation of Quality Management Excellence
ELA European Logistics Association
EU European Union
EU ETS EU Emissions Trading System
EUF EU institutions providing financial support
FDI Foreign Direct Investment
FIB Financial Institutions / Banks
FMCG Fast Moving Consumer Goods
FTA Freight Transport Association UK
FTLAP Freight Transport Logistics Action Plan
FTO Freight Transport Operators
FYROM Former Yugoslav Republic of Macedonia
GATS General Agreement on Trade in Services
GDP Gross Domestic Product
GHG Greenhouse Gas
GNSS Global Navigation Satellite Systems
HGV Heavy Goods Vehicles
ICT Information and Communication Technology
IT Information Technology
ITS Intelligent Transport Systems
IWW Inland Waterway
KPA Key Performance Area
KPI Key Performance Indicator
KWH Kilo Watt Hour
Ldn Day-night Average Sound Level
LE Logistics Employees
LHV Longer and/or Heavier Vehicles
LIB Rail Liberalisation Index
LP Labour Productivity
LPE Logistics Process Efficiency
LPI Logistics Performance Index
LPO Logistics Professionals Organisation
LSP Logistic Service Provider
LTL Less Than Truckload
MS Member States
NMF National Ministries of Finance
NMVOC Non Methane Volatile Organic Compound
NOx Nitrogen Oxide
NFS New Financing Scheme
OBD On-Board Diagnostics
OCR Optical Character Recognition
OECD Organisation for Economic Cooperation and Development
PA Public Authorities
PEST Political, Economic, Socio-cultural and Technological factors
PESTLE
Political, Economic, Socio-cultural, Technological, Legal and Environmental factors
PM10 Particular Matter
R&D Research and Development
RFID Radio Frequency Identification
SCR Selective Catalytic Reduction
SD Standard Deviation
SEALS Statistical coverage and Economic Analysis of the Logistics Sector in the EU
SES Single European Sky
SH Shippers
SMART Strategic Measurement Analysis and Reporting Technique
SME Small and Medium-Sized Enterprise
SOx Sulphur Oxide
TEN-T Trans-European Transport Network
TERM Transport and Environment Reporting Mechanism
TFEU Treaty on the Functioning of the European Union
TIO Terminal Infrastructure Operators
TKM Tonnes-Kilometres
TT Travel Time
TTIP Transatlantic Trade and Investment Partnership
TWH Terra Watt Hour
UIRR International Union of Combined Road-Rail Transport Companies
VDI Verband Deutscher Ingenieure
Abstract
In this report support is provided for the development of an EU strategy for freight transport logistics. The report provides information on logistics trends and developments, and includes reviews of existing policies, supported by inputs from relevant key stakeholders. There is a clear need for the European Commission to develop a new logistics policy, focusing on the main problem areas of the logistics sector. These problem areas are: rising costs, increasing negative external effects and insufficient quality and quantity of relevant staff. In developing the logistics policy it is recommended that specific actions from earlier action plans are redefined and coordinated within the new policy. New actions need to be further developed. For some of them, additional impact assessments are recommended. Furthermore, it is recommended that coherent and consistent monitoring of the logistic sector’s performance is introduced. This would allow both companies and policy-makers to follow the logistic sector’s performance and monitor its behaviour, which is particularly important when it comes to considering new policy options and actions.
Résumé
Ce rapport apporte un appui au développement d’une stratégie européenne pour la logistique du transport de marchandises. Le rapport fournit des informations sur les tendances et les développements logistiques ainsi que des analyses des politiques existantes, soutenues par les apports d’acteurs clés. Il y a clairement une demande pour que la Commission européenne développe une nouvelle politique logistique, axée sur les principaux domaines de préoccupation du secteur logistique. Ces domaines critiques sont: l’augmentation des coûts, l’augmentation des effets externes négatifs et la pénurie de personnel compétent. Lors du développement de la politique logistique, il est préconisé que les actions spécifiques des plans d’action antérieurs soient redéfinies et intégrées à la nouvelle politique. De nouvelles actions doivent encore être développées. Pour certaines d’entre elles des évaluations d’impact complémentaires sont requises. De plus, il faut instaurer un suivi cohérent et logique des performances du secteur logistique. Ceci devrait permettre tant aux sociétés qu’aux responsables politiques de suivre l’évolution du secteur logistique et d’évaluer son comportement, ce qui revêt une importance particulière lorsqu’il s’agit d’envisager de nouvelles options et actions stratégiques.
Executive summary
Economic growth is at the heart of Europe’s strategy. An effective and efficient EU market is a precondition for economic progress, and logistics play a pivotal role in this. Therefore it is important to have a focused set of policy actions to optimise and improve the performance of the logistics sector.
The logistics sector is vital to the effective and efficient functioning of the internal EU market, as a frictionless logistics sector is a key enabler for the free flow of goods through the EU. Moreover, the sector contributes significantly to GDP and employment in Europe, both directly through creating jobs and adding value, but also through enabling other economic sectors to perform efficiently.
The current performance of the EU logistics sector is at a high level, only surpassed by the performance of the United States and Japan. However, a number of issues are threatening this performance. These include rising logistics costs, the negative environmental footprint of the sector and an increasing shortage of qualified staff. These problems will persist in the future and might possibly even worsen.
Seven years ago, the European Commission adopted and implemented an action plan for the logistics sector (FTLAP 2007) to tackle the problems that were present at the time. This action plan has had a positive effect on the overall functioning of the logistics sector. However, the current issues faced by the sector call for renewed policy actions that expand and build on the actions developed previously.
To address this need, the Commission initiated a study to further analyse the logistics sector. This executive summary presents the highlights of this study. The underlying report holds a considerable amount of supporting evidence and examples, and can be used as a reference when discussing the future of the European freight transport logistics sector.
Report
The overall purpose of this report is to provide understanding of the scope, functioning and performance of the European freight transport logistics sector, to enable the development of a mid-to long-term EU policy. Part of this understanding will be gained through an analysis of the European logistics sector and the challenges it is facing that impact its future development. This will provide the rationale and insight to develop relevant and effective policy actions to improve this situation.
The report provides information on logistics trends and developments, and includes reviews of existing policies. This is further supported by inputs from relevant key stakeholders.
Several different methods have been used throughout the study, combining (top-down) data analysis and (bottom-up) market analysis. Performances and trends have been identified and analysed, both from a data point of view and a stakeholder point of view. Furthermore, future scenarios have been developed and analysed. Together with a review of the former policy actions at European level, new policy actions have been defined, followed by an impact analysis to gain insight into the potential impacts of these policy options on relevant output indicators.
As such, the report provides a solid basis and understanding for anyone with an interest in the logistics sector of today, and who wants to play a role in the debate on its future.
Key findings
The European freight transport logistics sector contributes significantly to the European economy. The value added and jobs generated by the sector are significant. Moreover, the sector functions as a key enabler in the effective and efficient functioning of other services and economic activities. Transport and warehousing are the most prominent economic activities within the logistics sector, representing the majority of added value created.
The EU logistics sector performs above the world average, although some countries (e.g. Japan and the United States) are clearly outperforming Europe. The performance varies strongly between EU Member States, as a result of differences in economic and industrial strength, geographical conditions, infrastructure quality and population density.
The sector is faced with a large number of external developments and trends. These include both technology-driven ones (e.g. e-commerce, e-procurement, etc.), and developments that focus on enhanced collaboration and integration within the logistical chain (e.g. supply chain integration, multi-modality and reverse logistics). There are three clear problem areas for the European freight transport logistic sector that exist today and will remain in the foreseeable future. These problems will lead to an ineffective and inefficient use of transport modes within the sector. The first problem is the continuous rise in costs, in particular for transport activities (although other cost components also show increases). The second problem area relates to the external environmental effects of the logistics sector, where energy use and CO2
emissions are threatening its sustainability. The third key issue concerns the quality and quantity of relevant staff. These problems not only affect the sector’s contribution to Europe’s society, but also limit the ability of stakeholders to respond to their customer requirements.
These problem areas are structural and continue to persist in all four future scenarios that have been developed as part of this study. These scenarios have been developed around two distinct drivers which influence the future of the logistics industry, encompassing the main uncertainties that impact the sector. These are the uncertainties around the economic development of Europe from stagnant to dynamic and prosperous and uncertainty related to the spatial patterns of production and consumption (from regional to global levels).
To address these problems that are challenging the logistics sector in Europe, various objectives have been formulated that lay the foundation for future policy actions. The utilisation of resources needs to be improved, new technologies need to be adapted faster and innovation needs to be stimulated, especially within SMEs. The interoperability between transport modes needs to be improved, as well as the coordination of the supply chain. Administrative barriers need to be removed and red tape reduced. The environmental sustainable behaviour of sector agents and governments should be enhanced, and the use of alternative solutions (fuel, technology and business models) needs to be accelerated, resulting in lower negative externalities. Finally, the attractiveness and understanding of logistics professions needs to be strengthened.
The European Commission has various policy options to realise these objectives and in this study three were identified. Each of these options consists of a proposed set of specific actions to tackle the most important problems in the logistics sector.
The first policy option is a selective continuation of FTLAP 2007. Those FTLAP 2007 actions that are deemed particularly relevant to address the current and future problems are continued under this option.
The second policy option adopts the same actions as the first policy option, but expands them with what is called an extra “minimum intervention” in the logistics market. The specific actions that are added in this policy option aim to create a framework for business to further excel. Actions comprise, for example, creating a framework for clean technology standards that encourages investment in an initial level of electricity charging points in urban areas, and raises end users’ awareness of the last-mile impact of e-commerce. In this option further development and innovation is mostly left to the market.
The third policy option aims to provide more substantial support to the logistics market in the EU by proposing a set of actions that contribute significantly to the
market’s efficiency and effectiveness. It therefore leaves less freedom for the market,
but adds European Commission involvement in tackling the industry’s problems. Examples of possible actions are increasing access through national funds for technology innovation, organising campaigns and training support, creating standards for CO2 calculation methodology, stimulating price differentiation for return-trips on
e-commerce, and pursuing tax measures for the taking-up of alternative fuels.
Our analysis of the possible impacts of these policy options demonstrates that the third option would be most effective in terms of achieving the specified objectives and would contribute most to resolving the problems of the logistics sector in the EU. This third option, however, also requires the strongest policy intervention from the Commission, requiring the highest amount of financial support and the creation of a pro-active action plan towards creating the necessary support for the logistics sector. Recommendations
The analysis has shown that there is a clear need for the European Commission to develop a new mid- to long-term logistics policy, focusing on the main problem areas of the logistics sector (rising costs, external effects and staffing). In developing the logistics policy it is recommended that specific actions from earlier action plans are redefined and coordinated within the new policy. New actions need to be further developed. For some of them, additional impact assessments are recommended. Furthermore, it is recommended that coherent and consistent monitoring of the logistic sector’s performance is introduced. This would allow both companies and policy-makers to follow the logistic sector’s performance and monitor its behaviour, which is particularly important when it comes to considering new policy options and actions. An improved information base on the state of the sector should allow for timely reactions to the sector’s (under) performance and help evaluate policy actions.
Résumé
Le développement économique est au cœur de la stratégie européenne. Un marché européen efficace et productif est une condition préalable au progrès économique et la logistique joue un rôle essentiel dans ce processus. Il importe dès lors de disposer
d’une série de plans d’action ciblés visant à optimiser et améliorer les performances du
secteur logistique.
Le secteur logistique est indispensable au fonctionnement efficace et performant du marché intérieur de l’UE, un secteur logistique harmonisé garantissant la libre circulation des marchandises à travers l’UE. De plus, ce secteur contribue de manière significative à la croissance du produit intérieur brut et de l’emploi en Europe, d’une part de manière directe en créant des emplois et de la valeur ajoutée, et d’autre part
en permettant à d’autres secteurs économiques de fonctionner avec efficacité.
Les performances actuelles du secteur logistique de l’UE atteignent un niveau élevé, qui n’est dépassé que par les Etats Unis et le Japon. Toutefois, certains aspects négatifs menacent de compromettre ces résultats. Ils incluent la croissance des coûts logistiques, l’impact environnemental négatif du secteur et une pénurie croissante de
main d’œuvrequalifiée. Ces problèmes vont persister dans l’avenir et menacent même
de s’aggraver.
Il y a sept ans, la Commission européenne a adopté et mis en œuvre un plan d’action destiné au secteur logistique (FTLAP 2007), pour faire face aux problèmes détectés à l’époque. Ce plan d’action a eu un effet positif sur l’ensemble du fonctionnement du
secteur logistique. Toutefois, les problèmes auxquels le secteur est confronté à l’heure
actuelle requièrent de nouvelles mesures stratégiques visant à développer et intensifier les actions déjà entreprises.
Pour répondre à cette nécessité, la Commission a initié une étude visant à analyser de manière plus approfondie le secteur logistique. Cette synthèse présente les principaux éléments de cette étude. Le rapport proprement dit apporte un nombre considérable de données probantes et d’exemples et peut servir de référence lors de l’examen de l’avenir du secteur logistique du transport de marchandises européen.
Rapport
L’objectif global de ce rapport est de fournir des informations utiles sur le champ
d’action, le fonctionnement et les performances du secteur logistique du transport de
marchandises européen, pour permettre le développement d’une politique européenne à moyen et long terme. Cette prise de connaissance se fera en partie sur base d’une analyse du secteur logistique européen ainsi que des problèmes auxquels il est confronté et qui ont une incidence sur son développement futur. Elle fournira des bases et des perspectives en vue d’élaborer des plans d’action efficaces destinés à améliorer cette situation.
Le rapport apporte des informations sur les évolutions et développements logistiques et inclut les analyses de politiques existantes. Ces données sont étayées par des contributions d’acteurs clés.
Plusieurs méthodes différentes ont été utilisées lors de l’élaboration de cette étude, combinant les analyses de données descendantes et des analyses de marché ascendantes. Performances et tendances ont été identifiées et analysées tant du point de vue des données que du point de vue des parties prenantes. De plus, de futurs scénarios ont été élaborés et analysés. En même temps qu’une évaluation des anciens
plans d’action au niveau européen, de nouveaux plans d’action ont été définis, suivis d’une analyse d’impact permettant d’obtenir une vision approfondie des impacts potentiels de ces options stratégiques sur des indicateurs de résultats pertinents. Comme tel, le rapport constitue une excellente base de compréhension pour celui qui s’intéresse au secteur logistique actuel et souhaite jouer un rôle dans le débat du futur.
Principales constatations
Le secteur logistique du transport de marchandises européen contribue de manière significative à l’économie européenne. La valeur ajoutée et les emplois générés par le secteur sont significatifs. De plus le secteur joue un rôle clé dans le fonctionnement
efficace et performant d’autres services et activités économiques. Le transport et
l’entreposage sont les activités économiques les plus marquantes du secteur logistique et représentent la majorité de la valeur ajoutée engendrée.
Les résultats du secteur logistique européen dépassent la moyenne mondiale, bien que certains pays (p.ex. le Japon et les Etats Unis) se montrent nettement plus performants que l’Europe. On enregistre une forte variation des résultats entre les
Etats membres de l’UE, due aux différences de puissance économique et industrielle,
aux configurations géographiques, à la qualité de l’infrastructure et à la densité de population.
Le secteur est confronté à un grand nombre de développements et évolutions externes. Ils incluent des développements et évolutions issus de la technologie (p.ex. e-commerce, passation de marchés en ligne, etc.) ainsi que des développements axés sur une meilleure collaboration et intégration au sein de la chaîne logistique (p.ex.
intégration de la chaîne de l’offre, et logistiques multimodales et de recyclage).
Il y a clairement trois domaines critiques liés au secteur de la logistique du transport de marchandises qui existent aujourd’hui et vont perdurer dans un avenir prévisible. Ces problèmes vont avoir pour effet une utilisation inefficace et non productive des modes de transport dans le secteur. Le premier problème est la croissance permanente des coûts, en particulier pour les activités de transport (bien que d’autres composantes du coût subissent également des augmentations). Le second domaine critique concerne l’impact environnemental externe du secteur logistique, la consommation d’énergie et les émissions de CO2 mettant en péril sa viabilité. Le troisième problème majeur concerne la qualité et la quantité de personnel qualifié. Ces problèmes affectent non seulement la contribution du secteur à la société européenne, mais empêchent également les acteurs concernés de satisfaire correctement les exigences de leurs clients.
Ces domaines critiques sont structuraux et continuent de persister dans les quatre scénarios d’avenir élaborés dans cette étude. Ces scénarios ont été développés autour de deux paramètres distincts qui influencent l’avenir de l’industrie logistique et englobent les principales incertitudes qui pèsent sur le secteur. Il s’agit des incertitudes concernant le développement économique de l’Europe (qui peuvent être associées à diverses tendances allant de stagnante à dynamique et prospère) et de
l’incertitude liée aux structures spatiales de production et de consommation (du
niveau régional au niveau mondial).
Pour résoudre les problèmes auxquels le secteur logistique européen doit faire face, divers objectifs qui jettent les bases de futurs plans d’action ont été formulés.
adaptées plus rapidement et l’innovation doit être stimulée, en particulier au sein des PME. L’interopérabilité entre les modes de transport ainsi que la coordination de la
chaîne d’approvisionnement doivent être améliorées. Les barrières administratives
doivent disparaître et la bureaucratie doit être réduite. Le comportement respectueux de l’environnement des administrations publiques et de leurs agents doit progresser,
et l’utilisation de solutions alternatives (carburants, modèles technologiques et
économiques) doit être accélérée pour aboutir à la réduction des effets externes négatifs. Enfin, l’attractivité et la perception des métiers de la logistique doivent être améliorées
La Commission européenne dispose de différentes options stratégiques pour réaliser ces objectifs et nous en avons identifié trois. Chacune de ces options propose une série d’actions spécifiques destinées à résoudre les principaux problèmes du secteur logistique.
La première option stratégique est une poursuite sélective de FTLAP 2007. Selon cette option, les actions de FTLAP 2007 jugées particulièrement appropriées pour faire face aux problèmes actuels et futurs seront poursuivies.
La seconde option stratégique adopte les mêmes stratégies que la première, mais la renforce par une « intervention minimum » complémentaire dans le marché de la logistique. Les actions spécifiques qui viennent s’ajouter dans cette option stratégique visent à créer une structure destinée à promouvoir l’excellence dans le monde des affaires. Ces actions comprennent par exemple la création d’une structure pour des normes de technologie propre qui encouragent l’investissement dans un niveau initial de bornes de recharge électrique en zones urbaines et sensibilise les consommateurs finaux à l’impact du « dernier kilomètre » du commerce électronique. Dans cette option, le développement ultérieur et l’innovation sont principalement du ressort du marché.
La troisième option stratégique a pour but d’apporter un appui plus large au marché logistique dans l’UE en proposant une série d’actions destinées à contribuer de manière significative à l’efficacité et à l’efficience du marché. Elle réduit dès lors l’espace de liberté du marché mais apporte l’aide de la Commission européenne pour résoudre les problèmes de l’industrie. Des exemples d’actions possibles concernent l’amélioration de l’accès à l’innovation technologique grâce à des fonds nationaux,
l’organisation de campagnes et de soutien à la formation, la création de normes en
matière de méthodologie de calcul du CO2, la stimulation de la différentiation des prix pour les trajets aller-retour sur les sites de commerce en ligne, et la poursuite de
mesures fiscales en faveur de l’adoption de carburants alternatifs.
Notre analyse des répercussions possibles de ces plans d’action démontre que la troisième option sera la plus efficace pour atteindre les objectifs fixés et aura le plus d’impact pour remédier aux problèmes du secteur logistique de l’UE. Toutefois, cette troisième option implique la plus importante intervention politique de la Commission, car elle nécessite la plus grande participation financière et l’élaboration d’un plan
d’action pro-actif destiné à apporter un soutien indispensable au secteur logistique.
Recommandations
L’analyse a démontré qu’il y a clairement une demande pour que la Commission européenne développe une nouvelle politique logistique à moyen et long terme axée sur les principaux domaines de préoccupation du secteur logistique (augmentation des coûts, nuisances externes et manque de personnel). Lors du développement de la politique logistique, il est préconisé que les actions spécifiques des plans d’action antérieurs soient redéfinies et intégrées à la nouvelle politique. De nouvelles actions
doivent encore être développées. Pour certaines d’entre elles des évaluations d’impact complémentaires sont requises. De plus, il faut instaurer un suivi cohérent et logique des performances du secteur logistique. Ceci devrait permettre tant aux sociétés qu’aux responsables politiques de suivre les performances du secteur logistique et d’évaluer son comportement, ce qui revêt une importance particulière lorsqu’il s’agit
d’envisager de nouvelles options et actions stratégiques. Une meilleure base
d’informations sur l’état du secteur devrait permettre de réagir en temps opportun aux (sous) performances du secteur et aider à évaluer les actions stratégiques.
1.
Introduction
1.1 Background
Logistics is a set of services including the planning, organisation, management, execution and monitoring of a company’s entire material, goods and information flows (from purchasing, production and warehousing, to added value services, distribution and reverse logistics). Studies have estimated that, within the EU, this sector
represented a market volume of nearly €878 bn in 20121.
The importance of logistics has been elevated enormously in the globalised economy as it represents the backbone of highly complex and globally extended supply chains, which require the efficient, cost-effective and reliable flow of goods and information. Freight transport logistics is, therefore, highly dependent on the external environment that shapes the needs and patterns for production and consumption of goods. As such, the logistics sector is a dynamic system that continuously needs to adapt to the new challenges and chances that the development of the socio-cultural, economic, technological and political environment provides.
The Commission highlighted the importance of the freight transport logistics sector in a 2006 Communication2, in which it identified areas for possible actions to help
improve the performance of the sector and remove bottlenecks. Subsequently, the Commission adopted the Freight Transport Logistics Action Plan (FTLAP) in 20073,
proposing concrete measures which aimed to create a more sustainable and competitive logistics sector in the EU.
EU logistics policy has an important facilitating function in maintaining the global competitive position of the logistics sector and positively contributing to the EU economy in a sustainable way. Given the dynamic character of the logistics sector and rapid pace at which certain technological developments advance, the Commission is looking ahead to 2030 defining a mid- to long-term strategy for the European freight transport logistics sector.
In order to help choose the right approach and measures for future policies, this study provides the Commission with:
A sound knowledge and understanding of the current scope, functioning and performance of the logistics sector within the EU;
An analysis of the (external) trends and challenges the sector is likely to face in the mid- to long-term perspective, as well as the effects these trends might have;
An assessment of market trends that should be addressed in the reviewed FTLAP and proposals for appropriate policy options;
An analysis of impacts of proposed future logistics policy options;
An inventory of existing performance measurement tools and concrete recommendations for assessing logistics performance at country level and at company level.
1 See Kille/Schwemmer: Top 100 in European Transport and Logistics Services, DVV Media Group, Hamburg, 2013, p. 48.
2 COM (2006) 336 final of 28.06.2006 "Freight Transport Logistics in Europe – the key to sustainable mobility.
Ultimately, the study “contributes to such a knowledge basis and understanding, enabling the development of a mid- to long-term policy strategy for the European
freight transport logistics sector.” Such a strategy could follow-up the FTLAP currently
in place.
The study forms part of a wider range of interlinked studies. In its invitation to tender (Nº MOVE/D1/335-1), the Directorate-General for Mobility and Transport (DG MOVE)
of the European Commission has identified four lots as part of the “Fact-finding studies
in support of the development of an EU strategy for freight transport logistics”. This
study corresponds to “Lot 1: Analysis of the EU logistics sector”, and was carried out
by the study consortium consisting of Ecorys, Fraunhofer, TCI, Progtrans AG and AUEB-RC/TRANSLOG.
Stakeholder consultation
The involvement of stakeholders was crucial in this study. The study initiated a questionnaire and a workshop in order to gain input for the analysis and obtain views of stakeholders on the problems in the area of logistics.
In the questionnaire, sent to 400+ stakeholders, the representatives provided feedback on the identified problems, logistic trends, FTLAP actions, logistics performance measurement and proposed policy objectives. The questionnaire was online during the period December 2013 – January 2014.
The workshop of 4 July 2014 provided a final stakeholder consultation round, with 35 key stakeholders present. During the workshop the outlined policy options were presented and discussed with the stakeholders. They reflected on the strategies, indicators and problem definitions, and discussed all seven policy objectives separately.
The results of the stakeholder consultation are presented in Annex VII of the report.
1.2 Report structure
This is the final report of the Lot 1 study “Analysis of the EU logistics sector”. The study was built upon four tasks, which were defined under the Tender Specifications of the study4. Each of the tasks was performed under the responsibility of the task
leader:
Task 1:Statistical Analysis - Fraunhofer;
Task 2: Performance indicators and benchmarking – TCI;
Task 3: Trends and external developments - Progtrans AG;
Task 4: Review and follow-up of FTLAP – Ecorys.
AUEB-RC/TRANSLOG worked together with the task leaders within task 2 and task 3. The relation between the abovementioned tasks of the whole study and the chapters as presented in this report is shown in the table below.
4 CALL FOR TENDERS N° MOVE/D1/355-1;"Fact-finding studies in support of the development of an EU strategy for freight transport logistics": TENDER SPECIFICATIONS.
Table 1.1 Relation between the study tasks and report chapters
Task/Chapters Chapter 2 Chapter 3 Chapter 4 Chapter 5
Task 1
Task 2
Task 3
Task 4
1.2.1 Structure and relation between the chapters of the final report
This final report is built around four specific but interlinked chapters, which are necessary to contribute to the required knowledge base and understanding for future EU logistics policy. An illustrative overview of the chapters is provided in the figure below.
Figure 1.1 Overview of the chapters – final report
An understanding of the relevant problems of the logistics industry is an important pre-condition to defining a new set of policy options for EU logistics in the mid- to long-term. Therefore, this report is chronologically structured. The problem base to be addressed for future logistics policy is based on currently observed and future problems.
Chapter 2 presents a complete statistical basis, which provides key parameters regarding the structure, costs, performance and added value of the EU logistics sector. The inventory of data is based on currently available sources. This chapter presents further evidence for the current problems within the European logistics sector. In addition, the recommendations are made with regard to the improvement of the collection of statistics on logistics within the EU.
Furthermore, the study identifies trends within external factors and business strategies. Illustrative scenarios are developed on the main trends which are expected to pose new challenges to the EU logistics system in the future (Chapter 3). This chapter builds on the earlier identified problems and presents the problems for the future, not tackled by the market itself.
With this background, the study brings together the problems identified and proposes follow-up policy options for FTLAP. An ex-ante assessment of these options is carried out. The current FTLAP actions are reviewed based on their relevance to the current and future outlook of the EU logistics sector (Chapter 4). The problem definition is built on the findings from Chapters 2 and 3.
Finally, recommendations are made concerning the assessment of logistics performance and benchmarking tools (Chapter 5). This includes a proposal for measuring and benchmarking the performance of logistics, at micro and national level. There is a close relationship between this chapter and the last part of Chapter 2 – "Performance of EU freight transport logistics".
A literature list is included as Annex I, and an evaluation of secondary logistics sources as Annex II. Annex III comprises logistics market segment descriptions and Annex IV presents the input-output methodology for assessing the added value of logistics. Annex V presents the metadata of all data collected. Annex VI identifies data availability problems. The stakeholder questionnaire is analysed in detail in Annex VII and Annex VIII presents factsheets of logistics performance studies. Annex IX additionally evaluates possible KPI for logistics.
2.
Overview and performance of the EU logistics sector
2.1 Introduction
Logistics systems are enablers of a work-sharing economy, with high interactions between the countries of Europe, and are therefore highly complex. The whole European logistics market size (including the EU28 countries) amounted to about € 878 bn in 20125. However, although the availability of statistics and other sources has
increased in the last couple of years, there still exists a lack of systematic and consistent data in the field of transport and logistics – especially at a pan-European level.
In this study, logistics is considered as a set of services including the planning, organisation, management, execution and monitoring of a company’s entire material, goods and information flows (from purchasing, production and warehousing, to added value services, distribution and reverse logistics).
To provide an adequate statistical basis for a mid- and long-term policy strategy for the EU logistic sector, the study analyses and evaluates the available logistics data in the EU and identifies gaps, as well as solutions, for the logistics data collection.
In this chapter a number of analytical steps have been carried out:
Analysis of existing studies and reports in the field of logistical data;
Review and evaluation of retrievable and available public and commercial statistics;
Identification of gaps in quantity, quality and detail of those sources;
Application of existing or development of new methods to close the data gaps; Documentation of sources, update processes and methods on country and
aggregated European level.
The focus of the statistical basis is to provide as much quantified data from public, reliable sources as possible. The figures should cover all EU28 countries and represent a time series from 2005 to 2012. In the events that there is a dearth of sources or reasonable doubts about the quality, expert judgements will be used to close these gaps. In this case, the affected data is marked as estimated and methods of statistical methodology will be explained.
The next figure shows all four sub-task of task 1.
Figure 2.1 Sub-tasks and content of this chapter
As a whole, this chapter presents the results of the above mentioned sub-tasks. The first sub-task (1.1) analyses the logistics market structure and provides important key figures of logistics service providers in Europe. Sub-task 1.2 creates transparency of the logistics costs structure. In sub-task 1.3, the economic added value of logistics is derived from the national macroeconomic total accounts. This analysis shows how
5 See Kille/Schwemmer: Top 100 in European Transport and Logistics Services, DVV Media Group, Hamburg, 2013, p. 48.
Sub-Ta
sk
s
1.1 Analysing the Logistics Market Structure 1.2 Creating of Logistics Costs Transparency 1.3 Logistics Performance of Sectors and Subsectors 1.4 Evaluation/Comparing the Performance of Logistics Performanceimportant logistics is for single sectors (primary, secondary, tertiary economic sectors) and subsectors (certain industries). It also shows how different Member States perform in comparison to one another and the EU as a whole. Finally, the performance of the logistics systems in Europe is evaluated and compared to a selected number of non-European countries under sub-task 1.4. In the course of subtask 1.4, input from task 2 (performance indicators and best practices) is taken into consideration.
The underlying statistical dataset, which covers the indicators of sub-task 1.4, is issued as a separate file to the Commission Services of DG MOVE. Annex V presents the structure and content of this dataset in more detail. Annex II presents the evaluation of the secondary sources used as input for this chapter.
2.2 Preliminary analysis of data sources and data to collect
2.2.1 Source screening
The analysis of existing studies, the review of retrievable statistics and the evaluation of possible data sources is a fundamental task prior to task 1 content and data analysis.
The main relevant sources are the studies “SEALS – Statistical coverage and economic
analysis of the logistics sector in the EU” and “BE-LOGIC - Benchmark Logistics for
Co-modality”, which were carried out for the EU Commission in the years 2008 (SEALS) and 2011 (BE-LOGIC).
Another category of valid sources are the national statistics institutes of the EU Member States and the Eurostat database.
As the collection also addresses data with additional information, complementary sources are evaluated. The following table gives a list of sources and works which have been evaluated with an assessment profile that shows what kind of research was conducted.
Table 2.1 Secondary data source evaluation
Overview of evaluated secondary data sources (as from 02-2014)
No. Organisation / Title of publication S
ingle re lease Rese arch por ta l D at abase
1 ACEA (European Automobile Manufacturers Association) - Tax Guide
2 BMWI (Federal Ministry for Economic Affairs and Energy) - The Trend of Energy Markets up to the Year 2030
3 Bureau van Dijk - Company Database AMADEUS
4 CEA (European Insurance and Reinsurance Federation) - The European Motor Insurance Market
5 CIA (Central Intelligence Agency) - The World Factbook
6 Cushman & Wakefield – Research
7 Deka Bank - Europäische Logistikmärkte
8 Deka Bank - Real Estate Research
9 DIW (Deutsches Institut für Wirtschaftsforschung) - Research & Advice
Overview of evaluated secondary data sources (as from 02-2014)
No. Organisation / Title of publication S
ingle re lease Rese arch por ta l D at abase
10 ECG (Association of European Vehicle Logistics) - Fuel Prices
11 Economy Watch - Economic Statistics
12 ESPO (European Sea Ports Organisation) - Statistics
13 Fraunhofer SCS - The Top 100 in European Transport and Logistics Services
14 Frost & Sullivan – Research
15 IEA (International Energy Agency) – Research
16 IRF (International Road Federation) - IRF World Road Statistics (WRS)
17 IRU (International Road Transport Union)
18 ITF (International Transport Forum)
20 Jones Lang LaSalle - Logistikimmobilien Report Deutschland
21 Jones Lang LaSalle - Research Germany
19 Jones Lang LaSalle - Global Market Research
22 KombiConsult
23 OECD (Organisation for Economic Cooperation and Development) - Economic Outlook
24 OECD.Stat (Organisation for Economic Cooperation and Development)
25 Postbank – Research
26 ProgTrans - World Report
27 Savills - Research (Germany, Europe, Asia-Pacific Region)
28 The World Bank - Logistics Performance Indicator
29 UIC (International Union of Railways)
30 UIRR (International Union of Combined Road-Rail Transport Companies)
31 UNCTADStat (United Nations Conference on Trade and Development)
32 UNECE Statistical Database (United Nations Economic Commission for Europe)
Source: Fraunhofer SCS.
The publications are categorised as single release (e.g. Top 100 market surveys), portals that provide different publications (e.g. Postbank Research) or databases (e.g. OECD Stat).
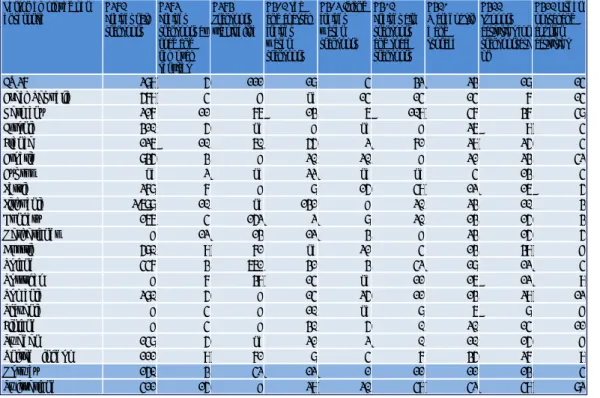
The following figure shows one of the source profiles provided by the “Top 100 in European Transport and Logistics Services” reports.
Figure 2.2 Source evaluation of Top 100 in European Transport and Logistics Services reports
Source: Fraunhofer SCS.
The dimensions that have been rated per source are:
“Type of survey” – describes the data collection. The categories are: “Census”,
“Sample Representative”, “Sample not Representative” and “Secondary Data”;
“Interrogation” – shows if data is collected by “Interviews”, “Questionnaire” or
“Case Studies”;
“General Approach” states if the report or study has a “Qualitative” or
“Quantitative” approach;
“Frequency” of publication or data update – categories are “Once”,
“Infrequent”, “Biannual” and “Annual”;
“Geographical Scope” – shows which geographical area is addressed or
evaluated by the conducted works;
“Geographical Detail” – evaluates the granularity of data, i.e. on which level
figures and indicators within the evaluated report are assessing the lo