Leveraged Buyouts and
Private Equity
S tE vEn n. K aPL an PEr S trömBErg nO 65 — february 20 09
SIFR – the Institute for Financial Research is an independent non-profit organization established at the initiative of members of the financial industry and actors from the academic arena. SIFR started in 2001 and is situated in the center of Stockholm. Professor Per Strömberg serves as director of the institute. The mission of SIFR is to:
Conduct and stimulate high quality research on issues in financial economics, where there are promising prospects for practical applications,
Disseminate research results through publications, seminars, conferences, and other meetings, and
Establish a natural channel of communication about research issues in finance between the academic world and the financial sector.
The activities of SIFR are supported by a foundation based on donations from Swedish financial institutions. Major donations have been made by: AFA, Alecta, Alfred Berg, AMF Pension, Brummer & Partners, Carnegie, Danske Bank, Handelsbanken, Kapitalmarknads-gruppen, Länsförsäkringar, Nordea, and Svenska Fondhandlareföreningen.
In addition, SIFR is directly sponsored by some institutions. Nasdaq OMX funds research projects and several positions at SIFR, including the Olof Stenhammar professorship in financial entrepreneurship. Stockholm School of Economics funds two research positions, and Sveriges Riksbank funds a visiting professorship at SIFR.
SIFR also gratefully acknowledges research grants received from Stiftelsen Bankforsknings-institutet, Föreningsbankens Forskningsstiftelse, Jan Wallanders och Tom Hedelius Stiftelse, Riksbankens Jubileumsfond, Johan och Jakob Söderbergs Stiftelse, Torsten och Ragnar Söderbergs Stiftelser, and Foundation for Economics and Law.
Institute for Financial Research, SIFR, Drottninggatan 89, SE-113 60 Stockholm, Sweden Phone: +46 (8) 728 51 20, Fax +46 (8) 728 51 30, E-mail: info@sifr.org, Web: www.sifr.org
Leveraged Buyouts and Private Equity
Leveraged Buyouts and Private Equity
Steven N. Kaplan and Per Stro¨mberg
I
n a leveraged buyout, a company is acquired by a specialized investment firm using a relatively small portion of equity and a relatively large portion of outside debt financing. The leveraged buyout investment firms today refer to themselves (and are generally referred to) as private equity firms. In a typical leveraged buyout transaction, the private equity firm buys majority control of an existing or mature firm. This arrangement is distinct from venture capital firms that typically invest in young or emerging companies, and typically do not obtain majority control. In this paper, we focus specifically on private equity firms and the leveraged buyouts in which they invest, and we will use the terms private equity and leveraged buyout interchangeably.Leveraged buyouts first emerged as an important phenomenon in the 1980s. As leveraged buyout activity increased in that decade, Jensen (1989) predicted that the leveraged buyout organizations would eventually become the dominant corporate organizational form. He argued that the private equity firm itself combined concentrated ownership stakes in its portfolio companies, high-powered incentives for the private equity firm professionals, and a lean, efficient organization with minimal overhead costs. The private equity firm then applied performance-based managerial compensation, highly leveraged capital structures (often relying on junk bond financing), and active governance to the companies in which it invested. According to Jensen, these structures were
y
Steven N. Kaplan is Neubauer Family Professor of Entrepreneurship and Finance, Uni-versity of Chicago Graduate School of Business, Chicago, Illinois. Per Stro¨mberg is Professor of Finance at the Stockholm School of Economics and Director of the Swedish Institute of Financial Research (SIFR), both in Stockholm, Sweden. Both authors are also Research Associates, National Bureau of Economic Research, Cambridge, Massachusetts. Their e-mail addresses are 具per.stromberg@sifr.org典.superior to those of the typical public corporation with dispersed shareholders, low leverage, and weak corporate governance. A few years later, this prediction seemed premature. The junk bond market crashed; a large number of high-profile leveraged buyouts resulted in default and bankruptcy; and leveraged buyouts of public companies (so called public-to-private transactions) virtually disappeared by the early 1990s.
But the leveraged buyout market had not died—it was only in hiding. While leveraged buyouts of public companies were relatively scarce during the 1990s and early 2000s, leveraged buyout firms continued to purchase private compa-nies and divisions. In the mid-2000s, public-to-private transactions reappeared when the U.S. (and the rest of the world) experienced a second leveraged buyout boom.
In 2006 and 2007, a record amount of capital was committed to private equity, both in nominal terms and as a fraction of the overall stock market. Private equity commitments and transactions rivaled, if not overtook the activity of the first wave in the late 1980s that reached its peak with the buyout of RJR Nabisco in 1988. However, in 2008, with the turmoil in the debt markets, private equity appears to have declined again.
We start the paper by describing how the private equity industry works. We describe private equity organizations such as Blackstone, Carlyle, and KKR, and the components of a typical leveraged buyout transaction, such as the buyout of RJR Nabisco or SunGard Data Systems. We present evidence on how private equity fundraising, activity, and transaction characteristics have varied over time.
The article then considers the effects of private equity. We describe the changes in capital structures, management incentives, and corporate governance that private equity investors introduce, and then review the empirical evidence on the effects of these changes. This evidence suggests that private equity activity creates economic value on average. At the same time, there is also evidence consistent with private equity investors taking advantage of market timing (and market mispricing) between debt and equity markets particularly in the public-to-private transactions of the last 15 years.
We also review the empirical evidence on the economics and returns to private equity at the fund level. Private equity activity appears to experience recurring boom and bust cycles that are related to past returns and to the level of interest rates relative to earnings. Given that the unprecedented boom of 2005 to 2007 has just ended, it seems likely that there will be a decline in private equity investment and fundraising in the next several years. While the recent market boom may eventually lead to some defaults and investor losses, the magnitude is likely to be less severe than after the 1980s boom because capital structures are less fragile and private equity firms are more sophisticated. Accordingly, we expect that a significant part of the growth in private equity activity and institutions is permanent.
Private Equity Firms, Funds, and Transactions
Private Equity Firms
The typical private equity firm is organized as a partnership or limited liability corporation. Blackstone, Carlyle, and KKR are three of the most prominent private equity firms. In the late 1980s, Jensen (1989) described these organizations as lean, decentralized organizations with relatively few investment professionals and em-ployees. In his survey of seven large leveraged buyout partnerships, Jensen found an average of 13 investment professionals, who tended to come from an investment banking background. Today, the large private equity firms are substantially larger, although they are still small relative to the firms in which they invest. KKR’s S-1 (a form filed with the Securities and Exchange Commission in preparation for KKR’s initial public offering) reported 139 investment professionals in 2007. At least four other large private equity firms appear to have more than 100 investment profes-sionals. In addition, private equity firms now appear to employ professionals with a wider variety of skills and experience than was true 20 years ago.
Private Equity Funds
A private equity firm raises equity capital through a private equity fund. Most private equity funds are “closed-end” vehicles in which investors commit to provide a certain amount of money to pay for investments in companies as well as man-agement fees to the private equity firm.1Legally, private equity funds are organized as limited partnerships in which the general partners manage the fund and the limited partners provide most of the capital. The limited partners typically include institutional investors, such as corporate and public pension funds, endowments, and insurance companies, as well as wealthy individuals. The private equity firm serves as the fund’s general partner. It is customary for the general partner to provide at least 1 percent of the total capital.
The fund typically has a fixed life, usually ten years, but can be extended for up to three additional years. The private equity firm normally has up to five years to invest the fund’s capital committed into companies, and then has an additional five to eight years to return the capital to its investors. After committing their capital, the limited partners have little say in how the general partner deploys the investment funds, as long as the basic covenants of the fund agreement are followed. Common covenants include restrictions on how much fund capital can be invested in one company, on types of securities a fund can invest in, and on debt at the fund level (as opposed to debt at the portfolio company level, which is unrestricted). Sahlman (1990), Gompers and Lerner (1996), and Axelson, Stro¨m-berg, and Weisbach. (forthcoming) discuss the economic rationale for these fund structures.
1In a “closed-end” fund, investors cannot withdraw their funds until the fund is terminated. This
contrasts with mutual funds, for example, where investors can withdraw their funds whenever they like. See Stein (2005) for an economic analysis of closed- vs. open-end funds.
Steven N. Kaplan and Per Stro¨mberg 3
The private equity firm or general partner is compensated in three ways. First, the general partner earns an annual management fee, usually a percentage of capital committed, and then, as investments are realized, a percentage of capital employed. Second, the general partner earns a share of the profits of the fund, referred to as “carried interest,” that almost always equals 20 percent. Finally, some general partners charge deal and monitoring fees to the companies in which they invest. Metrick and Yasuda (2007) describe the structure of fees in detail and provide empirical evidence on those fees.
For example, assume that a private equity firm, ABC partners, raises a private equity fund, ABC I, with $2 billion of capital commitments from limited partners. At a 2 percent management fee, ABC partners would receive $40 million per year for the five-year investment period. This would decline over the following five years as ABC exited or sold its investments. The management fees typically end after ten years, although the fund can be extended thereafter. ABC would invest the differ-ence between the $2 billion and the cumulative management fees into companies. If ABC’s investments turned out to be successful and ABC was able to realize $6 billion from its investments—a profit of $4 billion—ABC would be entitled to a carried interest or profit share of $800 million (or 20 percent of the $4 billion profit). Added to management fees of $300 to $400 million, ABC partners would have received a total of up to $1.2 billion over the fund’s life.
In addition, general partners sometimes charge deal and monitoring fees that are paid by the portfolio companies. The extent to which these fees are shared with the limited partners is a somewhat contentious issue in fundraising negotiations. These fees are commonly split 50 –50 between general and limited partners.
The Private Equity Analyst (2008) lists 33 global private equity firms (22 U.S.-based) with more than $10 billion of assets under management at the end of 2007. The same publication lists the top 25 investors in private equity. Those investors are dominated by public pension funds, with CalPERS (California Public Employees’ Retirement System), CasSTERS (California State Teachers’ Retirement System), PSERS (Public School Employees’ Retirement System), and the Washington State Investment Board occupying the top four slots.
Private Equity Transactions
In a typical private equity transaction, the private equity firm agrees to buy a company. If the company is public, the private equity firm typically pays a premium of 15 to 50 percent over the current stock price (Kaplan, 1989b; Bargeron, Schlingemann, Stulz, and Zutter, 2007). The buyout is typically financed with 60 to 90 percent debt— hence the term, leveraged buyout. The debt almost always includes a loan portion that is senior and secured, and is arranged by a bank or an investment bank. In the 1980s and 1990s, banks were also the primary investors in these loans. More recently, however, institutional investors purchased a large fraction of the senior and secured loans. Those investors include hedge fund investors and “collateralized loan obligation” managers, who combine a number of term loans into a pool and then carve the pool into different pieces (with different
seniority) to sell to institutional investors. The debt in leveraged buyouts also often includes a junior, unsecured portion that is financed by either high-yield bonds or “mezzanine debt” (that is, debt that is subordinated to the senior debt). Demiroglu and James (2007) and Standard and Poor’s (2008) provide more detailed descriptions.
The private equity firm invests funds from its investors as equity to cover the remaining 10 to 40 percent of the purchase price. The new management team of the purchased company (which may or may not be identical to the pre-buyout management team) typically also contributes to the new equity, although the amount is usually a small fraction of the equity dollars contributed.
Kaplan (2005) describes a large leveraged buyout—the 2005 buyout of Sun-Gard Data Systems—in detail. Axelson, Jenkinson, Stro¨mberg, and Weisbach (2008) provide a detailed description of capital structures in these kinds of lever-aged buyouts.
Commitments to Private Equity Funds
Private equity funds first emerged in the early 1980s. Nominal dollars commit-ted each year to U.S. private equity funds have increased exponentially since then, from $0.2 billion in 1980 to over $200 billion in 2007. Given the large increase in firm market values over this period, it is more appropriate to measure committed capital as a percentage of the total value of the U.S. stock market. The deflated series, presented in Figure 1, suggests that private equity commitments are cyclical. They increased in the 1980s, peaked in 1988, declined in the early 1990s, increased through the late 1990s, peaked in 1998, declined again in the early 2000s, and then began climbing in 2003. By 2006 and 2007, private equity commitments appeared extremely high by historical standards, exceeding 1 percent of the U.S. stock market’s value. One caveat to this observation is that many of the large U.S. private equity firms have only recently become global in scope. Foreign investments by U.S. private equity firms were much smaller 20 years ago, so the comparisons are not exactly apples to apples.
Although we do not have comparable information on capital commitments to non-U.S. funds, it is clear that they also have grown substantially. In 2007, thePrivate Equity Analyst lists three non-U.S. private equity firms among the twelve largest in the world in assets under management.
Private Equity Transactions
Figure 2 shows the number and combined transaction value of worldwide leveraged buyout transactions backed by a private equity fund sponsor based on data from CapitalIQ. In total, 17,171 private equity-sponsored buyout transactions occurred from January 1, 1970, to June 30, 2007. (This excludes transactions announced but not completed by November 1, 2007.) Transaction values equal the enterprise value (market value of equity plus book value of debt minus cash) of the acquired firms, converted into 2007 U.S. dollars. When transaction values are not recorded (generally smaller, private-to-private deals), we impute values as a
func-Leveraged Buyouts and Private Equity 5
F1
Figure 1
U.S. Private Equity Fundraising and Transaction Values as a Percentage of Total U.S. Stock Market Value from 1985 to 2007
0.00% 0.50% 1.00% 1.50% 2.00% 2.50% 3.00% 3.50% 198 5 1986 1987 1988 1989 1990 1991 1992 1993 1994 1995 1996 1997 1998 1999 2000 2001 2002 2003 2004 2005 2006 2007 Private Equity Fundraising
Private Equity Transactions
Sources: Private Equity Analyst, CapitalIQ, Stro¨mberg (2008), authors’ calculations.
Figure 2
Global Private Equity Transaction Volume, 1985–2006
0 500 1000 1500 2000 2500 1985 Number 0 100 200 300 400 500 600 700 800 900 2007 $ (Billions)
Number of LBO transactions (Left axis)
Combined equity value of transactions (2007 billions of $) (Right axis)
1986 1987 1988 1989 1990 1991 1992 1993 1994 1995 1996 1997 1998 1999 2000 2001 2002 2003 2004 2005 2006
Sources:CapitalIQ, Stro¨mberg (2008), authors’ calculations.
tion of various deal and sponsor characteristics. Figure 1 also uses the CapitalIQ data to report the combined transaction value of U.S. leveraged buyouts backed by a private equity fund sponsor as a fraction of total U.S. stock market value. Stro¨mberg (2008) describes the sampling methodology and discusses potential biases. The most important qualification is that CapitalIQ may underreport private equity transactions before the mid-1990s, particularly smaller transactions.
Overall buyout transaction activity mirrors the patterns in private equity fund-raising. Transaction and fundraising volumes exhibit a similar cyclicality. Transac-tion values peaked in 1988; dropped during the early 1990s, rose and peaked in the later 1990s, dropped in the early 2000s; and increased dramatically from 2004 to 2006. A huge fraction of historic buyout activity has taken place within the last few years. From 2005 through June 2007, CapitalIQ recorded 5,188 buyout transactions at a combined estimated enterprise value of over $1.6 trillion (in 2007 dollars), with those 21⁄2years accounting for 30 percent of the transactions from 1984 to 2007 and 43 percent of the total real transaction value, respectively.
Although Figure 2 only includes deals announced through December 2006 (and closed by November 2007), the number of announced leveraged buyouts continued to increase until June 2007 when a record number of 322 deals were announced. After that, deal activity decreased substantially in the wake of the turmoil in credit markets. In January 2008, only 133 new buyouts were announced. As the private equity market has grown, transaction characteristics also have evolved, as summarized in Table 1; Stro¨mberg (2008) presents a more detailed analysis. The first, late 1980s buyout wave was primarily a U.S., Canadian, and to some extent a U.K., phenomenon. From 1985– 89, these three countries accounted for 89 percent of worldwide leveraged buyout transactions and 93 percent of worldwide transaction value. The leveraged buyout business was dominated by relatively large transactions, in mature industries (such as manufacturing and retail); public-to-private deals accounted for almost half of the value of the trans-actions. These transactions in the first buyout wave helped form the perception of private equity that persisted for many years: leveraged buyouts equal going-private transactions of large firms in mature industries.
Following the fall of the junk bond market in the late 1980s, public-to-private activity declined significantly, dropping to less than 10 percent of transaction value, while the average enterprise value of companies acquired dropped from $401 million to $132 million (both in 2007 dollars). Instead, “middle-market” buyouts of non–publicly traded firms— either independent companies or divisions of larger corporations— grew significantly and accounted for the bulk of private equity activity. Buyout activity spread to new industries such as information technology/ media/telecommunications, financial services, and health care while manufactur-ing and retail firms became less dominant as buyout targets. Although aggregate transaction value fell, twice as many deals were undertaken in 1990 –94 versus 1985– 89.
As private equity activity experienced steady growth over the following period from 1995–2004 (except for a dip in 2000 –2001), the market continued to evolve.
Steven N. Kaplan and Per Stro¨mberg 7
Public company buyouts increased, although buyouts of private companies still accounted for over 80 percent of transaction value and more than 90 percent of transactions. An increasing fraction of buyouts were so-called secondary buyouts— private equity funds exiting their old investments and selling portfolio companies to other private equity firms. By the early 2000 –2004 period, secondary buyouts comprised over 20 percent of total transaction value. The largest sources of deals in this period, however, were large corporations selling off divisions.
Buyouts also spread rapidly to Europe. From 2000 –2004, the western Euro-pean private equity market (including the United Kingdom) had 48.9 percent of worldwide leveraged buyout transaction value, compared with 43.7 percent in the United States. The scope of the industry also continued to broaden, with compa-nies in services and infrastructure becoming increasingly popular buyout targets.
The private equity boom from 2005 to mid-2007 magnified many of these trends. Public-to-private and secondary buyouts grew rapidly in numbers and size, together accounting for more than 60 percent of the $1.6 trillion leveraged buyout transaction value over this time. Buyouts in nonmanufacturing industries contin-ued to grow in relative importance, and private equity activity spread to new parts of the world, particularly Asia (although levels were modest compared to western
Table 1
Global Leveraged Buyout Transaction Characteristics across Time
1985–1989 1990–1994 1995–1999 2000–2004
2005–6/ 30/2007
1970–6/ 30/2007
Combined enterprise value $257,214 $148,614 $553,852 $1,055,070 $1,563,250 $3,616,787
Number of transactions 642 1,123 4,348 5,673 5,188 17,171 LBOs by type: (% of combined enterprise value) Public to private 49% 9% 15% 18% 34% 27% Independent private 31% 54% 44% 19% 14% 23% Divisional 17% 31% 27% 41% 25% 30% Secondary 2% 6% 13% 20% 26% 20% Distressed 0% 1% 1% 2% 1% 1%
LBOs by target location:
(% of combined enterprise value)
United States and Canada 87% 72% 60% 44% 47% 52%
United Kingdom 7% 13% 16% 17% 15% 15%
Western Europe (except UK)
3% 13% 20% 32% 30% 26%
Asia and Australia 3% 1% 2% 4% 6% 4%
Rest of World 0% 2% 2% 3% 3% 3%
Note:The table reports transaction characteristics for 17,171 worldwide leveraged buyout transactions that include every transaction with a financial sponsor in the CapitalIQ database announced between 1/1/1970 and 6/30/2007. Enterprise value is the sum of the sum of equity and net debt used to pay for the transaction in millions of 2007 U.S. dollars. For the transactions where enterprise value was not recorded, these have been imputed using the methodology in Stro¨mberg (2008).
Europe and North America). As large public-to-private transactions returned, average (deflated) deal sizes almost tripled between 2001 and 2006.
Manner and Timing of Exit
Because most private equity funds have a limited contractual lifetime, invest-ment exits are an important aspect of the private equity process. Table 2 presents statistics on private equity investment exits using the CapitalIQ buyout sample. The top panel shows the frequency of various exits. Given that so many leveraged buyouts occurred recently, it is not surprising that 54 percent of the 17,171 sample transactions (going back to 1970) had not yet been exited by November 2007. This raises two important issues. First, any conclusions about the long-run economic impact of leveraged buyouts may be premature. Second, empirical analyses of the performance of leveraged buyouts will likely suffer from selection bias to the extent they only consider realized investments.
Conditional on having exited, the most common route is the sale of the company to a strategic (nonfinancial) buyer; this occurs in 38 percent of exits. The second most common exit is a sale to another private equity fund in a secondary leveraged buyout (24 percent); this route has increased considerably over time. Initial public offerings, where the company is listed on a public stock exchange (and the private equity firm can subsequently sell its shares in the public market), account for 14 percent of exits; this route has decreased significantly in relative importance over time.
Given the high debt levels in these transactions, one might expect a nontrivial fraction of leveraged buyouts to end in bankruptcy. For the total sample, 6 percent of deals have ended in bankruptcy or reorganization. Excluding post-2002 lever-aged buyouts, which may not have had enough time to enter financial distress, the incidence increases to 7 percent. Assuming an average holding period of six years, this works out to an annual default rate of 1.2 percent per year. Perhaps surpris-ingly, this is lower than the average default rate of 1.6 percent that Moody’s reports for all U.S. corporate bond issuers from 1980 –2002 (Hamilton et al., 2006). One caveat is that not all cases of distress may be recorded in publicly available data sources; some of these cases may be “hidden” in the relatively large fraction of “unknown” exits (11 percent). Perhaps consistent with this, Andrade and Kaplan (1998) find that 23 percent of the larger public-to-private transactions of the 1980s defaulted at some point.
The bottom panel of Table 2 shows average holding periods for individual leveraged buyout transactions. The analysis is done on a cohort basis, to avoid the bias resulting from older deals being more likely to have been exited. Over the whole sample, the median holding period is roughly six years, but this has varied over time. Median holding periods were less than five years for deals from the early 1990s, presumably affected by the “hot” initial public offering markets of the late 1990s.
Recently, private equity funds have been accused of becoming more short-term oriented, preferring to “flip” their investments rather than to maintain their
Leveraged Buyouts and Private Equity 9
ownership of companies for a sustained time. In our analysis, we see no evidence that “quick flips,” defined as exits within 24 months of the private equity fund’s investment, have become more common. Instead, holding periods of private equity funds have increased since the 1990s. Overall, only 12 percent of deals are exited within 24 months of the leveraged buyout acquisition date.
Finally, because of the high fraction of secondary buyouts in recent years, the individual holding periods understate the total time in which leveraged buyout firms are held by private equity funds. Accounting for secondary buyouts, Stro¨m-berg (2008) shows that the median leveraged buyout is still in private equity ownership nine years after the original buyout transaction. In comparison, Kaplan (1991), who also takes secondary buyouts into account, found the median lever-aged-buyout target remained in private ownership for 6.82 years, which is consistent with privately owned holding periods having increased since the 1980s.
Is Private Equity a Superior Organizational Form?
Proponents of leveraged buyouts, like Jensen (1989), argue that private equity firms apply financial, governance, and operational engineering to their portfolio
Table 2
Exit Characteristics of Leveraged Buyouts across Time
Year of original LBO
1970– 1984 1985– 1989 1990– 1994 1995– 1999 2000– 2002 2003– 2005 2006– 2007 Whole period Type of exit: Bankruptcy 7% 6% 5% 8% 6% 3% 3% 6% IPO 28% 25% 23% 11% 9% 11% 1% 14%
Sold to strategic buyer 31% 35% 38% 40% 37% 40% 35% 38%
Sold to financial buyer 5% 13% 17% 23% 31% 31% 17% 24%
Sold to LBO-backed firm 2% 3% 3% 5% 6% 7% 19% 5%
Sold to management 1% 1% 1% 2% 2% 1% 1% 1%
Other/unknown 26% 18% 12% 11% 10% 7% 24% 11%
No exit by Nov. 2007 3% 5% 9% 27% 43% 74% 98% 54%
% of deals exited within
24 months (2 years) 14% 12% 14% 13% 9% 13% 12%
60 months (5 years) 47% 40% 53% 41% 40% 42%
72 months (6 years) 53% 48% 63% 49% 49% 51%
84 months (7 years) 61% 58% 70% 56% 55% 58%
120 months (10 years) 70% 75% 82% 73% 76%
Note:The table reports exit information for 17,171 worldwide leveraged buyout transactions that include every transaction with a financial sponsor in the CapitalIQ database announced between 1/1/1970 and 6/30/2007. The numbers are expressed as a percentage of transactions, on an equally-weighted basis. Exit status is determined using various databases, including CapitalIQ, SDC, Worldscope, Amadeus, Cao and Lerner (2007), as well as company and LBO firm web sites. See Stro¨mberg (2008) for a more detailed description of the methodology.
companies, and, in so doing, improve firm operations and create economic value. In contrast, some argue that private equity firms take advantage of tax breaks and superior information, but do not create any operational value. Moreover, critics sometimes argue that private equity activity is influenced by market timing (and market mispricing) between debt and equity markets. In this section, we consider the proponents’ views and the first set of criticisms about whether private equity creates operational value. In the next section, we consider market timing issues in more detail.
Financial, Governance and Operational Engineering
Private equity firms apply three sets of changes to the firms in which they invest, which we categorize as financial, governance, and operational engineering. Jensen (1989) and Kaplan (1989a, b) describe the financial and governance engineering changes associated with private equity. First, private equity firms pay careful attention to management incentives in their portfolio companies. They typically give the management team a large equity upside through stock and options—a practice that was unusual among public firms in the early 1980s (Jensen and Murphy, 1990). Kaplan (1989b) finds that management ownership percent-ages increase by a factor of four in going from public to private ownership. Private equity firms also require management to make a meaningful investment in the company, so that management not only has a significant upside, but a significant downside as well. Moreover, because the companies are private, management’s equity is illiquid—that is, management cannot sell its equity or exercise its options until the value is proved by an exit transaction. This illiquidity reduces manage-ment’s incentive to manipulate short-term performance.
It remains the case that management teams obtain significant equity stakes in portfolio companies. We collected information on 43 leveraged buyouts in the United States from 1996 to 2004 with a median transaction value of over $300 million. Of these, 23 were public-to-private transactions. The median chief execu-tive officer receives 5.4 percent of the equity upside (stock and options) while the management team as a whole gets 16 percent. Acharya and Kehoe (2008) find similar results in the United Kingdom for 59 large buyouts (with a median trans-action value of over $500 million) from 1997 to 2004. They report the median chief executive officer gets 3 percent of the equity; the median management team as a whole gets 15 percent. These magnitudes are similar to those in the 1980s public-to-private transactions studied by Kaplan (1989b). Even though stock- and option-based compensation have become more widely used in public firms since the 1980s, management’s ownership percentages (and upside) remain greater in leveraged buyouts than in public companies.
The second key ingredient is leverage—the borrowing that is done in connec-tion with the transacconnec-tion. Leverage creates pressure on managers not to waste money, because they must make interest and principal payments. This pressure reduces the “free cash flow” problems described in Jensen (1986), in which management teams in mature industries with weak corporate governance could
dissipate cash flows rather than returning them to investors.2In the United States and many other countries, leverage also potentially increases firm value through the tax deductibility of interest. On the flip side, if leverage is too high, the inflexibility of the required payments (as contrasted with the flexibility of payments to equity) increases the chance of costly financial distress.
Third, governance engineering refers to the way that private equity investors control the boards of their portfolio companies and are more actively involved in governance than public company boards. Private equity portfolio company boards are smaller than comparable public company boards and meet more frequently (Gertner and Kaplan, 1996; Acharya and Kehoe, 2008; Cornelli and Karakas, 2008).3 Acharya and Kehoe (2008) report that portfolio companies have twelve formal meetings per year and many more informal contacts. In addition, private equity investors do not hesitate to replace poorly performing management. Acharya and Kehoe (2008) report that one-third of chief executive officers of these firms are replaced in the first 100 days while two-thirds are replaced at some point over a four-year period.
Financial and governance engineering were common by the late 1980s. Today, most large private equity firms have added another type that we call “operational engineering,” which refers to industry and operating expertise that they apply to add value to their investments. Indeed, most top private equity firms are now organized around industries. In addition to hiring dealmakers with financial engi-neering skills, private equity firms now often hire professionals with operating backgrounds and an industry focus. For example, Lou Gerstner, the former chief executive officer of RJR and IBM is affiliated with Carlyle, while Jack Welch, the former chief executive officer of GE, is affiliated with Clayton Dubilier. Most top private equity firms also make use of internal or external consulting groups.
Private equity firms use their industry and operating knowledge to identify attractive investments, to develop value creation plans for those investments, and to implement the value creation plans. A plan might include elements of cost-cutting opportunities and productivity improvements, strategic changes or repositioning, acquisition opportunities, as well as management changes and upgrades (Acharya and Kehoe, 2008; Gadiesh and MacArthur, 2008).
Operating Performance
The empirical evidence on the operating performance of companies after they have been purchased through a leveraged buyout is largely positive. For U.S. public-to-private deals in the 1980s, Kaplan (1989b) finds that the ratio of operating income to sales increased by 10 to 20 percent (absolutely and relative to industry).
2Axelson, Stro¨mberg, and Weisbach (forthcoming) also argue that leverage provides discipline to the
acquiring leveraged buyout fund, which must persuade third-party investors—the debt providers—to co-invest in each deal.
3
Empirical evidence on public firm boards (Yermack, 1996) suggests that smaller boards are more efficient.
Fn2
The ratio of cash flow (operating income less capital expenditures) to sales in-creased by roughly 40 percent. The ratio of capital expenditures to sales declined. These changes are coincident with large increases in firm value (again, absolutely and relative to industry). Smith (1990) finds similar results. Lichtenberg and Siegel (1990) find that leveraged buyouts experience significant increases in total factor productivity after the buyout.
Most post-1980s empirical work on private equity and leverage buyouts has focused on buyouts in Europe, largely because of data availability. Consistent with the U.S. results from the 1980s, most of this work finds that leveraged buyouts are associated with significant operating and productivity improvements. This work includes Harris, Siegel, and Wright (2005) for the United Kingdom; Boucly, Sraer, and Thesmar (2008) for France; and Bergstro¨m, Grubb, and Jonsson (2007) for Sweden. Cumming, Siegel, and Wright (2007) summarize much of this literature and conclude there “is a general consensus across different methodologies, mea-sures, and time periods regarding a key stylized fact: LBOs [leveraged buyouts] and especially MBOs [management buyouts] enhance performance and have a salient effect on work practices.”
There has been one exception to the largely uniform positive operating results—more recent to-private buyouts. Guo et al. (2007) study U.S. public-to-private transactions completed from 1990 to 2006. The 94 leveraged buyouts with available post-buyout data are concentrated in deals completed by 2000. The authors find modest increases in operating and cash flow margins that are much smaller than those found in the 1980s data for the United States and in the European data. At the same time, they find high investor returns (adjusted for industry or the overall stock market) at the portfolio company level. Acharya and Kehoe (2008) and Weir, Jones, and Wright (2007) find similarly modest operating improvements for public-to-private deals in the United Kingdom over roughly the same period. Nevertheless, Acharya and Kehoe (2008) also find high investor returns. These results suggest that post-1980s public-to-private transactions may differ from those of the 1980s and from leveraged buyouts overall.
While the empirical evidence is consistent overall with significant operating improvements for leverage buyouts, it should be interpreted with some caution.
First, some studies, particularly those in the United States, are potentially subject to selection bias because performance data for private firms are not always available. For example, most U.S. studies of financial performance study leveraged buyouts that use public debt or subsequently go public, and leveraged buyouts of public companies. These may not be representative of the population. Still, studies undertaken in countries where accounting data is available on private firms, which therefore do not suffer reporting biases—for example, Boucly, Sraer, and Thesmar (2008) for France and Bergstro¨m, Grubb, and Jonsson (2007) for Sweden—find significant operating improvements after leveraged buyouts.
Second, the decline in capital expenditures found in some studies raises the possibility that leveraged buyouts may increase current cash flows, but hurt future cash flows. One test of this concern is to look at the performance of leveraged
buyout companies after they have gone through an initial public offering. In a recent paper, Cao and Lerner (2007) find positive industry-adjusted stock perfor-mance after such initial public offerings. In another test of whether future pros-pects are sacrificed to current cash flow, Lerner, Sorensen, and Stro¨mberg (2008) study post-buyout changes in innovation as measured by patenting. Although relatively few private equity portfolio companies engage in patenting, those that patent do not experience any meaningful decline in post-buyout innovation or patenting. Furthermore, patents filed post-buyout appear more economically im-portant (as measured by subsequent citations) than those filed pre-buyout, as firms focus their innovation activities in a few core areas.
Overall, we interpret the empirical evidence as largely consistent with the existence of operating and productivity improvements after leveraged buyouts. Most of these results are based on leveraged buyouts completed before the latest private equity wave. Accordingly, the performance of leveraged buyouts com-pleted in the latest private equity wave is clearly a desirable topic for future research.
Employment
Critics of leveraged buyouts often argue that these transactions benefit private equity investors at the expense of employees who suffer job and wage cuts. While such reductions would be consistent (and arguably expected) with productivity and operating improvements, the political implications of economic gains achieved in this manner would be more negative (for example, see comments from the Service Employees International Union, 2007).
Kaplan (1989b) studies U.S. public-to-private buyouts in the 1980s and finds that employment increases post-buyout, but by less than other firms in the industry. Lichtenberg and Siegel (1990) obtain a similar result. Davis, Haltiwanger, Jarmin, Lerner, and Miranda (2008) study a large sample of U.S. leveraged buyouts from 1980 to 2005 at the establishment level. They find that employment at leveraged buyout firms increases by less than at other firms in the same industry after the buyout, but also find that leveraged buyout firms had smaller employment growth before the buyout transaction. The relative employment declines are concentrated in retail businesses. They find no difference in employment in the manufacturing sector. For a subset of their sample, Davis et al. (2008) are able to measure employment at new establishments as well as at existing ones. For this subsample, the leveraged buyout companies have higher job growth in new establishments than similar non-buyout firms.
Outside the United States, Amess, and Wright (2007a) study buyouts in the United Kingdom from 1999 to 2004 and find that firms that experience leveraged buyouts have employment growth similar to other firms, but increase wages more slowly. The one exception to the findings in the United States and United Kingdom are those for France by Boucly, Sraer, and Thesmar (2008), who find that leveraged buyout companies experience greater job and wage growth than other similar companies.
Overall, then, the evidence suggests that employment grows at firms that experience leveraged buyouts, but at a slower rate than at other similar firms. These findings are not consistent with concerns over job destruction, but neither are they consistent with the opposite position that firms owned by private industry experi-ence especially strong employment growth (except, perhaps, in France). We view the empirical evidence on employment as largely consistent with a view that private equity portfolio companies create economic value by operating more efficiently.
Taxes
The additional debt in leveraged buyout transactions gives rise to interest tax deductions that are valuable, but difficult to value accurately. Kaplan (1989a) finds that, depending on the assumption, the reduced taxes from higher interest deduc-tions can explain from 4 percent to 40 percent of a firm’s value. The lower estimates assume that leveraged buyout debt is repaid in eight years and that personal taxes offset the benefit of corporate tax deductions. The higher estimates assume that leveraged buyout debt is permanent and that personal taxes provide no offset. Assuming that the truth lies between these various assumptions, a reasonable estimate of the value of lower taxes due to increased leverage for the 1980s might be 10 to 20 percent of firm value. These estimates would be lower for leveraged buyouts in the 1990s and 2000s, because both the corporate tax rate and the extent of leverage used in these deals have declined. Thus, while greater leverage creates some value for private equity investors by reducing taxes, it is difficult to say exactly how much.
Asymmetric Information
The generally favorable results on operating improvements and value creation are also potentially consistent with private equity investors having superior infor-mation on future portfolio company performance. Critics of private equity often claim that incumbent management is a source of this inside information. To some extent, supporters of private equity implicitly agree that incumbent management has information on how to make a firm perform better. After all, one of the justifications for private equity deals is that with better incentives and closer monitoring, managers will use their knowledge to deliver better results. A less attractive claim, however, is that incumbent managers favor a private equity buyout because they intend to keep their jobs and receive lucrative compensation under the new owners. As a result, incumbent managers may be unwilling to fight for the highest price for existing shareholders—thus giving private equity investors a better deal.
Several observations suggest that it is unlikely that operating improvements are simply a result of private equity firms taking advantage of private information. First, Kaplan (1989b) studies the forecasts the private equity firms released publicly at the time of the leveraged buyout. The asymmetric information story suggests that actual performance should exceed the forecasts. In fact, actual performance after the buyout lags the forecasts. Moreover, Ofek (1994) studies leveraged buyout attempts
that failed because the offer was rejected by the board or by stockholders (even though management supported it) and finds no excess stock returns or operating improvements for these firms. It would be useful to replicate these studies with more recent transactions.
Second, private equity firms frequently bring in new management. As men-tioned earlier, Acharya and Kehoe (2008) report that one-third of the chief executive officers in their sample are replaced in the first 100 days and two-thirds are replaced over a four-year period. Thus, incumbent management cannot be sure that it will be in a position to receive high-powered incentives from the new private equity owners.
Third, it seems likely that at times in the boom-and-bust cycle, private equity firms have overpaid in their leveraged buyouts and experienced losses. For exam-ple, the late 1980s was one such time, and it seems likely that the tail end of the private equity boom in 2006 and into early 2007 will generate lower returns than investors expected as well. If incumbent management provided inside information, it clearly wasn’t enough to avoid periods of poor returns for private equity funds. While these findings are inconsistent with operating improvements being the result of asymmetric information, there is some evidence that private equity funds are able to acquire firms more cheaply than other bidders. Guo et al. (2007) and Acharya and Kehoe (2008) find that post-1980s public-to-private transactions ex-perience only modest increases in firm operating performance, but still generate large financial returns to private equity funds. This finding suggests that private equity firms are able to buy low and sell high. Similarly, Bargeron, Schlingemann, Stulz, and Zutter (2007) find that private equity firms pay lower premiums than public company buyers in cash acquisitions. These findings are consistent with private equity firms identifying companies or industries that turn out to be under-valued. Alternatively, this could indicate that private equity firms are particularly good negotiators, and/or that target boards and management do not get the best possible price in these acquisitions.
Overall, then, the evidence does not support an important role for superior firm-specific information on the part of private equity investors and incumbent management. The results are potentially consistent with private equity investors bargaining well, target boards bargaining badly, or private equity investors taking advantage of market timing (and market mispricing), which we discuss below.
Private Equity Fund Returns
The company-level empirical evidence suggests that leveraged buyouts by private equity firms create value (adjusted for industry and market). This evidence does not necessarily imply, however, that private equity funds earn superior returns for their limited partner investors. First, because private equity firms often purchase firms in competitive auctions or by paying a premium to public shareholders, sellers likely capture a meaningful amount of value. For example, in KKR’s purchase of
RJR Nabisco, KKR paid a premium to public shareholders of roughly $10 billion. After the buyout, KKR’s investors earned a low return, suggesting that KKR paid out most, if not all of the value-added to RJR’s public shareholders. Second, the limited partner investors in private equity funds pay meaningful fees. Metrick and Yasuda (2007) estimate that fees equal $19 in present value per $100 of capital under management for the median private equity fund. As a result, the return to outside investors net of fees will be lower than the return on the private equity fund’s underlying investments.
Kaplan and Schoar (2005) study the returns to private equity and venture capital funds. They compare how much an investor (or limited partner) in a private equity fund earned net of fees to what the investor would have earned in an equivalent investment in the Standard and Poor’s 500 index. They find that private equity fund investors earn slightly less than the Standard and Poor’s 500 index net of fees, ending with an average ratio of 93 percent to 97 percent. On average, therefore, they do not find the outperformance often given as a justification for investing in private equity funds. At the same time, however, these results imply that the private equity investors outperform the Standard and Poor’s 500 index gross of fees (that is, when fees are added back). Those returns, therefore, are consistent with private equity investors adding value (over and above the premium paid to selling shareholders).
At least two caveats are in order. First, Kaplan and Schoar (2005) use data from
Venture Economicswhich samples only roughly half of private equity funds, leaving an unknown and potentially important selection bias. Second, because of data avail-ability issues, Kaplan and Schoar compare performance to the Standard and Poor’s 500 index without making any adjustments for risk.
Kaplan and Schoar (2005) also find strong evidence of persistence in mance—that is, performance by a private equity firm in one fund predicts perfor-mance by the firm in subsequent funds. In fact, their results likely understate persistence because the worst-performing funds are less likely to raise a subsequent fund. In contrast, mutual funds show little persistence and hedge funds show uncertain persistence. This persistence result explains why limited partners often strive to invest in private equity funds that have been among the top performers in the past (Swensen, 2000). Of course, only some limited partners can succeed in such a strategy.
Phalippou and Gottschalg (forthcoming) use a slightly updated version of the Kaplan and Schoar (2005) data set. They obtain qualitatively identical results to Kaplan and Schoar (2005) for the average returns and persistence of private equity/buyout funds relevant here.
Boom and Bust Cycles in Private Equity
Portfolio Company Level
The pattern of private equity commitments and transactions over recent decades suggests that credit market conditions may affect this activity. One
esis is that private equity investors take advantage of systematic mispricings in the debt and equity markets. That is, when the cost of debt is relatively low compared to the cost of equity, private equity can arbitrage or benefit from the difference. This argument relies on the existence of market frictions that enable debt and equity markets to become segmented. Baker and Wurgler (2000) and Baker, Greenwood, and Wurgler (2003) offer arguments that public companies take advantage of market mispricing.
To see how debt mispricing might matter, assume that a public company is unleveraged and being run optimally. If a private equity firm can borrow at a rate that is too low given the risk, the private equity firm will create value by borrowing. In the recent wave, interest rate spreads for private equity borrowing increased from roughly 250 basis points over the benchmark LIBOR (London Interbank Offered Rate) in 2006 to 500 basis points over LIBOR in 2008 (Standard and Poor’s, 2008). Under the assumptions that debt funds 70 percent of the purchase price and has a maturity of eight years, debt mispricing of 250 basis points would justify roughly 10 percent of the purchase price or, equivalently, would allow a private equity fund investor to pay an additional 10 percent (that is, the present value of an eight-year loan for 70 discounted at the higher interest rate is 60, not 70).
The mispricing theory implies that relatively more deals will be undertaken when debt markets are unusually favorable. Kaplan and Stein (1993) present evidence consistent with a role for overly favorable terms from high-yield bond investors in the 1980s buyout wave. The credit market turmoil in late 2007 and early 2008 suggests that overly favorable terms from debt investors may have helped fuel the buyout wave from 2005 through mid-2007.
To study buyout market cyclicality, we make more detailed “apples-to-apples” comparisons of buyout characteristics over time by combining the results in Kaplan and Stein (1993) for the 1980s buyout wave with those in Guo et al. (2007) for the last ten years. Both papers study public-to-private transactions in the United States. First, we look at valuations or prices relative to cash flow. To measure the price paid for these deals, we calculate enterprise value as the sum of the value of equity and net debt at the time of the buyout. Firm cash flow is calculated using the standard measure of firm-level performance, EBITDA, which stands for earnings before interest, taxes, depreciation, and amortization. Figure 3 reports the median ratio of enterprise value to cash flow for leveraged buyouts by year. The figure shows that prices paid for cash flow were generally higher at the end of the buyout waves than at the beginning. (The first private equity wave began in 1982 or 1983 and ended in 1989; the second began in 2003 or 2004 and ended in 2007.) The more recent period, in particular, exhibits a great deal of cyclicality, first dipping substantially from 2000 through 2002, and then rising afterwards.
Figure 3 also shows that valuation multiples in the recent wave exceeded those in the 1980s wave, although this conclusion is open to some interpretation. In general, ratios of all corporate values to cash flow were higher in the last decade than in the 1980s. When the ratios in Figure 3 are deflated by the median ratio for
nonfinancial companies in the Standard and Poor’s 500 index, the valuations of leveraged buyout deals relative to the Standard and Poor’s 500 are slightly lower in the recent wave relative to the previous wave. Even after such a calculation, the cyclicality of the recent wave remains.
Next, we look at changes in leverage buyout firm capital structures. We compare the ratio of equity used to finance leveraged buyouts in each time period and find that the share of equity used to finance leveraged buyouts was relatively constant in the first wave at 10 percent to 15 percent and relatively constant in the second wave, but at roughly 30 percent. This striking increase in equity percentage from one era to the other is both a prediction of and consistent with the arguments in Kaplan and Stein (1993) that debt investors offered overly favorable terms, particularly too much leverage, in the buyout wave of the 1980s.
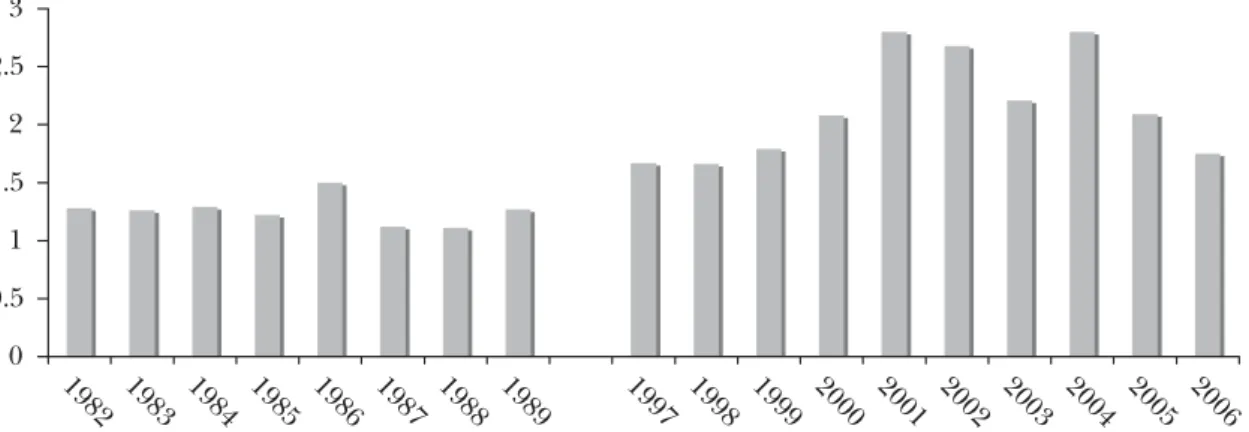
Valuations relative to a standardized measure of profits—EBITDA (earnings before interest, taxes, depreciation and amortization)—were higher in the recent wave, but debt levels were lower. Interest rates also changed. Figure 4 combines these factors by measuring the ratio of EBITDA to forecast interest for the lever-aged buyouts of the two eras. This interest coverage ratio is a measure of the fragility of a buyout transaction. When this ratio is lower, it implies that the buyout is more fragile, because the firm has less of a cushion from not being able to meet interest payments. Figure 4 has two interesting implications. First, interest coverage ratios are higher in the recent wave, suggesting the deals are less fragile. Second,
Figure 3
Enterprise Value to EBITDA in Large U.S. Public-to-Private Buyouts, 1982 to 2006
(“EBITDA,” a measure of cash flow, stands for earnings before interest, taxes, depreciation, and amortization) 0.00 2.00 4.00 6.00 8.00 10.00 12.00 1982 1983 1984 1985 1986 1987 1988 1989 19 97 1998 1999 2000 2001 2002 2003 2004 2005 2006
Source:Kaplan and Sein (1993) and Guo, Hotchkiss, and Song (2007).
Note:The first private equity wave began in 1982 or 1983 and ended in 1989; the second began in 2003 or 2004 and ended in 2007.
Steven N. Kaplan and Per Stro¨mberg 19
the cyclical pattern of the second wave remains. Coverage ratios are higher from 2001 to 2004 than in the periods before and after.
Leveraged buyouts of the most recent wave also have been associated with more liberal repayment schedules and looser debt covenants. Consistent with this, we find patterns similar to (if not stronger than) those in Figure 4 when we factor in debt principal repayments. Demoriglu and James (2007) and Standard and Poor’s (2008) also confirm that loan covenants became less restrictive at the end of the recent wave.
Figure 5 considers cyclicality in private equity in one additional way. It com-pares the median ratio of EBITDA to enterprise value for the Standard & Poor’s 500, to the average interest rate on high-yield bonds—the Merrill Lynch High Yield (cash pay bonds)— each year from 1985 to 2006. In particular Figure 5 looks at operating earnings yield net of interest rate. This measures the relation between the cash flow generated per dollar of market value by the median company in the Standard & Poor’s 500 and the interest rate on a highly leveraged financing. One can interpret this measure as the excess (or deficit) from financing the purchase of an entire company with high-yield bonds.
The pattern is suggestive. A necessary (but not sufficient) condition for a private equity boom to occur is for earnings yields to exceed interest rates on high-yield bonds. This pattern held true in the late-1980s boom and in the boom of 2005 and 2006. When operating earnings yields are less than interest rates from high-yield bonds, private equity activity tends to be lower.
These patterns suggest that the debt used in a given leveraged buyout may be driven more by credit market conditions than by the relative benefits of leverage for the firm. Axelson, Jenkinson, Stro¨mberg, and Weisbach (2008) find evidence
Figure 4
EBITDA to Interest in Large U.S. Public to Private Buyouts, 1982 to 2006
(“EBITDA,” a measure of cash flow, stands for earnings before interest, taxes, depreciation, and amortization) 0 0.5 1 1.5 2 2.5 3 1982 1983 1984 1985 1986 1987 1988 1989 1997 1998 1999 2000 2001 2002 2003 2004 2005 2006
Source:Kaplan and Stein (1993) and Guo, Hotchkiss, and Song (2007).
Note:The first private equity wave began in 1982 or 1983 and ended in 1989. The second private equity wave began in 2003 or 2004 and ended in 2007.
consistent with this in a sample of large leveraged buyouts in the United States and Europe completed between 1985–2007. They find that leverage is cross-sectionally unrelated to leverage in similar-size, same industry, public firms and is unrelated to firm-specific factors that explain leverage in public firms. In-stead, leveraged buyout capital structures are most strongly related to prevailing debt market conditions at the time of the buyout. Leverage in leveraged buyouts decreases as interest rates rise. The amount of leverage available, in turn, seems to affect the amount that the private equity fund pays to acquire the firm. Similarly, Ljungqvist, Richardson, and Wofenzon (2007) find that private equity funds accelerate their investment pace when interest rates are low. These results are consistent with the notion that debt financing availability affects booms and busts in the private equity market.
These patterns raise the question as to why the borrowing of public firms does not follow the same credit market cycles. One potential explanation is that public firms are unwilling to take advantage of debt mispricing by increasing leverage, either because managers dislike debt or because public market investors worry about high debt levels. A second explanation is that private equity funds have better access to credit markets because they are repeat borrowers, which enables them to build reputation with lenders. Recent papers by Ivashina and Kovner (2008) and Demiroglu and James (2007) suggest that more prominent private equity funds are able to obtain cheaper loans and looser debt covenants than other lenders. A third explanation is that the compensation structures of private equity funds provide incentives to take on more debt than is optimal for the individual firm (Axelson, Jenkinson, Stro¨mberg, and Weisbach, forthcoming).
Figure 5
Standard & Poor’s EBITDA/Enterprise Value Less High-Yield Rates, 1985–2006
(“EBITDA,” a measure of cash flow, stands for earnings before interest, taxes, depreciation, and amortization) -4.00% -3.00% -2.00% -1.00% 0.00% 1.00% 2.00% 3.00% 4.00% 1985 1991 1994 1997 2000 2003 2006 Year 1988
Note:Median EBITDA/Enterprise Value for S&P 500 companies less Merrill Lynch High-Yield Master (Cash Pay Only) Yield. Enterprise Value is the sum of market value of equity, book value of long-and short-term debt less cash long-and marketable securities.
Private Equity Fund Level
The time series of private equity fund commitments examined earlier appear to exhibit a boom and bust pattern. In this section, we consider this more closely by studying the relation between commitments and returns.
First, we consider the relation between private equity fundraising and subse-quent private equity fund returns. Table 3 presents illustrative regressions in which the dependent variable is the capital-weighted return to all private equity funds raised in a particular year. We refer to this as the “vintage year return.” We use the vintage year returns for U.S. private equity funds from Venture Economics as of September 2007 for vintage years 1984 to 2004. The return measures are noisy because Venture Economics does not have returns for all private equity funds. In addition, the funds that comprise the more recent vintage years are still active and their returns may change over time. (This factor is probably unimportant because we obtain similar results when we eliminate all vintages after 1999.) As independent variables, we use capital committed to private equity funds in the vintage year and the previous vintage year relative to the total value of the U.S. stock market. Regressions 1 to 4 in Table 3 indicate a strong negative relation between fundrais-ing and subsequent vintage year returns. Includfundrais-ing a time trend does not affect the results. While this simple regression finding can only be considered illustrative of broader patterns, it suggests that inflows of capital into private equity funds in a given year can explain realized fund returns during the subsequent ten- to twelve-year period when these funds are active. It strongly suggests that an influx of capital into private equity is associated with lower subsequent returns.
Next we consider the extent to which past returns affect capital commitments. In these regressions, the dependent variable is the annual capital committed to U.S. private equity funds as a fraction of the U.S. stock market from 1987 to 2006. The independent variables are the two previous year’s returns to private equity, again, as reported by Venture Economics. Note that the annual return to private equity is different from the vintage year return (which was the dependent variable in the previous regressions). The vintage year return measures the annual return to all funds raised in a particular year over the life of the fund—that is, the vintage year return is a geometric average of many years of returns. In contrast, the annual return to private equity is the return to all private equity funds of different vintages in a given calendar year.
Again, these regressions are meant only to be suggestive. In these two regres-sions in panel B, capital commitments are positively and significantly related to lagged private equity returns—in other words, investors seem to follow good returns. The positive trend is consistent with significant secular growth in private equity fund commitments over time above any cyclical factors.
To summarize the regressions, private equity fund returns tend to decline when more capital is committed to this asset class. Capital commitments to private equity tend to decline when realized returns decline. These patterns are consistent with a boom and bust cycle in private equity.
Some Speculations
The empirical evidence is strong that private equity activity creates economic value on average. We suspect that the increased investment by private equity firms in operational engineering will ensure that this result continues to hold in the
Table 3
Relation of Private Equity Returns and Fundraising in United States Panel A
Dependent variable: Vintage year average internal rate of return to private equity (capital weighted) from 1984 to 2004
(1) (2) (3) (4)
Constant 0.31 0.31 0.35 0.35
(6.2) (7.0) (7.5) (7.2)
Private equity commitments to stock market, t
⫺32.60** ⫺20.79*
(⫺2.4) (⫺1.6)
Private equity commitments to stock market, t-1
⫺36.87*** ⫺28.66**
(⫺3.0) (⫺2.2)
Private equity commitments to
stock market, t⫹t-1 ⫺24.78*** (⫺3.5) Trend ⫺0.004 ⫺0.003 ⫺0.002 ⫺0.002 (⫺1.2) (⫺1.0) (⫺0.8) (⫺0.8) Adj.R2 0.28 0.36 0.44 0.41 Panel B
Dependent variable: Private equity commitments to Stock Market, t from 1984 to 2007 (as a fraction of the total value of the U.S. stock market)
(1) (2)
Constant ⫺0.091 ⫺0.292
(⫺0.7) (⫺1.8)
Annual private equity return, t-1 0.007** 0.008***
(2.1) (2.6)
Annual private equity return, t-2 0.007**
(2.4)
Trend 0.031*** 0.031***
(4.1) (4.6)
Adj.R2 0.40 0.50
Note: Private equity vintage year internal rate of return is the average internal rate of return to U.S.
private equity funds raised in a given year, according toVenture Economics. Mean vintage year internal rate
of return is 16.5 percent. Private equity commitments are capital committed to U.S. private equity funds fromPrivate Equity Analystas a fraction of the total value of the U.S. stock market. Mean private equity commitments are 0.43 percent. Private equity annual return is the annual return to all U.S. private
equity funds according toVenture Economics. Mean annual return is 18.6 percent. Standard errors are in
parentheses.
*, **, and *** indicate statistical significance at the 10, 5, and 1 percent levels, respectively.
future. Because private equity creates economic value, we believe that private equity activity has a substantial permanent component.
However, the evidence also is strong that private equity activity is subject to boom and bust cycles, which are driven by recent returns as well as by the level of interest rates relative to earnings and stock market values. This pattern seems particularly true for larger public-to-private transactions.
From the summer of 2007 into mid-2008, interest rates on buyout-related debt increased substantially—when buyout debt is even available at all. At the same time, corporate earnings have softened. In this setting, private equity activity is likely to be relatively low, particularly large public-to-private buyouts. Institutional investors are likely to continue to make commitments to private equity for a time, at least, because reported private returns have not declined, but are still robust. As of September 2007, Venture Economicsreports private equity returns over the previous three years of 15.3 percent versus Standard and Poor’s 500 stock market returns of 12.7 percent.
The likelihood that investors’ commitments to private equity funds remain robust while debt markets remain unfavorable will create pressure for private firms to invest the capital committed. Given the fee structure of private equity funds, we do not expect that many private equity firms will return the money. However, these patterns suggest that the structure of private equity deals will evolve.
First, we suspect that private equity firms will make investments with less leverage, at least initially. While this change may reduce the magnitude of expected returns (and compensation), as long as the private equity firms add value, it will not change risk-adjusted returns.
Second, we suspect that private equity firms will be more likely to take minority equity positions in public or private companies rather than buying the entire company. Private equity firms have experience with minority equity investments, both in venture capital investments and in overseas investments, particularly in Asia. The relatively new operational engineering capabilities of private equity firms may put them in a better position to supply minority investments than in the past, because private equity firms can provide additional value without having full control. Moreover, top executives and boards of public companies may have an increased demand for minority equity investments. Shareholder and hedge fund activism and hostility have increased substantially in recent years (Brav, Jiang, Partnoy, and Thomas et al., forthcoming). In the face of that hostility, private equity firms are likely to be perceived as partners or “white knights” by some chief executive officers and boards.
Finally, what will happen to funds and transactions completed in the recent private equity boom of 2005 to mid-2007? It seems plausible that the ultimate returns to private equity funds raised during these years will prove disappointing because firms are unlikely to be able to exit the deals from this period at valuations as high as the private equity firms paid to buy the firms. It is also plausible that some of the transactions undertaken during the boom were less driven by the potential of operating and governance improvements, and more driven by the availability of