returns
Finance Master's thesis Petri Lehtonen 2015 Department of Finance Aalto University School of Business Powered by TCPDF (www.tcpdf.org)
Directors’ and officers’ liability insurance and
acquirer returns
Finance Master’s Thesis Petri Lehtonen 2015 Department of Finance Aalto University School of BusinessAbstract of master’s thesis
Author Petri Lehtonen
Title of thesis Directors’ and officers’ liability insurance and acquirer returns Degree Master of Science in Business Administration
Degree programme Finance
Thesis advisor(s) Professor Matti Suominen
Year of approval 2015 Number of pages 70 Language English OBJECTIVES OF THE STUDY
In this thesis, I study the impact of directors’ & officers’ liability insurance (D&O insurance) on acquirer abnormal announcement returns. My first objective is to replicate results in the prior literature of the relation between D&O insurance coverage and acquirer returns using firms listed only in Canada. I then study the possible effect of cross-listing in the US to the results. The second objective of my research is to study whether D&O insurance premium can be used as a proxy for corporate governance quality and to compare its explanatory power of acquirer returns to two corporate governance indexes, The Globe and Mail Governance Index and Board Shareholder Confidence Index.
DATA AND METHODOLOGY
My sample consists of 2,238 completed acquisitions between 2003 and 2013. Firms listed only in Canada made 1,602 of these acquisitions and firms cross-listed in the US made 636 of them. D&O insurance and corporate governance indexes data are unique as they are hand-collected. My analysis is based on univariate and multivariate regression models (ordinary least regression, OLS). In the regressions I use 5-day cumulative abnormal announcement return as dependent variable, and D&O insurance variables and two corporate governance indexes as explanatory variables. I control for deal and acquirer characteristics, deal types, and year and industry fixed-effects.
FINDINGS OF THE STUDY
First, I find significant negative relation between D&O insurance coverage and cumulative acquirer announcement returns with sample firms listed only in Canada. The negative relation is in line with the prior literature. However, acquirer returns become positive when a firm is cross-listed in the US, indicating that higher D&O insurance protection can be beneficial for shareholders of firms operating in the US market. Thus, my results suggest that the effect of D&O insurance variables on acquirer returns varies in different markets. Second, I find significant negative relation between D&O insurance premium and acquirer returns, indicating that insurance companies can price the risk related to corporate governance structures. Furthermore, I do not find significant relation between the two corporate governance indexes and acquirer returns, which supports the idea that D&O insurance premium includes valuable information not otherwise available in the market.
Keywords acquisition, D&O insurance, insurance coverage, insurance premium, corporate governance index, cumulative abnormal announcement return, cross-listing
Pro gradu –tutkielman tiivistelmä
Tekijä Petri Lehtonen
Otsikko Yrityksen hallintoelinten vastuuvakuutus ja yrityskauppojen tuotot Tutkinto Kauppatieteiden maisteri
Ohjelma Rahoitus
Ohjaaja Professori Matti Suominen
Hyväksytty 2015 Sivumäärä 70 Kieli Englanti
TUTKIELMAN TAVOITTEET
Tutkin pro gradu -tutkielmassani yrityksen hallintoelinten vastuuvakuutuksen vaikutusta yrityskauppojen ympärillä esiintyviin kumulatiivisiin epänormaaleihin osaketuottoihin. Tutkimukseni ensimmäinen tavoite on toistaa aiemmin saavutetut tulokset vastuuvakuutuksen vakuutusmäärän ja yrityskauppojen tuottojen välillä käyttäen kanadalaisia yrityksiä. Sen jälkeen selvitän, vaikuttaako yrityksen listautuminen yhdysvaltalaiseen osakepörssiin tuloksiin. Tutkimukseni toinen tavoite on kokeilla voiko yrityksen maksamaa hallintoelinten vastuuvakuutuksen hintaa käyttää mittarina yhtiön hallinnoinnin laadukkuudelle ja verrata sen selitysvoimaa yrityskauppojen tuotoille kahteen hallinnoinnin laadukkuutta mittaavaan indeksiin. DATA JA METODOLOGIA
Otokseni koostuu 2.238 yrityskaupasta, jotka on tehty vuosien 2003 ja 2013 välillä. Näistä kaupoista 1.602 kappaletta on ainoastaan Kanadassa listattujen yritysten tekemiä ja 636 kauppaa sellaisten yritysten tekemiä, jotka on listattu pörssiin myös Yhdysvalloissa. Sekä vakuutus- että hallinnointi-indeksidata on käsin kerättyä ja siksi ainutlaatuista. Analyysini perustuu yhden ja usean muuttujan regressioon (pienimmän neliösumman menetelmä, PNS). Regressioissa selitettävinä muuttujina ovat yrityskaupan julkaisun ympärille lasketut viiden päivän epänormaalit kumulatiiviset osaketuotot sekä yrityskaupan preemio. Selittävinä muuttujina ovat vakuutuksen esiintyminen, vakuutusmäärä ja -preemio sekä kaksi hallinnointi-indeksiä. Kontrolleina ovat kauppa- ja yrityskohtaisia muuttujia sekä kiinteinä vaikutuksina kaupantekovuosi ja yrityksen toimiala.
TULOKSET
Vain Kanadassa listatut yritykset kokevat negatiivisia osaketuottoja yrityskaupan ympärillä, kun niiden hallintoelinten vastuuvakuutusmäärä kasvaa. Tulos on linjassa aiemmin aiheesta tehtyjen tutkimusten kanssa. Toisaalta yritykset, jotka ovat listattu pörssiin myös Yhdysvalloissa, kokevat positiivisia tuottoja niiden vastuuvakuutusmäärän kasvaessa. Lisäksi vastuuvakuutuksen hinta korreloi negatiivisesti osaketuottojen kanssa, mutta vertailuindeksien ja tuottojen välistä korrelaatiota ei ole. Tämä viittaa siihen, että vakuutusyhtiöt kykenevät hinnoittelemaan hallinnointirakenteiden riskit siten, että hinta sisältää ainutlaatuista tietoa yrityksen hallinnointirakenteista, jota ei muuten ole markkinoilla saatavilla.
Avainsanat yrityskauppa, hallintoelinten vastuuvakuutus, vakuutusmäärä, vakuutuspreemio, hallinnointi-indeksi, kumulatiivinen epänormaali osaketuotto, ristiinlistautuminen
TABLE OF CONTENTS
1. Introduction ... 1
1.1 Contribution to existing research ... 2
1.2 Key research questions ... 3
1.3 Findings of the study ... 3
1.4 Limitations of the study ... 4
1.5 Structure of the study ... 5
2. Literature review ... 6
2.1 D&O insurance in general ... 6
2.2 Reasons why firms purchase D&O insurance ... 7
2.3 Main findings in prior literature on D&O insurance ... 8
2.4 Cross-listing in the US ... 10
2.5 Theoretical framework of corporate governance ... 10
2.6 Benchmark for D&O insurance premium: Governance indexes... 11
3. Hypotheses ... 14
3.1 D&O insurance coverage ... 14
3.2 D&O insurance premium ... 15
4. Data and sample selection ... 16
5. Methods and variables ... 18
5.1 Structure of the analysis ... 18
5.2 Variable construction ... 19
5.2.1 Acquirer return ... 19
5.2.2 Acquisition premiums ... 21
5.2.3 D&O insurance coverage ... 21
5.2.4 D&O insurance premium ... 22
5.2.5 Globe and Mail Governance Index ... 22
5.2.6 Board Shareholder Confidence Index ... 23
5.2.7 Deal characteristics ... 24
5.2.8 Acquirer characteristics ... 26
6. Empirical results ... 28
6.1 Comparison between cross-listed and non-cross-listed acquirers ... 28
6.1.1 M&A activity ... 28
6.2 D&O insurance coverage and acquirer returns ... 31
6.2.1 Univariate analyses ... 34
6.2.2 Multivariate analysis: Cross-listing ... 37
6.2.3 Multivariate analysis: Additional control variables ... 40
6.2.4 Instrumental variables approach ... 42
6.3 D&O insurance premium and acquirer returns ... 44
6.3.1 Univariate analysis ... 45
6.3.2 Multivariate analysis: Deal characteristics ... 47
6.3.3 Multivariate analysis: Acquirer characteristics and deal types ... 49
6.3.4 Sensitivity test ... 51
7. Discussion of results ... 53
7.1 Legal implications ... 53
7.2 Economic implications of my research ... 55
7.2.1 Economic implications of D&O insurance coverage ... 55
7.2.2 Economic implications of D&O insurance premium ... 57
8. Conclusions... 59
REFERENCES... 61
APPENDIX A. Variable definitions ... 65
APPENDIX B. Acquisitions by announcement year ... 67
APPENDIX C. Summary statistics ... 68
APPENDIX D. Univariate analysis: Insurance indicator ... 69
APPENDIX E. Industry compositions ... 70
LIST OF TABLES
Table 1: Acquisitions by announcement year ... 17Table 2: Acquirer returns and deal types between cross-listed and non-cross-listed firms ... 31
Table 3: Summary statistics of D&O insurance coverage: Cross-listed firms ... 32
Table 4: Summary statistics of D&O insurance coverage: Non-cross-listed firms ... 33
Table 5: Univariate analysis of cross-listing ... 34
Table 6: Univariate analysis of D&O insurance coverage: High and low ratios ... 36
Table 7: Regression of acquirer returns and D&O insurance coverage: Cross-listing ... 39
Table 8: Regression of acquirer returns and D&O insurance coverage: Additional controls ... 41
Table 9: Instrumental variables approach ... 43
Table 11: Univariate analysis of D&O insurance premium and governance indexes ... 46
Table 12: Regression of acquirer returns and governance quality: Deal characteristics ... 48
Table 13: Regression of acquirer returns and governance quality: Additional controls ... 50
Table 14: Dummy variables approach ... 52
Table 15: Summary of empirical findings ... 53
Table 16: Variable definitions ... 65
Table 17: Acquisitions by announcement year: Total sample ... 67
Table 18: Summary statistics: Total sample ... 68
Table 19: Univariate analysis of D&O insurance purchase ... 69
LIST OF FIGURES
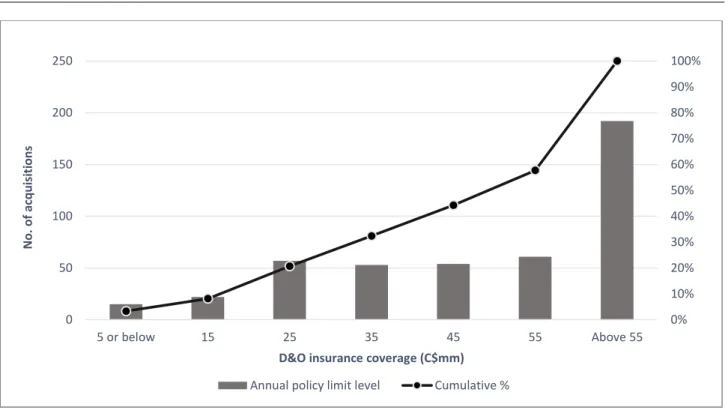
Figure 1: Annual D&O policy limit levels and no. of acquisitions: Cross-listed firms ... 29Figure 2: Annual D&O policy limit levels and no. of acquisitions: Non-cross-listed firms ... 29
Figure 3: Industry composition of cross-listed acquirers ... 70
1.
Introduction
“What you’re really underwriting when you underwrite D&O is you’re underwriting the people. You’re underwriting the senior management, the quality of the management team.” ― D&O broker, Baker and Griffith (2007)
Directors and officers are responsible for the firm’s actions with their personal assets in the event of a lawsuit against the firm and its management. They can protect themselves from these liabilities by having the corporation to purchase a directors’ and officers’ liability insurance (hereafter referred to as D&O insurance). Many studies have found evidence that the protection provided by the D&O insurance can affect the management’s decisions and thus the D&O insurance information can be valuable in evaluating the effectiveness of corporate governance structures and maximizing returns to outside shareholders. Furthermore, D&O insurers go deep in the governance structures of their clients in the underwriting process, and recent studies have found evidence that the pricing of the firm’s D&O insurance can include information on the quality of governance structures that is not otherwise publicly available. As stated in the quote above, D&O insurance underwriting is a process of evaluating the quality of the firm management.
The relationship between stockholders and management is the basic example of the traditional principal-agent relationship. As it is always the case with a principal-agent relationship, it is not possible to completely eliminate the conflict of interest between directors and stockholders. The director is acting as the agent for the shareholders and is supposed to make decisions that will maximize shareholder wealth. However, it is in the director's own best interest to maximize his own wealth. D&O insurance decision can affect the shareholder-director relationship by motivating the director to act either more or less in the best interest of stockholders. Whether the D&O insurance is beneficial for the stockholders or not is an empirical question.
D&O insurance information is publicly available only in a few countries in the world and most of the D&O insurance studies are conducted with Canadian, Taiwanese or British data. As Kang and Klausner (2011) point out, the legal environment is very litigious in the US and there has been recently loss of confidence in corporate governance resulting from the debacle of corporates like Enron, Worldcom, Adelphia, and Anderson. Today directors are facing even greater risk of lawsuits originating from shareholders. Therefore, D&O insurance can be especially important for directors of firms operating in the US market. However, firms are not required to publish their D&O insurance data in the US and thus the effects of D&O insurance on US firms are still not well known.
In this thesis, I shed light on the effect of D&O insurance in US market by using a sample of US cross-listed firms. I study D&O insurance coverage and D&O insurance premium and test their relevance on explaining acquirer returns. I look for any correlation between these two D&O insurance variables and cumulative abnormal announcement returns. With D&O insurance coverage I make comparison between firms which are listed only in the Toronto Stock Exchange (TSX) to those which are also cross-listed in one of the stock markets in the US (NYSE, Amex, or Nasdaq). Dividing my sample into cross-listed and non-cross-listed firms gives an opportunity to see the effects of the D&O insurance decision for the firms participating in the US market. Furthermore, with the sample of cross-listed firms, I use D&O insurance premium and two most commonly used Canadian corporate governance indexes as proxies for the quality of corporate governance and test their ability to explain acquirer returns.
1.1Contribution to existing research
There has been recently a growing consensus in D&O insurance research. However, data used in most of the studies are limited to countries where firms are required to publish their D&O insurance information. Therefore, there are still many interesting market areas, especially the US, where the effects of D&O insurance are still not well known. By taking the same approach as Kang and Klausner (2011) in their study of D&O insurance and CEO overcompensation, I am using Canadian firms cross-listed in the US to get comparable results to US firms. To the best of my knowledge, using cross-listed firms is by far the most accurate way to study D&O insurance in the US market at the moment.
Thanks to the cross-listing approach, my thesis adds to the current research in several ways. It is by far the first paper to research the effects of D&O insurance coverage on acquirer returns with a sample that differentiates firms listed in the US. It is also the first paper to test successfully D&O insurance premium as a proxy for the quality of corporate governance and to make comparison between D&O insurance premium and corporate governance indexes in an acquisition event.
In addition to filling the existing research gap on the effects of D&O insurance, my research also has practical significance to legislators, outside investors, and firm management and owners. It supports the idea that legislators should require firms to disclose their D&O insurance information in countries where this piece of information is not yet publicly available, as it can be valuable for outside investors in evaluating the effectiveness of firm’s governance structures. This study provides firm management and owners support for their optimal D&O insurance decision.
1.2Key research questions
My study can be divided into two high-level categories. First, I study the relation between D&O insurance variables and acquirer returns, including the decision to purchase the insurance and the amount of coverage purchased. I also take a look at differences in M&A activity between different kinds of firms. I split the sample firms into two groups, the first one covering firms which are listed only in Canada (non-cross-listed firms), and the other covering firms which are cross-listed in the US (cross-listed firms). This leads to my first three research questions:
I. Research question: Is there a difference in the amount of D&O insurance coverage between firms listed only in Canada and firms cross-listed in the US?
II. Research question: Is there a difference in M&A activity of firms with low and high D&O insurance coverage between cross-listed and non-cross-listed firms?
III. Research question: Is there a difference in the impact of D&O insurance coverage on acquirer returns between non-cross-listed firms and firms cross-listed in the US?
The second high-level category of my study focuses on the D&O insurance premium and acquirer returns using the cross-listed sample. I develop a proxy from the D&O insurance premium for the quality of corporate governance and study its relation with acquirer returns. As a comparison I run the same regressions for two corporate governance indexes and see which one has the strongest explanatory power of acquirer returns.
IV. Research question: Can D&O insurance premium explain acquirer returns and thus be used as a proxy for the quality of corporate governance?
V. Research question: Which one of the variables, D&O insurance premium or the two governance indexes, has the strongest explanatory power of acquirer returns?
1.3Findings of the study
My data set reveals differences between firms and their D&O insurance decisions based on their cross-listing status. Cross-listed firms are on average larger, they are more likely to purchase D&O insurance, and they purchase higher levels of D&O insurance coverage than firms that are non-cross-listed. In my sample 83.5% of cross-listed firms and 67% of non-cross-listed firms carry a D&O insurance policy. The average coverage for a cross-listed firm is C$84.8M and the average coverage
for a non-cross-listed firm is C$18.1M. However, in relation to firm size, non-cross-listed firms carry higher D&O insurance coverage ratios than cross-listed ones.
The first key finding of my study is that firms listed only in Canada experience significantly lower acquirer abnormal returns when they carry higher levels of D&O insurance coverage. The negative relation is in line with the prior literature. However, the relation becomes significantly positive when firms are cross-listed in the US. In the cross-listed group a one-standard-deviation higher insurance coverage ratio increases acquirer abnormal announcement returns by 1.4% and in the non-cross-listed group it decreases them by -0.7%. The positive relation between D&O insurance coverage and acquirer returns in the cross-listed group holds after controlling for deal and acquirer characteristics, deal types based on target and financing status, and year and industry fixed-effects. Furthermore, the results are robust after addressing the possible endogeneity problem by using an instrumental variable approach. The indirect evidence of this study suggests that cross-listed firms with low D&O insurance coverage make relatively fewer acquisitions than non-cross-listed firms with low coverage. Reduced M&A activity among cross-listed firms with low coverage can be an indication of an underinvestment problem.
The second key finding of my study is the significant negative relation between D&O insurance premium and acquirer returns, indicating that insurance companies can price the risk related to corporate governance structures of a firm. More specifically, a one-standard-deviation increase in the natural logarithmic transformation of per dollar D&O insurance premium reduces acquirer abnormal announcement returns by 0.9%. The negative relation between premium and acquirer returns holds after controlling for deal and acquirer characteristics, deal types based on target and financing status, and year fixed-effects. Furthermore, the results are robust after sensitivity testing by a dummy variable approach. My results also suggest that there is no significant relation between either of the two corporate governance indexes and acquirer returns. My results support the idea that D&O insurance premium includes valuable information not otherwise available in the market.
1.4Limitations of the study
As it is with all the D&O insurance studies, the availability of insurance data is always a concern. Therefore, to get an idea of US firms the study has to be made with Canadian firms that are cross-listed in the US. It is possible that these cross-cross-listed Canadian firms have some meaningful differences to US firms that cannot be taken into account in this study. One possible difference is in the industry structures of the two countries. For example, in Canada large mining companies account for much larger share of the total market than in the US. I address the industry composition issue by using
industry fixed-effects, which should at least reduce the effect of the differences in industry structures. Also, the number of sample firms available for the study is quite limited as they have to be cross-listed and publish their D&O insurance information in enough detail.
The other limitation of this study is in the data collecting. D&O insurance and corporate governance indexes data have to be hand-collected. As my sample includes only firms that have made acquisitions, comparing M&A activity between firms with different levels of protection can provide only indirect evidence on their acquisition decisions. There are some control variables that could be meaningful, but they would also require hand-collecting and are thus out of scope of this study. For example, including CEO experience and board characteristics could improve the explanatory power of my model. There are also some control variables that could be meaningful, such as relative deal size, but they would reduce the sample size considerably and therefore they have to be omitted from the regression model. The level of detail in the disclosure of D&O insurance information is at times relatively poor. Some firms report having the insurance on their proxy circulars, but they do not provide any other necessary information for this study.
1.5Structure of the study
The thesis is structured as follows. Chapter 2 provides an overview of D&O insurance, corporate governance, cross-listing, and existing literature by discussing both the existing research on the topic and the D&O insurance and corporate governance on a more general level. Chapter 3 introduces my hypotheses. Chapter 4 covers data and sample selection used in this study. Chapter 5 introduces methods and the construction of variables. Chapter 6 presents the empirical results of my analysis. In chapter 7 I discuss my results and link them to my research questions. In chapter 8 I conclude the key results and suggest areas for future research.
2.
Literature review
This section provides an overview on the existing literature. First, I discuss the D&O insurance in general and reasons why firms purchase the insurance. Next, I discuss what the current literature finds about D&O insurance coverage, D&O insurance premium, and cross-listing of a firm. Then I explain the relation between D&O insurance and corporate governance, and go through the meaning of D&O insurance in corporate governance studies. Finally, I bring up some problems with the current corporate governance research and corporate governance indexes.
2.1D&O insurance in general
Directors can be sued under the corporate law for breach of acting honestly and in good faith or duty of care. They can be sued under the securities law, which is according to Donley and Kent (2008) the most significant source of risk for the directors. Both D&O insurance and corporate indemnification provide protection to directors and officers for legal liability arising from their professional activities on behalf of the firm. Indemnification is a process in which firms agree to compensate executives for the costs of defense and or settling lawsuits brought against them personally as a result of their actions in the management. Firms purchase D&O insurance to recoup these indemnification costs, or to provide protection when indemnification does not apply. According to Lin, Officer and Zou (2011), most securities class action lawsuits in the US brought by shareholders are settled out of the court within the D&O insurance coverage limit. Therefore, for a firm D&O insurance is an important source of protection for the defense and settlement of lawsuits.
In the US the importance of D&O insurance has been increasing in recent years. Surveys conducted by consulting firm Tillinghast-Towers and Perrin (2002, and 2012) highlight the change: In 2002, 19% of firms in the US had at least one lawsuit brought against their directors in the previous ten years, but their similar study in 2012 reports the share had increased to 36%. The increase in lawsuits indicates that D&O insurance claim activity is increasing and it has become a public company phenomenon. The study in 2012 also states that most of the claims against directors and officers are brought from direct shareholders (46%), derivative shareholders (40%) and employees (30%). Regulatory actions have increased their share of claims since new laws put in place due to the financial crisis, including Dodd-Frank Wall Street Reform and Consumer Protection Act. They accounted for 23% of all claims in 2012 as in comparison it was 16% in 2010. Furthermore, inquiries in the US made by directors about the amount and scope of coverage, has become more common due to the growing number of claims made against them. According to the survey made by
Tillinghast-Towers and Perrin (2012), firms have reacted to the growing number of claims by increasing their total insurance coverages at D&O program renewals. The whole marketplace for the insurance has been put into a state of transition, as evidenced by higher pricing experienced in many sectors. According to Lin, Officer, Wang and Zou (2013), the Canadian system for handling securities class action lawsuits is similar to that in the US to a large extent. They point out that the liability risk to corporate directors and officers often comes from shareholder litigation or lawsuits brought by other parties such as creditors and regulators. According to Chalmers, Dann and Harford (2002), directors and officers consider D&O insurance to be crucial in Canada as it is in the US. For example, in Canada the costs of settlement or judgment in derivative suits are typically covered by a D&O insurance policy. However, there are some important differences between the governance systems in Canada and the US that can have an effect on whether D&O insurance protection is beneficial for the corporate shareholders or not. According to Gouiaa and Zéghal (2013), Canadian firms operate within a socio-economic environment which has many distinguishing features that can influence both the governance practices and the financing costs. In Canada firms use a specific governance system which includes strong legal and extra-legal institutions aimed at protecting investors. It is characterized by a principle-based governance approach.
2.2Reasons why firms purchase D&O insurance
According to O’Sullivan (2002), firms purchase D&O insurance for three main reasons: (1) as a part of their corporate insurance program, (2) due to demand from directors, and (3) as part of an optimal governance arrangement:
First, for many firms D&O liability insurance is an important part of their insurance program. It covers the firm itself from the costs of lawsuit settlements caused by the actions of the management. Hazen and Hazen (2012) point out that the criticality of D&O insurance can be assessed from the fact that directors of even not-for-profit firms are advised to act in the same manner as directors of firms when D&O insurance is not available.
Second, directors are representative of the corporation and they can be personally liable for some of their actions committed in the name of the corporation. Therefore, the existence of the D&O insurance can be, according to Boyer and Delvaux-Derome (2002), a notable factor when they are deciding whether to join the firm or not. Romano (1989) points out directors are known to resign or not to come aboard in for-profit firms in absence of D&O insurance.
Third, according to Chi, Weng, Gong and Chen (2013), firms have established internal corporate governance mechanisms to encourage CEO risk taking behavior by providing D&O insurance and by awarding CEOs equity incentives. D&O insurance works also as a corporate governance mechanism due to monitoring and inspection done by the insurer. As the insurance allows executives to face lower litigation risk, it can allow them to take appropriate risks to maximize shareholder value. However, D&O liability insurance can also entrench directors because of the protection it provides them against shareholder lawsuits. Therefore, the effect of D&O insurance on shareholder wealth is an empirical question.
There are many firm specific factors that affect the decision whether to buy the D&O insurance or not. According to Boyer and Delvaux-Derome (2002), firms that are larger, have higher stock volatility, are more exposed to US litigation, exhibit lower levels of directorial ownership, and possess greater non-executive representation on their boards are more likely to purchase the insurance. Core (1997) also points out that a firm with greater inside voting control is more likely to purchase D&O liability insurance and carry higher limits. On the other hand, Boyer and Delvaux-Derome (2002) state that firms that are strong financially, have many outsiders on the board of directors or their board member have an important financial stake in the firm are less likely to purchase the insurance.
2.3Main findings in prior literature on D&O insurance
In recent years, D&O insurance has become a more common part of insurance packages due to the tightened legal environment after many company scandals and the financial crisis. Now the actions of firm management are even more under the scope than before. Therefore, there is a growing consensus in D&O insurance research as well. These studies have found evidence that D&O insurance affects management behavior and that there is a relation between D&O insurance variables and the quality of governance structures.
Jensen's (1986) free cash flow hypothesis argues that directors realize large personal gains from empire building. Morck, Shleifer, and Vishny (1990) identify that several types of acquisitions, such as diversifying acquisitions and acquisitions of high growth targets, can yield substantial benefits to directors, while at the same time hurting shareholders. The level of D&O insurance protection can affect the incentives of the management team to make these decisions hurting shareholders. However, the effects vary between different studies. Some of the studies report that extensive D&O insurance protection leads to higher risk taking and more diversifying acquisitions due to the empire building behavior. For example, according to Lin et al. (2013), there is a positive relation between both idiosyncratic and total risk of a firm and the D&O insurance coverage in Canada. They suggest that
lenders view D&O insurance coverage as increasing credit risk associated with greater risk taking and higher probabilities of financial restatement due to aggressive financial reporting. Furthermore, Lin et al. (2011) find that D&O insurance coverage has negative relation with acquirer returns in Canada.
On the other hand, there are also studies suggesting that extensive D&O insurance protection makes shareholders better off. For example, Kalelkar and Nwaeze (2015) find that firms in the US with abnormal D&O insurance protection are positively associated with aggressive reporting, aggressive investment activity, and abnormal profit performance. However, their study is based on voluntary disclosures of D&O insurance information, which do not have standard format and reduces the sample size. Whether higher D&O insurance protection is beneficial for shareholders in the US market is still an empirical question.
According to Core (2000), there is a growing consensus inside and outside academics that weak corporate governance is costly to outside shareholders. They also state that it is difficult and costly for shareholders to assess its quality. There are studies suggesting that D&O insurance premium can be used as a proxy for evaluating governance structures. For example, Baker and Griffith (2007) report that insurers seek to price D&O policies according to the risk posed by each prospective insured and that underwriters focus on corporate governance in assessing risk. According to them, in addition to performing a basic financial analysis of the firm, underwriters focus a large part of their efforts on deep governance variables such as culture and character, rather than the formal governance structures that are typically studied.
Core (2000) states it is too costly for the insurer to just exclude all claims arising from weak corporate governance. Since the quality of governance structures varies in cross section for otherwise identical firms, the insurer prices the quality of corporate governance in D&O premiums. A firm with weaker governance has greater litigation risk because the management of such a firm is more likely to act inconsistent with shareholders’ interests. Core shows a detectable variation in D&O premium that is related to variables which proxy for the quality of firms’ governance. Both Core (2000) and Kang and Klausner (2011), show that the proxies for weak governance are positively associated with excess CEO compensation. Their results provide evidence that D&O insurers charge firms higher premiums when they adopt governance structures that make shareholders worse off. To the best of my knowledge, the empirical question of the possible relation between D&O insurance premiums and acquirer returns has not yet been tested.
2.4Cross-listing in the US
Exposure to the more litigious US legal environment has been found to be a significant determinant of the D&O premium (see Core, 2000). Adoption of Sarbanes-Oxley requirements in 2002 made cross-listing in US exchanges more expensive than it was in the past and the new requirements put a heavy emphasis on corporate governance and accountability. As cross-listing can have various effects on corporate governance structures, I take firms’ cross-listing in the US into account in this study. Cross-listing can have an effect on the firm’s D&O insurance purchase decision and management behavior, and also on the pricing of the D&O insurance. For example, Burns, Francis, and Hasan (2007) find that compared to firms based in the US, cross-listed firms are less likely to use equity in takeovers of US targets. They also find that cross-listing reduces barriers to investment. Furthermore, Lang, Lins, and Miller (2004) find that firms that are cross-listed in US exchanges have greater analyst coverage and increased forecast accuracy than firms that are non-cross-listed. They also show that cross-listed firms have higher valuations. They state that the change in firm value around cross listing is correlated with changes in analyst following and forecast accuracy, suggesting that cross listing enhances firm value through its effect on the firm's information environment. Their findings support the hypothesis that cross-listed firms have better information environments that are associated with higher market valuations.
In theory, it is possible that the stock prices of cross-listed firms could differ between the stock exchanges, which could have an effect on this study. However, Eun, and Sabherwal (2003) find that prices in the TSX and US exchange are cointegrated and mutually adjusting for firms listed in both countries. They state that the US share is directly related to the US share of trading and to the ratio of proportions of informative trades on the US exchange and the TSX, and inversely related to the ratio of bid-ask spreads.
2.5Theoretical framework of corporate governance
The theoretical framework of corporate governance is based on the finance literature of the late 1970s and the legal literature of the 1980s. In 1976, Jensen and Meckling developed a theory of agency costs in the public firm, which remains the dominant framework of analysis for corporate governance today. A contractarian view of corporation emerged, in which corporation was viewed as a nexus of contracts among constituents, including directors, shareholders, creditors, employees, and others. Since then, the focus of governance has primarily been on the agency relationship between directors and shareholders. In corporate governance the contractual shareholder-director relationship means
that market forces lead the parties to create governance arrangements and adopt legal rules that would minimize agency costs and thereby maximize firm value. In the literature, contractual governance is seen as superior to legally imposed governance arrangements because firms are different along numerous dimensions and market forces create incentives to customize and to innovate.
However, Klausner (2013) states that the contractarian theory failed to take into account important institutional facts. He states that the empirical literature provides the facts needed to reassess the contractarian theory and the understanding of corporate governance in general. Also, Gillan (2006) points out that traditional empirical research of corporate governance is increasingly under attack from critiques of endogeneity. There have been calls from many researchers including Coles, Lemmon and Meschke (2012), and Zingales (2000) amongst others, to further develop structural models or quantitative theories of the firm to improve the empirical work. Klausner suggests that the study of empirical regularities and associations combined with traditional theoretical modelling and the development of structural models will pave the way forward. He states that careful modeling of transactional event, such as mergers and acquisitions, and how they relate to governance characteristics will continue to be a stable of governance research. Therefore, as D&O insurance can include additional information on firm’s governance structures, it can provide a new angle for corporate governance studies.
2.6Benchmark for D&O insurance premium: Governance indexes
To get a better idea how well D&O insurance premium can explain corporate governance quality, it needs a benchmark to make a comparison. In the literature, corporate governance indexes are typically used to evaluate the quality of corporate governance. Therefore, they are a relevant choice for the benchmark.
Some researchers (see Gompers, Ishii and Metrick, 2003; Brown and Caylor, 2006; Bebchuk, Cohel and Ferrell, 2009) consider the approach of assessing governance quality by building an index with several aspects of corporate governance to be of great importance. However, there are researchers who think the opposite. Gouiaa and Zéghal (2013) suggest that governance indexes cannot evaluate the quality of the board of directors. They conclude that governance indexes are highly imperfect and that investors and policymakers should exercise extreme caution in attempting to evaluate firm's quality or forecast future stock market performance from its ranking on any particular governance measure. Furthermore, they point out that the effect of governance indexes in financing costs is not clearly established. Bhagat and Bolton (2008) consider the specific characteristics of the board as
better determinants of the quality and the effectiveness of corporate governance. In the following paragraphs I explain briefly how governance indexes are developed.
The construction of an index requires that all variables are weighted. Currently used corporate governance indexes combine different attributes of the governance to evaluate its overall quality. Indexes vary with respect to which attributes of corporate governance are included. The first indexes were created by academics and researchers, but the stream of governance research generated commercial indexes as well. Bebchuk et al. (2009) state that commercial indexes are designed primarily for institutional investors pursuing information about the quality of corporate governance system to support portfolio decisions, and to firms that want to signal their governance quality to investors. Bhagat and Bolton (2008) suggest that the main difference between the two types of indexes is based on their expertise and their analytical approach to corporate governance.
First difference is in the weights given to governance features in the indexes. In the commercial ones features differ from one to another and from one firm to another. They are generally based on a number of governance factors which are not equally weighted. For example, the weights assigned to the components can be based on their correlations with the level of risk and past performance of the firm. Furthermore, the scores for commercial indexes and the weights of the items that compose them are also modified and updated to better reflect market trends in corporate governance. Therefore, the weighting scale of a commercial index can be significantly affected by the subjective judgment of analysts based on their experience and knowledge.
According to Bozec and Bozec (2012), commercial indexes are generally expressed in relative terms with each firm rated relative to industry or size peers. They point out that academic indicators, on the other hand, give absolute ratings of the quality of governance practices regardless of comparable firms. Thus, it is possible that the weight assigned to a particular governance feature is not consistent with those used by financial market participants in assessing the quality of corporate governance. Bhagat and Bolton (2008) suggest that inconsistency in weights can lead investors to draw incorrect inferences and conclusions from empirical studies. Furthermore, Renders, Gaeremynck, and Sercu (2010) state that in commercial indexes board characteristics are most studied while other mechanisms are not included or they are poorly weighted.
On the other hand, academic indexes include a smaller number of governance features that are targeted directly to the firms at hand. These attributes are equally weighted and take a binary value depending on the presence or absence of a governance practice. Bozec and Bozec (2012) state that
academic indexes are supposed to be less subjective than commercial o, since they are based on a simple count of the value assigned to each governance feature and they are usually expressed as absolute measures. Researchers have the opportunity to select the sample and the governance attributes that they consider relevant when they construct the indexes by themselves.
3.
Hypotheses
This study tests how well two D&O insurance variables, coverage and premium, can explain acquirer returns. This section outlines the hypotheses that are tested to find answers to my research questions provided in the introduction and I also provide a brief theoretical background behind the stated hypotheses. I present results in the empirical section of this study.
3.1D&O insurance coverage
D&O insurance coverage can have an effect on the behavior of firm directors. As the legal environment is more litigious in the US than it is in Canada, management teams of firms operating in the US market are under higher personal risk when taking care of their work. Furthermore, firms listed in two different market areas are likely to receive more analyst coverage. Therefore, directors of cross-listed firms are under higher outside control and their incentive to work against the shareholders’ will to get personal benefits can be more difficult. This leads me to my first hypothesis: H1: Firms that are cross-listed in the US are more likely to purchase D&O insurance and they carry higher coverage limits than firms that are listed only in Canada.
In theory higher D&O insurance protection can be either beneficial or harmful for shareholders. It can lead to destructive empire building behavior or otherwise it can correlate with abnormal profit performance. It is possible that the environment where the firm operates has an important influence on the outcome. Prior literature shows that firms listed in Canada are in general worse off when they carry higher limits of D&O insurance coverage. However, the legal environment is more litigious in the US and therefore high liability exposure can cause under-investment problems by inducing directors to be overly conservative and can cause them to forgo risky positive-NPV projects. If that was the case, M&A activity of firms with low D&O insurance coverage should be lower than the M&A activity of firms with high D&O insurance protection. This leads to my second hypothesis: H2: M&A activity of firms with low D&O insurance coverage is relatively lower if firms are cross-listed comparing to non-cross-cross-listed firms.
If that was the case, it is possible that cross-listed firms with higher D&O insurance coverage follow more optimal investment strategy that leads to higher acquirer returns than firms with low coverage. My next hypothesis is based on the idea that the underinvestment problem among firms with low D&O insurance coverage is more sever among cross-listed firms than non-cross-listed firms as they are operating under US legislation:
H3: D&O insurance coverage has negative effect on acquirer returns, but the effect becomes positive when the firm is cross-listed in the US.
3.2D&O insurance premium
According to Kang and Klausner (2011), D&O insurance premium contains information valuable to capital market participants. Core (2000) suggests that D&O insurance premium can be hypothesized to be a function of the quality of corporate governance and its business risk:
𝐷&𝑂 𝑖𝑛𝑠𝑢𝑟𝑎𝑛𝑐𝑒 𝑝𝑟𝑒𝑚𝑖𝑢𝑚 = 𝑓(𝑔𝑜𝑣𝑒𝑟𝑛𝑎𝑛𝑐𝑒 𝑞𝑢𝑎𝑙𝑖𝑡𝑦, 𝑏𝑢𝑠𝑖𝑛𝑒𝑠𝑠 𝑟𝑖𝑠𝑘) (1) Core states that governance structure quality and business risk, such as firm size and profitability, increases litigation risk. As low quality governance structures can be expected to increase firm’s D&O insurance premium, higher D&O insurance premium should lead to worse acquirer returns. This leads to my fourth hypothesis:
H4: D&O insurance premium has a negative relation with acquirer returns.
According to Kang and Klausner (2011), disclosure of D&O insurance information can provide useful supplemental information on governance quality due to underwriters’ unique access to non-public information of non-disclosure agreements. As most firms purchase the D&O insurance, the information signaled through the disclosure of D&O insurance details can be the only reliable third-party assessment of governance quality for firms that don’t receive any analyst coverage at all. The assumption that this piece of information is not otherwise publicly available lead to my fifth hypothesis:
H5: Due to unique information contained in D&O insurance premium, it has higher explanatory power of acquirer returns than corporate governance indexes implicating that it works better as a proxy for the quality of corporate governance than the indexes.
4.
Data and sample selection
The initial sample consists of 2,238 acquisitions made by publicly traded firms listed in the TSX during the time period between 2003 and 2013. TSX is the largest stock exchange in Canada and represents a broad range of businesses from Canada, the US, and Europe. The reason why I use Canadian data is that D&O insurance data are publicly available there, unlike in the US. However, according to Core (2000), the more litigious US legal environment has been found to be significant determinant of the D&O decision. To study the effects of D&O insurance on firms operating in the US market, I divide the data into two subgroups: cross-listed firms and non-cross-listed firms based on their possible listing on one of the US stock exchanges (NYSE, Amex, or Nasdaq). Cross-listing and exposure to US securities litigation risk makes the sample firms close proxies for US firms. Dividing the data allows me to make comparison between firms operating in Canadian and the US market. The group of cross-listed firms consists of 636 completed acquisitions and the group of non-cross-listed firms consists of 1,602 completed acquisitions.
I extract my acquisition sample from the Securities Data Corporation (SDC) Mergers and Acquisitions database. The acquisitions that meet the following criteria are included in the sample: 1. The acquisition is completed.
2. The acquirer has D&O insurance information data (insurance coverage, insurance period, and insurance premium) from the System for Electronic Document Analysis and Retrieval (SEDAR). 3. For the D&O insurance premium analysis, the acquirer has governance index data from Globe and Mail (GMI index) and Board Shareholder Confidence Index (BSCI index).
4. The acquirer has annual financial statement information available and stock return data (210 trading days prior to acquisition announcements) from Datastream.
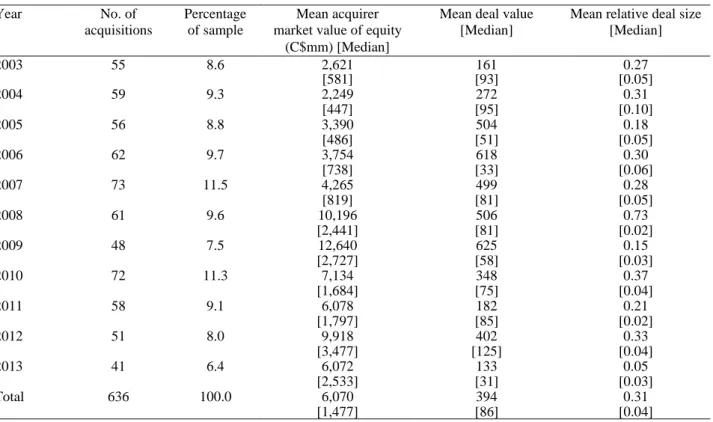
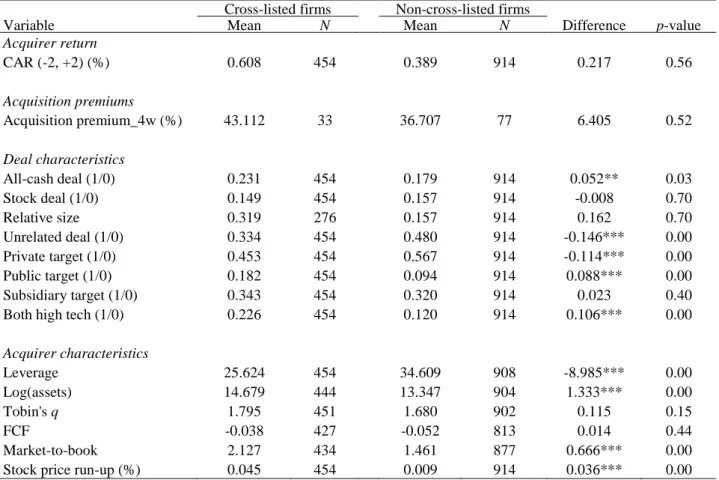
Table 1 presents the distribution of the sample of acquisitions by announcement year: Panel A consists of cross-listed firms and Panel B consists of firms that are only listed in the TSX. The distribution for the whole sample is in Appendix B. The larger sample size of non-cross-listed firms is due to their larger share in the TSX. Table 1 shows that the number of acquisitions per year is quite uniform for both groups during the sample period. The mean acquirer market value of equity and the mean deal value are greatly larger for the cross-listed groups than for the non-cross-listed group. On the other hand, mean relative deal size is over two times larger for the non-listed group than for the cross-listed group.
Table 1: Acquisitions by announcement year
The sample consists of 2,238 completed acquisitions made by firms that were listed in the Toronto Stock Exchange between 2003 and 2013, subject to the availability of D&O insurance and stock price information. Panel A consists of 636 acquisitions that were made by firms that were cross-listed in one of the US stock exchanges (NYSE, Amex, or Nasdaq). Panel B consists of 1,602 acquisitions that were made by firms that were listed only in the Toronto Stock Exchange at the announcement date. The numbers in parentheses are medians. C$mm is millions of Canadian dollars. Absolute dollar values are expressed in real terms (2003 Canadian dollars) and calculated using the Bank of Canada inflation calculator. Relative size is defined in Appendix A.
Panel A: Cross-listed firms
Year No. of Percentage Mean acquirer Mean deal value Mean relative deal size acquisitions of sample market value of equity [Median] [Median]
(C$mm) [Median] 2003 55 8.6 2,621 161 0.27 [581] [93] [0.05] 2004 59 9.3 2,249 272 0.31 [447] [95] [0.10] 2005 56 8.8 3,390 504 0.18 [486] [51] [0.05] 2006 62 9.7 3,754 618 0.30 [738] [33] [0.06] 2007 73 11.5 4,265 499 0.28 [819] [81] [0.05] 2008 61 9.6 10,196 506 0.73 [2,441] [81] [0.02] 2009 48 7.5 12,640 625 0.15 [2,727] [58] [0.03] 2010 72 11.3 7,134 348 0.37 [1,684] [75] [0.04] 2011 58 9.1 6,078 182 0.21 [1,797] [85] [0.02] 2012 51 8.0 9,918 402 0.33 [3,477] [125] [0.04] 2013 41 6.4 6,072 133 0.05 [2,533] [31] [0.03] Total 636 100.0 6,070 394 0.31 [1,477] [86] [0.04]
Panel B: Non-cross-listed firms
Year No. of Percentage Mean acquirer Mean deal value Mean relative deal size acquisitions of sample market value of equity [Median] [Median]
(C$mm) [Median] 2003 71 4.4 663 64 0.38 [225] [11] [0.09] 2004 104 6.5 602 123 0.88 [173] [27] [0.15] 2005 147 9.2 537 60 0.55 [248] [20] [0.09] 2006 137 8.6 746 108 1.04 [274] [22] [0.11] 2007 183 11.4 1,017 105 0.34 [215] [20] [0.10] 2008 164 10.2 845 57 0.44 [234] [23] [0.07] 2009 155 9.7 1,180 81 0.37 [342] [34] [0.10] 2010 161 10.0 645 76 0.98 [209] [25] [0.18] 2011 180 11.2 971 130 1.27 [364] [47] [0.13] 2012 134 8.4 1,137 214 0.31 [500] [44] [0.12] 2013 166 10.4 760 184 0.35 [420] [28] [0.09] Total 1602 100.0 846 110 0.63 [326] [31] [0.11]
5.
Methods and variables
The reason why I study the effects of D&O insurance variables on shareholder wealth in an event study with acquisition announcements as event dates, is the fact that they are among the largest and most readily observable forms of corporate investment. Berle and Means (1932) and Jensen and Meckling (1976) state that acquisitions tend to intensify the inherent conflicts of interest between directors and shareholders in larger public firms. Sometimes directors extract private benefits at the expense of shareholders by making value destroying acquisitions, and thus acquisitions suit very well for D&O insurance research.
5.1Structure of the analysis
Before conducting analyses on D&O insurance coverage and D&O insurance premium, I first make comparisons between acquisitions made by cross-listed firms and non-cross-listed firms. To find out whether there are some fundamental differences in the deals that these two groups of firms make, I take a look at M&A activity, mean payment methods, mean target types, and relative deal sizes between the two groups.
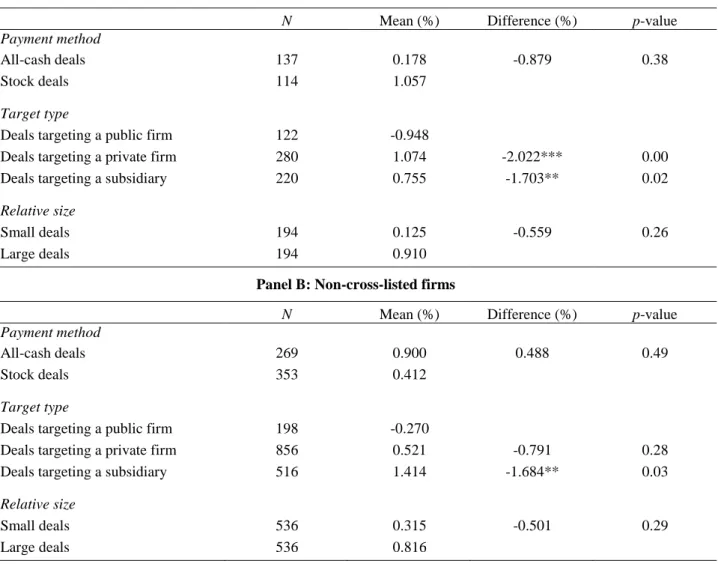
After the comparison between cross-listed and non-cross-listed firms, I focus first on the D&O insurance coverage and then on the D&O insurance premium. I use univariate analyses, multivariate regressions, and robustness checks for both of the variables. In both cases, I first take an initial look at univariate statistics to see if there are any broad patterns in the data that are consistent with my hypotheses about the relation between D&O insurance variables and acquirer returns. With the D&O insurance premium, I also compare univariate statistics to two corporate governance indexes. Specifically, I split the sample into different groups to compare the mean values of acquirer cumulative abnormal announcement returns (CARs), acquisition premiums, and a variety of deal characteristics. The results for D&O insurance coverage will be discussed in Section 6.2.1, and the results for D&O insurance premium will be discussed in Section 6.3.1.
After the univariate analyses, I develop OLS regression models to examine the effect of D&O insurance variables on CARs. With the D&O insurance coverage, I first compare the effect of D&O insurance coverage on acquirer returns between cross-listed and non-cross-listed firms by using a dummy variable approach. Then I conduct further analyses for the cross-listed firms: I run three stages of OLS regressions to see whether the relation between the coverage and the acquirer returns hold. Each stage adds new control variables to the model: The first one controls for deal characteristics, second one adds interactions of three target status indicators and two method-of-payment indicators,
and the third one adds acquirer characteristics. I conduct the same three stages of OLS regressions for the D&O insurance premium as well. The results for the D&O insurance coverage will be discussed in Sections 6.2.2 and 6.2.3. The results for the D&O insurance premium will be discussed in Sections 6.3.2 and 6.3.3.
In the OLS regressions I use standard errors that are adjusted for heteroskedasticity introduced by White (1980), and acquirer clustering to calculate t-statistics for statistical significance based on two-sided tests at the 1%, 5%, and 10% level, respectively. Heteroskedasticity is adjusted in most empirical studies to avoid the assumption that the errors have the same variance across all observation points. In real life events it is most likely that the variances differ and thus heteroscedasticity-consistent standard errors allow the fitting of a model that does contain heteroscedastic residuals. Petersen (2009) points out that clustering standard errors at the acquirer level allows more flexibility in variance-covariance matrix as it relaxes the homoscedasticity assumption of the OLS regression by accounting for the fact that there might be a bunch of covariance structures that vary by a certain characteristic, but are homoscedastic within each cluster.
Finally, I conduct endogeneity and sensitivity tests for my results. I use instrumental variable approach for the D&O insurance coverage by using industry average D&O insurance incidence and median coverage ratio as instruments for the D&O insurance variables. I use a sensitivity test for the D&O insurance premium and governance indexes by classifying acquirers as dictatorship versus democracy firms based on the median values of these variables. I include these new dummy variables into the regression model and test whether my results are affected.
5.2Variable construction
In the following subsections, I discuss the measurement of three categories of variables: acquirer return as my dependent variable, D&O insurance measures and corporate governance indexes as my key explanatory variables, and acquirer and deal characteristics as my control variables.
5.2.1 Acquirer return
Event study methodology is a standard in finance literature in evaluating the stock price reaction to a specific event. I measure acquirer announcement effects by market model adjusted stock returns around initial acquisition announcements. The market model assumes a linear relationship between the return of a stock and the return of the market portfolio. I obtain the announcement date from SDC’s US Mergers and Acquisitions database and compute 5-day cumulative abnormal
announcement returns (CARs).1 Next, I introduce the construction of a CAR starting from abnormal
return (AR) that is calculated as follows:
𝐴𝑏𝑛𝑜𝑟𝑚𝑎𝑙 𝑅𝑒𝑡𝑢𝑟𝑛 = 𝐴𝑐𝑡𝑢𝑎𝑙 𝑅𝑒𝑡𝑢𝑟𝑛 – 𝐸𝑥𝑝𝑒𝑐𝑡𝑒𝑑 𝑅𝑒𝑡𝑢𝑟𝑛 (2) where actual return is realized return of an acquirer around the announcement date and expected return is required return of an acquirer around the announcement date from the Capital Asset Pricing Model (CAPM) (see Sharpe, 1964). For each acquirer, the market model assumes that the returns generated are calculated as follows:
𝑅𝑖𝑡 = 𝛼𝑖 + 𝛽𝑖𝑅𝑚𝑡+ 𝜀𝑖𝑡 (3)
where 𝑅𝑖𝑡 is the return on stock i at time t. The subscript t indicates the time, the subscript i indicates a stock of an acquirer, and the subscript m indicates the market. 𝑅𝑚𝑡 is the equal-weighted return of S&P/TSX Composite Index market portfolio during period t. Under the assumption of linearity and normality of returns, 𝜀𝑖𝑡 is a random error term for stock i at time t, 𝛽𝑖 is an acquirer-specific
coefficient, to be estimated from the market model regressions. The market model expressed in Eq. (3) is used to compute the return on the stock that would have been expected during the 5-day event window around the acquisition announcement. Eq. (3) is estimated by using a 200-day estimation period from t = -11 to t = -210, where t = 0 is the acquisition announcement date.
The abnormal return (AR) due to the announcement equals the actual return minus the expected return:
𝐴𝑅𝑖𝑡 = 𝑅𝑖𝑡− (𝛼𝑖 + 𝛽𝑖𝑅𝑚𝑡) (4)
where daily ARs are computed for each day t to each acquirer i. The 5-day event window is the period between two days prior the acquisition announcement and two days after the acquisition announcement. The expected returns on the stock calculated from the Eq. (3) for the stock during the event window (-2, +2) are compared with the actual returns observed on each day within the event
1 For a random sample of 500 acquisitions from 1990 to 2000, Fuller, Netter, and Stegemoller (2002) find that the
announcement dated provided by SDC are correct for 92.6% of the sample and rest of the cases are off by no more than two trading days. Therefore, using a 5-day window over event days (-2, 2) captures close to all of the announcement effect, without introducing substantial noise to my analysis.
window. The difference between the expected return and the actual return during the event window is the CAR. It is calculated as follows:
𝐶𝐴𝑅𝑖 = ∑ 𝐴𝑅
𝑇 𝑡=1 𝑖𝑡
(5)
where ∑𝑇 𝐴𝑅
𝑡=1 𝑖𝑡 is the sum of ARs during the event window. More specifically, the CAR during the
event window is calculated as follows:
𝐶𝐴𝑅𝑖−𝐸𝑊 = ∑ 𝐴𝑅𝑖𝑡
𝑇2
𝑡=𝑇1
(6)
where EW is the event window, T1 is the beginning date of the event window, and T2 is the ending date of the event window.
5.2.2 Acquisition premiums
In the univariate analyses, I examine the effect of D&O insurance coverage on acquisition premiums to explore the potential channels through which D&O insurance variables affects acquirer returns. Following recent literature (see Datta, Iskandara-Datta, and Raman, 2001; Lin et al., 2011), I define acquisition premiums (Acquisition premium_4w) as the ratio of the offer price to the target’s stock
price four weeks prior to the initial announcement date minus one.
5.2.3 D&O insurance coverage
Following the literature (see Core, 1997; Chalmers et al., et al., 2002; Lin et al., 2011), I use two proxies for D&O insurance: (1) an indicator variable (Insurance 1/0) for whether the firm has purchased a D&O insurance policy; (2) a continuous variable (Insurance coverage ratio) defined as the personal coverage limit of the D&O insurance policy scaled by the firm’s average market value of equity in a year. According to Baker and Griffith (2007), the market value of equity is in theory a proxy for the maximum liability exposure and both D&O insurance coverage and damage award are often positively correlated with the market value of equity.2 If a firm does not purchase D&O
insurance, the continuous variable is set to zero. If a firm publishes the information that they have
2 Some firms publish their D&O insurance information in US dollars, which I convert into Canadian dollars using the
purchased D&O insurance, but does not give information on the amount of coverage, the firm can only be used as an indicator variable, not as a continuous variable.
5.2.4 D&O insurance premium
Kang and Klausner (2011) suggest that D&O insurance premium can be converted into a proxy for governance quality with a few adjustments for market capitalization, coverage limits, and industry. To account for market capitalization, I use a ratio dividing a firm’s annual D&O insurance premium by its market capitalization on the acquisition date. For the ratio to yield useful comparisons, it has to control for insurance limits. Follow Baker and Griffith (2007) and Kang and Klausner (2011), I adjust the D&O premium ratio by recalculating the premium per dollar of coverage. Furthermore, Core (2000) suggests to use a natural logarithmic transformation of the premium as it reflects the average cost of coverage to the firm, and does not affect the firm's choice of the limit. The proxy for the quality of corporate governance derived from the D&O insurance premium (Log(per dollar premium) then looks as follows:
𝐿𝑜𝑔(𝑝𝑒𝑟 𝑑𝑜𝑙𝑙𝑎𝑟 𝑝𝑟𝑒𝑚𝑖𝑢𝑚) = (𝑒𝑓𝑓𝑒𝑐𝑡𝑖𝑣𝑒 𝑐𝑜𝑣𝑒𝑟𝑎𝑔𝑒 𝑙𝑖𝑚𝑖𝑡)(𝑚𝑎𝑟𝑘𝑒𝑡 𝑐𝑎𝑝𝑖𝑡𝑎𝑙𝑖𝑧𝑎𝑡𝑖𝑜𝑛)𝑡𝑜𝑡𝑎𝑙 𝑎𝑛𝑛𝑢𝑎𝑙 𝑝𝑟𝑒𝑚𝑖𝑢𝑚 (7) This variable adjusts for coverage limits and market capitalizations. I account for industry differences by comparing the per dollar premium within 12 Fama-French industries.
5.2.5 Globe and Mail Governance Index
Globe and Mail Governance Index (GMI) is a commercial multifactor governance index developed by the Canadian newspaper, the Globe and Mail. The newspaper has rated and published boards of Canadian firms using a set of governance criteria since 2003. The index has been used by several previous studies (see e.g. Foerster and Huen, 2004; Ben-Amar and Boujenoui, 2008; Gouiaa and Zéghal, 2013).
In 2013 the ratings were based on 36 individual questions that comprised four subcategories. The Globe and Mail gathers answers to these questions from information published in the annual shareholder proxy circulars of different firms which are listed in the S&P/TSX Composite Index. The first dimension is board composition that includes 10 questions worth 31 marks out of 100. Board composition evaluates the independence of the directors serving on the board, the audit committee, the compensation committee and the remuneration committee. The second dimension is shareholding and compensation that includes 10 questions worth 28 marks out of 100. Shareholding and compensation evaluates compensation policy and detects the ownership of directors and the CEO.
The third dimension is shareholder rights that includes 8 questions worth 28 marks out of 100. Finally, the fourth dimension is disclosure that includes 8 questions worth 13 marks out of 100. Disclosure measures the level and the quality of information on corporate governance. Theoretically, the higher value of the index implies a strong governance system and an effective board complying with the rules and requirements of good governance.
5.2.6 Board Shareholder Confidence Index
Board Shareholder Confidence Index (BSCI) is an academic index, which has been developed and published since 2003 by The Clarkson Centre for Business Ethics and Board Effectiveness of the Joseph L. Rotman School of Management at the University of Toronto. It is an annual examination of the quality of governance practices related to boards of directors of publicly traded Canadian firms listed in the S&P/TSX Composite Index. The BSC Index is comprised of the factors often used by active shareholders to assess the quality of boards of directors. It seeks to capture factors affecting shareholders’ confidence in the boards’ abilities to fulfill their duties.
In 2013 the ratings were developed using criteria separated into three groups that include altogether 30 steps. The first one is individual potential that includes three subgroups and three additional subgroups that focus on the directors themselves. The second one is group potential that includes six subgroups that examine the board as a whole. Finally, the third one is board decision output that includes eight subgroups and 17 additional subgroups that analyze board outputs. Each firm begins with 100 points from which deductions are made.3 The index has been used by several previous
studies (see Beekes, Brown and Chin, 2007; Switzer and Cao, 2011; Gouiaa and Zéghal, 2013).
3 BSCI index grading system has been changed during the time period of this study: Between 2003 and 2010 they
published their grades in letters. In 2011 and 2012 letter grades and numerical grades were published concurrently with the highest numeral grade of 100. In 2013 only numerical grades were published with the highest grade of 150. Following Beekes et al. (2007), Switzer and Cao (2011), and Gouiaa and Zéghal (2013) I transformed the overall score ranging from C to AAA+ in a metric variable theoretically ranging between 20 and 100 to facilitate the analysis of the index and make scores for different years alike. Total letter grades are determined as follows: AAA+ = 100, AAA = 95, AA = 90, A = 75, B = 50, and C = <50. A higher value reflects a better quality of the board. 2013 grades are converted to reflect 100 point system.