Effects and Implications of File Size/Service Time
Correlation on Web Server Scheduling Policies
Dong Lu
∗ †Peter Dinda
∗Yi Qiao
∗Huanyuan Sheng
∗{
donglu,pdinda,y-qiao3,h-sheng
}
@northwestern.edu
∗Northwestern University
†
Ask Jeeves, Inc.
Abstract
Recently, size-based policies such as SRPT and FSP have been proposed for scheduling requests in web servers. SRPT and FSP are superior to policies that ignore request size, such as PS, in both efficiency and fairness, given heavy-tailed ser-vice times. However, a central assumption that is usually made in implementing size-based policies in a web server is that the service time of a request is strongly correlated with the size of the file it serves. By collecting web server trace data taken from the logs of modified Apache web servers, this paper re-veals that the correlation between service time and file size can be quite low, and shows how the performance of SRPT and FSP can be dramatically affected by the weak correla-tion via trace-driven simulacorrela-tions. In response, we propose and evaluate domain-based scheduling, a simple technique that better estimates connection times by making use of the source IP address of the request. Domain-based scheduling improves SRPT and FSP performance on web servers, bring-ing the performance benefits of these schedulbring-ing polices even to those regimes where the correlation between file size and service time is low.
1
Introduction
In a web server, requests continuously arrive to be serviced. A request requires a certain service time to be completed, a time whose components include the CPU, the disk, and the network path. A request is queued when it arrives and remains in the system until it is com-plete, the total time from arrival to completion being the sojourn time or response time. Scheduling policies de-termine which requests in the queue are serviced at any
Effort sponsored by the National Science Foundation under Grants ANI-0093221, ACI-0112891, ANI-0301108, 0130869, and EIA-0224449. Any opinions, findings and conclusions or recommendations expressed in this material are those of the author and do not necessarily reflect the views of the National Science Foundation (NSF).
point in time, how much time is spent on each, and what happens when a new request arrives. Common goals of the scheduling policy are to minimize the mean sojourn time (response time of the request), the average slow-down (the ratio of its response time to its size), and to behave fairly to all requests.
Many policies are possible. First Come First Served (FCFS) is a non-preemptive policy in which the requests are run to completion in the order in which they were received. A more common policy is Processor Shar-ing (PS), which is preemptive. In PS all requests in the queue are given an equal share of the web server’s atten-tion. Generalized Processor Sharing (GPS) generalizes PS with priorities. Often, FCFS can be combined with PS or GPS, with FCFS dispatching of requests from the queue to a pool of processes or threads that are collec-tively scheduled using PS or GPS. These polices ignore the service time of the request.
Recently, size-based scheduling policies, those that incorporate the service time of the request into their decisions, have been proposed for use in web servers. Harchol-Balter, et al, have proposed the use of the Short-est Remaining Processing Time (SRPT) scheduling pol-icy in web servers [8, 18], showed how to incorporate it into actual implementations [18], and proved that the performance gains of SRPT usually do not come at the expense of large jobs [8]. In other words, SRPT is fair with heavy-tailed job size distributions. Gong, et al fur-ther investigated the fairness issues of SRPT through simulation [16] and proposed two hybrid SRPT schedul-ing policies [17] to trade off the fairness with perfor-mance. The Fair Sojourn Protocol (FSP) is a modified version of SRPT that has been proven to be more ef-ficient and fair than PS given any arrival sequence and service time distribution [14].
In the implementation of size-based polices such as SRPT and FSP on a web server, the service time of the request is needed. The common assumption is that the service time is the size of the file being served, as this
is very easy to discover when the request enters the sys-tem. More broadly, the assumption is that the service time is strongly correlated to the file size. In this paper, we examine the validity of this assumption, and the im-pact that the degree of correlation between file size and service time has on the performance of SRPT and FSP.
To evaluate this impact, we developed a simulator that can support PS, SRPT, and FSP in both M/G/1/m and G/G/n/m. The simulator operates on a trace of request arrivals, which can come either from an aug-mented Apache [1] web server log, or from a trace gen-erator. The trace contains the request arrivals, the file sizes, and the actual service times in microseconds. We use traces that we have captured on our department-level web server, and traces captured by others on web caches. In our earlier work [20], we showed that for the met-rics of mean response time and slowdown, the perfor-mance of SRPT and FSP are highly dependent on the correlation (Pearson’sR[6]) between estimated and ac-tual job size, and can fall well below that of PS for lowR values. Effective job size estimators are critical to apply-ing size-based schedulapply-ing policies. This paper focuses on applying size-based scheduling in web servers when the correlationR between file size and service time is low. We first study how the performance of the file size-based policies (SRPT-FS, FSP-FS) diverges from their ideal versions (SRPT, FSP) as we increase the load on the web server. We then propose a better estimator and evaluate it via trace-driven simulations.
We study G/G/n/min addition to M/G/1/mbecause previous research [12, 26] has shown that HTTP arrivals do not form a Poisson process. HTTP document trans-missions are not entirely initiated by the user: the HTTP client will automatically generate a series of additional requests to download embedded files, thus resulting in a more bursty process. Previous work [12] pointed out that the aggregated interarrival times of HTTP requests can be modeled with a heavy-tailed Weibull distribution. There has been significant work on the G/G/n queu-ing model. However, we are aware of no analytical results on G/G/n/m for SRPT or FSP scheduling in regimes where interarrival times and service times are heavy-tailed. Therefore, the work we describe in this paper is based on measurement and simulation.
Using our infrastructure, and measured and synthe-sized trace data, we address the following questions:
1 What is the actual degree of correlation between file size and service time in practice? (Section 2)
2 What is the performance of SRPT, FSP and PS under typical real workloads? (Section 3)
3 Is there a simple and low-overhead estimator for service time that would make SRPT and FSP on M/G/1/mand
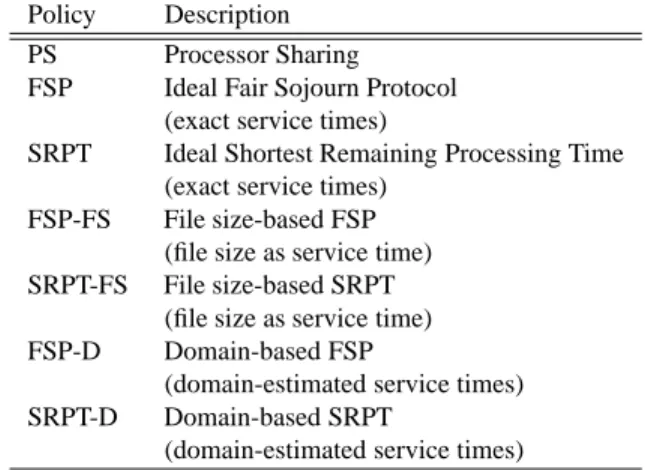
Policy Description PS Processor Sharing FSP Ideal Fair Sojourn Protocol
(exact service times)
SRPT Ideal Shortest Remaining Processing Time (exact service times)
FSP-FS File size-based FSP (file size as service time) SRPT-FS File size-based SRPT
(file size as service time) FSP-D Domain-based FSP
(domain-estimated service times) SRPT-D Domain-based SRPT
(domain-estimated service times)
Figure 1. Scheduling policies.
G/G/n/mperform better? (Section 4)
It is important to point out that our results in addressing questions 2 and 3 are largely independent of our results for question 1, and the algorithm we develop in response to question 3 provides benefits to SRPT and FSP over a wide range of possible answers to question 1.
Our definition of service time is the time needed to send all of requested data in the absence of other re-quests in the system. Our measurements show that the assumption that file size and service time are strongly correlated is unwarranted—the correlation is, in fact, of-ten rather weak. We believe that the reason for this phe-nomenon is path diversity to different clients. Even if for every specific request, the service timets=L+N/B, whereN is the number of bytes in the transfer andL andBare the latency and bandwidth of the path, every path will likely have a differentLandB. In aggregate, this will mean thattswill be weakly correlated withN. Notice that this explanation does not require that the bot-tleneck for file transfer be the network. Path diversity is simply a fact of life of a large network.
Our trace-driven simulations show that the perfor-mance of file size-based SRPT and FSP is strongly af-fected by the weak correlation between file size and ser-vice time reflected in our web server traces. In fact,R is indeed low enough that both file-size based SRPT and FSP perform worse than PS. The job size distribution, arrival process and load decide the threshold value ofR that SRPT and FSP need to outperform PS.
These results led us to believe that a better estimator for service time was needed. We refer to our estimator as a domain estimator, and the use of our domain-based estimator with a size-based scheduling policy such as SRPT or FSP as domain-based scheduling. The basic idea is to use the high orderkbits of the source IP
ad-Model Description
M/G/1/m Poisson arrival process; Single server; General service time distribution; Limited queue capacitym.
G/G/n/m General arrival process (Pareto and Weibull); General service time distribution;
nservers ; Limited queue capacitym
Figure 2. Queuing models.
dress to assign the request to one of 2k domains. For each domain, we estimate the service rate (file size di-vided by service time) based on all previous completed transfers to the domain. The service rate is then used to estimate the service time of a new request based on its file’s size. Based on our traces, there is a strong correla-tion between these estimates and the actual service times that grows with the number of bitskused. In short, by choosingkappropriately, we can create enough corre-lation to make SRPT and FSP perform well. Surpris-ingly,kcan be kept relatively small, making the imple-mentation of domain-based scheduling feasible and fast. Throughout the paper, we refer to the scheduling poli-cies as listed in Figure 1, and refer to the queuing models used as listed in Figure 2.
2
File size and service time
Size-based SRPT scheduling appeared in digital communication networks research in 1983 [10]. In this context, the service time was taken to be equal to the transmission time of a message, which is proportional to the length of the message stored in the node buffers. A web server serving static requests appears superficially similar in that it transmits files to the client. However, there are differences. First, in the digital communication network context, the work represented by the service time is pushing the bits of the message onto the wire, while for the web server context, the work involves end-to-end cooperation along an entire shared heterogeneous path. Although most transfers are likely to be dominated by the bottleneck bandwidth in the path and the latency of the path, there are multiple possible bottlenecks along the path and they can vary with time due to packet losses and congestion. Second, the disk(s), memory system(s), and CPU(s) of the web server and the client are also po-tential bottlenecks. These complexities suggest that the service time of a request may not be proportional or even well correlated with the size of the file it serves.
There are several possible definitions for service time in the web server context. For example, we could
fo-cus on a bottleneck resource on the server, such as the CPU, and define the service time as the total CPU time needed to execute the request. Alternatively, we could treat the CPU, disk, and network link of the server as a single resource and consider the total non-blocked time of a request on it. We could also take a holistic view and consider it the time spent on the bottleneck resource on the path from server to client. We take the position that the service time of a request is the time that the combi-nation of server, client, and network would take to finish the request given no other requests in the whole end-to-end system (no load on any server resource). In the following sections, we use this definition and argue that our measurement methodology measures it by verifying that the loads on the resources of the end-to-end system that we measure are miniscule.
To measure correlation between file size and ser-vice time we use the correlation coefficient (Pearson’s
R) [6]. To answer the question posed by this sec-tion, we examineRvalues for a large trace acquired by us from a typical web server, as well as 70 traces col-lected from web cache servers. The main conclusion is thatRcan vary considerably from server to server, and can be quite small. R = 0.14for our web server trace, while the web caches haveRevenly distributed in the range[0.12,0.61]. In subsequent sections, we use our web server trace to drive our simulation. However, we also use synthetically generated traces in which we can controlR directly. While many web server traces are available, none that we could find record the actual ser-vice time of the request and thus are not useful for the purposes of our study.
2.1
Measurement on a typical web server
We modified the code of the Apache log module so that it records the response time of each request with mi-crosecond granularity (using the IA32 cycle counter to measure time). Under extremely low load conditions, as we document below, this time is equivalent to the service time according to our definition above.
We deployed the module on our department-level web site. We collected data from September 15, 2003 to October 19, 2003. This trace includes approximately 1.5 million HTTP requests, among which less than 2% are dynamic PHP requests that collectively took less than 1% of the total service time recorded. > 98% of our requests and>99% of the service time in the trace are for static pages. Hence, our web server is dominated by static web content. our results are comparable to previ-ous work [21, 19, 18] that claims static content domi-nates web traffic. The requests originated from 110 “/8”
y = 0.2349e-4.1253x R2 = 0.9559 0.00001 0.0001 0.001 0.01 0.1 1 0 0.2 0.4 0.6 0.8 1 1.2 1.4 1.6 1.8 2 CPU Load P(Load>x)
Figure 3. CCDF of CPU load.
y = 0.0723e-0.0001x R2 = 0.9855 0.0000001 0.000001 0.00001 0.0001 0.001 0.01 0.1 1 0 20000 40000 60000 80000 100000
Hard disk read IO in KB/sec
P(disk read IO>x)
Figure 4. CCDF of storage read I/O.
IP networks, 7220 “/16” IP networks and 31250 “/24” IP networks spread over the world. We claim that this server is typical. However, the conclusions of this paper are also supported by other measured traces and gener-ated traces.
The bottleneck resource of a request in this trace is hardly ever the CPU of the server. The web server is a dual processor Pentium IV Xeon machine running Red Hat Linux 7.3. CPU load is defined as the exponentially averaged number of jobs in the run queue of the OS ker-nel scheduler (the Unix load average), The machine can serve two CPU intensive applications with full CPU cy-cles. Figure 3 plots the complementary distribution of the CPU load during the period of trace collection. This distribution can be modeled with a exponential distribu-tion withR2≈0.96. Figure 3 shows that the probability
P[CP U load > 2]is minuscule. The memory system
is also clearly not a bottleneck based on these results as significant cache stalls would show up as increased load. The bottleneck resource of a request in this trace is hardly ever the disk system of the server. The
ma-Read Write
Char Block WebRead Char Block 23604 1399254 29879 16777 50355
Figure 5. Storage bandwidth, KB/sec.
chine’s file systems reside on a NFS-mounted (over pri-vate gigabit Ethernet SAN) RAID 5 storage server. Fig-ure 4 shows the complementary distribution of the stor-age system reads during the period of the trace. The dis-tribution can be modeled with a exponential disdis-tribution withR2close to 0.99.
We benchmarked the storage system using Bonnie, which is a widely used utility that measures the perfor-mance of Unix file system operations that an application sees [2]. Bonnie reads and writes a 100 MB file (marked uncacheable) by character or by block. Both sequen-tial and random access are tested. Random block and character throughput give us upper and lower bounds on the performance of file system I/O that Apache sees. We also wrote our own benchmark (WebRead) to get a sense of the typical read performance that Apache sees. WebRead simply reads the files in our access log, in order, as fast as possible. Not surprisingly, the We-bRead performance is in between the character read and block read benchmark given by Bonnie. Bonnie and We-bRead measurements are shown in Figure 5. From Fig-ures 4 and 5, it is clear that in our trace encountering a read throughput exceeding the WebRead throughput
<0.001. No recorded read throughput was larger than
Bonnie’s block read benchmark. Notice also that the highest throughputs seen are lower than the 125 MB/s throughput limit of the Ethernet SAN, hence the SAN is also not a bottleneck.
As it is clear that the CPU, memory, and disk sys-tems are not bottlenecks, if there is any bottleneck it is in the network or the client. Based on many earlier mea-surements of load behavior on clients that indicate their resources spend much of their time idle [22, 13], it is ex-tremely unlikely for a client to be the bottleneck. If there is any bottleneck, it is in the network path to the client, which agrees with earlier work [24, 18] that showed that the network is the bottleneck for the web servers serving mainly static content. Given the low rate of requests, it is highly likely that a single request would perform similarly to the requests in our trace. Hence, the high-resolution response time that we record in the Apache log is a close approximation of the service time as de-fined above. Obviously, there are situations where CPU or disk can become bottlenecks, such as in virtual server configuration in which one physical server hosts several
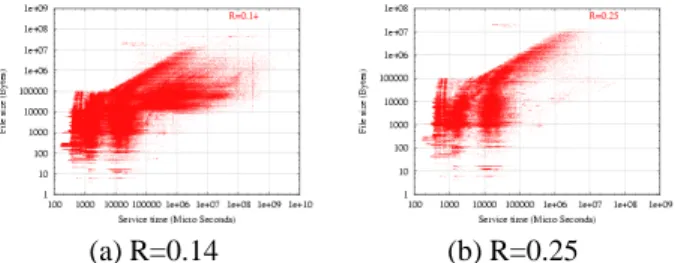
(a) R=0.14 (b) R=0.25
Figure 6. File size versus service time: (a) whole trace, (b) selected /16 network.
web sites, or on a web server that hosts database-based dynamic web content.
Given the provenance of the trace, we can now use it to answer our question. Figure 6 (a) is a log-log scatter plot of file size versus service time. Visually, we can see hardly any correlation between file size and service time. File transfer times vary over several orders of magnitude with same file size. Over the entire 1.5 million requests
in the trace, we find thatRis a very weak 0.14.
Within a domain, R is larger. We define precisely what we mean by a domain and connect it with CIDR in Section 4. Here, simply consider it as a single network that may be recursively decomposed into subnetworks. For example, Figure 6 (b) is a log-log scatter plot of file size versus service time for requests originating with a single “/16” IP network, where the network address is 16 bits. R= 0.25for this situation. As the domain grows smaller (has fewer IP addresses, or more bits represent-ing its network address),Rgrows larger. For example, if we focus on a particular “/24” LAN subnet (24 bit network address) that is contained within the previous network,R= 0.39.
We speculate that the reason for this behavior is that network bandwidth heterogeneity from the server to the clients of a domain decreases as the size of the domain decreases. This provides a different, but compatible, explanation for earlier findings [8] that file size-based SRPT scheduling can decrease mean sojourn time by a factor of 3-8 over PS in a LAN for load higher than 0.5, but can only decrease the mean sojourn time by 25% on the WAN.
We are actively acquiring additional traces, but this is difficult because web server modifications are neces-sary to acquire fine grain service times. Many avail-able traces, such as those from the Internet Traffic Archive [3], our institution’s other web servers, and oth-ers provide only file size, not service time and thus are unsuitable for our work. We have, however, acquired
many traces from web caches, described next, and built a trace generator that allows us to controlRas well as the distributions of service time and interarrival time, de-scribed later.
2.2
Measurement on web caches
We examined 70 sanitized access logs from Squid web caches, made available through the ircache site [4]. These traces contain actual fine grain service times (not response times) in addition to file sizes. Internet object caching stores frequently requested Internet objects (i.e., pages, images, and other data) on caches closer to the re-quester than to the source. Clients can then use a local cache as an HTTP proxy, reducing access time as well as bandwidth consumption.
Squid is a high-performance proxy caching server for web clients. Unlike traditional caching software, Squid handles all requests in a single, non-blocking, I/O-driven process [5], making it very easy to determine the service time of a request. Squid is similar to a web server in that it also accepts HTTP requests and sends back requested files, but it is different in that the Squid servers form a overlay network that uses the Internet Cache Proto-col (ICP) to perform server selection for web clients and load balancing among the cache servers [28]. A client sees that it typically receives a reply from the nearest cache server, while from the Squid cache servers’ points of view, the Internet is divided into several regions with each cache server serving requests for a region.
Because a single Squid cache serves clients largely from one region of the Internet, the bandwidth hetero-geneity to the clients is likely to be less than that seen by a web server, which services clients regardless of region. This, we believe, should lead to largerRbeing measured on Squid caches than on web servers. The partitioning of the network as seen from the web server into domains that we describe in Section 4 builds on this observation. While we cannot (and do not) use web cache traces as proxies for web server traces, it is instructive thatRon the caches is also rather weak. Figure 7 shows a com-plementary distribution plot of theR values in the 70 traces. The traces were collected from 10 squid web cache servers over 7 days Each trace contains from 0.1 to 1.1 million requests. The smallestR = 0.12, while the largestR = 0.61. The mean is 0.34 with standard deviation 0.13. Given that we expect that R for web servers will be lower thanRfor web caches by the rea-soning in the previous paragraph, that measuredRs on web caches are low suggests thatR on web servers is likely to be low as well.
0 0.1 0.2 0.3 0.4 0.5 0.6 0.7 0.8 0.9 1 0 0.1 0.2 0.3 0.4 0.5 0.6 0.7
Correlation Coefficient betw een file size and service tim e
P[R
>
x
]
Figure 7. CCDF ofRin web cache traces.
In combination with the low R seen on our web server trace, we believe that we can now answer the question posed by this section in the negative: The
cor-relation between request file size and service time on web servers is weak.
3
Correlation and performance
We have seen that request service time on web servers and caches is not strongly correlated with request file size. Here, we investigate, via simulation, how this weak correlation (R) affects the performance of size-based scheduling policies (SRPT and FSP, where actual ser-vice time is known a priori, and SRPT-FS and FSP-FS, where the file size is used as the service time) and com-pare with a size-oblivious policy (PS). Our metrics are the mean sojourn time (response time) and mean queue length. In our earlier work [20], we found that for these metrics the performance of non-ideal SRPT and FSP (SRPT-FS and FSP-FS here) is dramatically affected by
R, falling below that of PS for lowRvalues, such as we encountered in the previous section. Here, we show how the performance of SRPT-FS and FSP-FS diverge from the ideal as a function of the load on the web server.
3.1
Simulator
Our simulator supports both M/G/1/mand G/G/n/m
queuing systems. It is driven by a trace in which each request contains the arrival time, file size, and service time. In addition to the web server trace described in the previous section, our simulator can also support syn-thetic traces with many interarrival time and file size / service time distributions. The correlation between file size and service time in a synthetic trace can also be di-rectly controlled. More detail is available [20].
0 100000 200000 300000 400000 500000 600000 700000 800000 900000 0 0.5 1 1.5 2 Load M e a n S o jo u rn Ti me i n M ic ros e c ond s PS FSP SRPT FSP-FS SRPT-FS
Figure 8. Mean sojourn time versus load, G/G/1/m, Pareto arrivals, web server trace.
0 1000 2000 3000 4000 5000 6000 0 0.5 1 1.5 2 Load M e an Q u eu e L e n g th PS FSP SRPT FSP-FS SRPT-FS
Figure 9. Mean queue length versus load, G/G/1/m, Pareto arrivals, web server trace.
3.2
Simulation with web server trace
Here we consider the performance of SRPT, SRPT-FS, FSP, FSP-SRPT-FS, and PS on the web server trace (R=
0.14) described in Section 2.1. The mean service time is 1250 microseconds. The scheduling policies are de-scribed in Figure 1. Note that although our web server trace represents very low load, here we vary the load in the system by controlling the arrival process of the re-quests represented in the trace. We make use of Poisson arrivals, Pareto arrivals, and Weibull arrivals and control their mean rate in order to control the load. Load control is important, because, as we discussed in Section 2.1, the load captured in the trace is rather low. The time units are microseconds throughout the rest of the paper. Each simulation is repeated 20 times.
First, we consider G/G/1/m (Job interarrival has a heavy-tailed Pareto distribution, file sizes and service times as in the trace). Figure 8 shows the mean
so-journ times of different scheduling policies with increas-ing load, while Figure 9 shows the mean queue length of different scheduling policies with increasing load on the queue. In both figures, ideal SRPT and FSP perform very well and almost identically. However, SRPT-FS and FSP-FS both perform quite poorly, and their per-formance diverges dramatically from their ideal perfor-mance with increasing load. SRPT-FS and FSP-FS per-form worse than SRPT and FSP in all our simulations.
For a queue with unlimited queue capacity, the mean sojourn time and queue length tend to be infinity if the load is over unity, and therefore it is meaningless to present mean sojourn time and queue length. Our simu-lator uses a finite queue capacity to better match imple-mentations. The server will begin to reject jobs when it is overloaded for some period of time (when the queue is full). Hence, both mean sojourn time and mean queue length are meaningful; they represent the behavior of the server under transient overload.
We have also investigated a Weibull arrival process and Poisson arrival process, where the interarrival times of requests in the trace are drawn from a Weibull dis-tribution and exponential disdis-tribution respectively. The results are similar to those for the Pareto arrival process shown earlier.
Our simulations show that the performance of SRPT-FS and SRPT-FSP-SRPT-FS, SRPT and SRPT-FSP where request file size is used as request service time, is largely affected by the weak correlationR between file size and service time.
With such weak correlations as in our web server trace and some of our web cache traces, PS can actually be preferable to size-based policies. However, our previous work [20] demonstrates that even small increases inR can dramatically increase the performance of non-ideal SRPT and FSP. Hence, we turned to developing a better estimator of service time.
4
Domain-based scheduling
We have found that request file size and service time are weakly correlated and that the performance of size-based scheduling policies are strongly dependent on the degree of this correlation. Given these results, a natural question is whether there is a better service time estima-tor than file size, one whose estimates are more strongly correlated with actual service time. Such an estimator must also be lightweight, requiring little work per re-quest. For this reason, we cannot use active probing techniques. Instead, we explore the web logs and use past web requests as our probes.
4.1
Statistical stability of the Internet
Domain-based scheduling relies on the Internet being statistically stable over periods of time, particularly from the point of view of the web server. Fortunately, there is significant evidence that this is the case.
Routing stability: Paxson [25] proposed two metrics
for route stability, prevalence and persistency. Preva-lence, which is of particular interest to us here, is the probability of observing a given route over time. If a route is prevalent, then the observation of it allows us to predict that it will be used again. Persistency is the frequency of route changes. The two metrics are not closely correlated. Paxson’s conclusions are that Inter-net paths are heavily dominated by a single route, but that the time periods over which routes persist show wide variation, ranging from seconds to days. However, 2/3 of the Internet paths Paxson studied had routes that persisted for days to weeks. Chinoy found that route changes tend to concentrate at the edges of the network, not in its “backbone” [11]. Barford, et al measured the web performance in the wide area network and found that the routes from/to the client to/from a web servers was asymmetric, but very stable [9].
Spatial and temporal locality of end-to-end TCP throughput: Balakrishnan, et al analyzed statistical
models for the observed end-to-end network perfor-mance based on extensive packet-level traces collected from the primary web site for the Atlanta Summer Olympic Games in 1996. They concluded that nearby Internet hosts often have almost identical distributions of observed throughput. Although the size of the clus-ters for which the performance is identical varies as a function of their location on the Internet, cluster sizes in the range of 2 to 4 hops work well for many regions. They also found that end-to-end throughput to hosts of-ten varied by less than a factor of two over timescales on the order of many tens of minutes, and that the through-put was piecewise stationary over timescales of similar magnitude [7]. Seshan, et al applied these findings in the development of the Shared Passive Network Perfor-mance Discovery (SPAND) system [27]. Myers, et al examined performance from a wide range of clients to a wide range of servers and found that bandwidth to the servers and server rankings from the point of view of a client were remarkably stable over time [23]. Yin Zhang, et al [29] found that three Internet path proper-ties, loss rate, delay and TCP throughput show various degrees of constancy and concluded that one can gener-ally count on constancy on the time scale of minutes.
4.2
Algorithm
Although the Internet, web servers, and clients form a highly dynamic system, the stability we pointed out in the previous section suggests that previous web requests (the web server’s access log) are a rich history which can be used to better estimate the service time of a new request. We assume that after processing a request we know (1) its file size, (2) the actual service time, and (3) the IP address of the client. Collecting this information is simple and efficient. Our goal is to develop an efficient estimator that uses a history of such requests, combined with the file size and IP address of the current request to determine the likely service time of the current request. The correlationR between the estimated service time and the actual service time should be higher than the correlation between file size and actual service time. R must exceed a threshold in order for SRPT to perform better than PS, and asRincreases, the performance of SRPT increases.
Classless Inter Domain Routing (CIDR) [15] was proposed in 1993 as “a strategy for address assignment of the existing IP address space with a view to conserve the address space and stem the explosive growth of rout-ing tables in default-route-free routers”. The CIDR strat-egy has been widely deployed since 1993. “One major goal of the CIDR addressing plan is to allocate Internet address space in such a manner as to allow aggregation of routing information along topological lines”. Con-sider a domain, a neighborhood in the network topol-ogy. The broad use of CIDR implies that routes from machines in the domain to a server outside the domain will share many hops. Similarly, the routes from the server to different machines in the domain will also have considerable overlap. This also means that the routes will be likely to share the same bottleneck network link and therefore have similar throughput to/from the server. The smaller the domain, the more the sharing.
The aggregation of CIDR is along a hierarchy of increasingly larger networks and is reflected in IP ad-dresses. The firstkbits of an IP address gives the net-work of which the address is a part, the firstk−1bits give the broader network that contains the first network, and so on. We exploit this hierarchy in domain-based scheduling, the algorithm of which is given below.
1 Use the high orderkbits of the client IP address to classify the clients into2kdomains, where thekbits are treated as the domain address.
2 Aggregate past requests to estimate the service rate (or representative bandwidth) for each domain. This can be done with several estimators, but our experiments show that the estimatorSR=FSst performs the best. HereSR
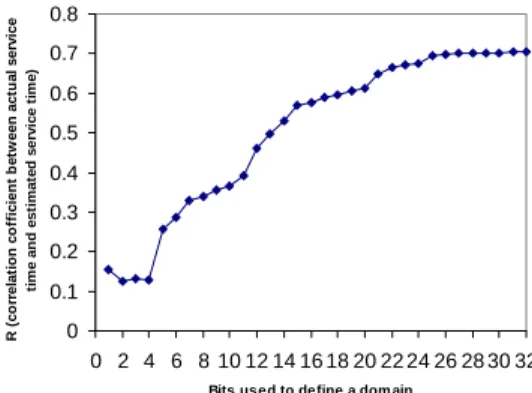
0 0.1 0.2 0.3 0.4 0.5 0.6 0.7 0.8 0 2 4 6 8 10 12 14 16 18 20 22 24 26 28 30 32
Bits used to define a dom ain
R ( c o rr e la ti o n co ff ici e n t b e tw ee n a c tu al se rv ic e ti me a n d e s ti m a te d s e rv ic e ti me )
Figure 10.Rversus bitskdefining domain.
is the representative service rate,Fsis the sum of the requested file sizes from the domain, andStis the sum of the service times for these requests. Notice that updating this estimate after a request has been processed is trivial: simply add the request’s file size and service time toFsandSt, respectively (two reads, two adds, two writes). For each domain, we storeFsandSt. An array of these pairs is kept, indexed by the domain address. The total state size is2k+1floating point numbers.
3 For each incoming client request, the web server first extracts the domain address, indexes the array and computesSRfor the domain. It then estimates the request’s service time asTestimate= fs
SR, wherefsis the request file size. The estimator requires a logical shift, two reads, a division, and a multiply. For a request from a heretofore unobserved domain, which occurs exactly once per domain, we simply use file size as the estimate.
4 Apply a size-based scheduling policy such as SRPT using the estimated service times. We suffix the scheduling policy with “-D”: SRPT-D, FSP-D.
As we might expect, as domains become smaller (k gets larger), predictive performance increases, at the cost of memory to store the state. Figure 10 shows the rela-tionship betweenk, the number of bits used to define a domain and the correlationRbetween the actual service time and estimated service time. The figure is derived from our web server trace. Rjumps to 0.26 withk = 5
bits, beyond the threshold at which SRPT begins to per-form better than PS. Notice that this is a mere 32 do-mains (state size of 256 bytes with 4 byte floats). After
k = 24bits, there are only very small increases ofR, probably because at this point we have divided the In-ternet into LANs, where each machine on a LAN shares a common route to every other machine in the Internet, and thus shares the same bottlenecks. The maximumR
0 100000 200000 300000 400000 500000 600000 700000 800000 900000 0 2 4 6 8 10 12 14 16 18 20 22 24 26 28 30 32
Bits Used to define a Dom ain
M e a n S o jo ur n T ime PS FSP SRPT FSP-FS SRPT-FS FSP-D SRPT-D
Figure 11. Mean sojourn time versuskfor web trace, G/G/1/m, Pareto arrivals with
α= 1.32and bounds[84,5×10⁵], load 0.88.
we were able to achieve was 0.704.
4.3
Performance evaluation
To evaluate domain-based scheduling (SRPT-D and FSP-D, also see Figure 1), we use the methodology of Section 3.2. We replay our web trace with Poisson, Pareto, and Weibull arrivals to control load. We varyk, the number of high-order bits we use to define a domain. Figures 11 and 12 show the mean sojourn time and mean queue length of all the scheduling policies with heavy-tailed Pareto arrivals as a function ofk. Notice that PS, FSP, SRPT, FSP-FS, and SRPT-FS are flat lines. PS ignores service time. FSP and SRPT have exact knowledge of the service times (they represent the ideal performance of these policies). FSP-FS and SRPT-FS use file size as a proxy for service time (representing current practice). Notice that as we increase the number of bits k used to define a domain, the performance of SRPT-D and FSP-D first exceeds that of PS and finally converges to near the ideal performance.
While SRPT-D’s performance increases continu-ously, with diminishing returns, with increasingk, FSP-D is rather insensitive untilk = 16to24bits, at which point its performance jumps dramatically and comes very close to SRPT-D’s. SinceRdoesn’t increase much beyondk = 24 bits, as we might expect, the perfor-mance of SRPT-D and FSP-D plateaus. Similar conclu-sions can be drown for Poisson arrivals and Heavy-tailed Weibull arrivals.
Our performance evaluation of SRPT-D and FSP-D demonstrates that better, practical estimators of service time are possible and that they can dramatically im-prove the performance of size-based scheduling policies
0 500 1000 1500 2000 2500 3000 0 5 10 15 20 25 30 35
Bits used to define a dom ain
Me an Q u eu e L e n g th PS FSP SRPT FSP-FS SRPT-FS FSP-D SRPT-D
Figure 12. Mean queue length versuskfor web trace, G/G/1/m, Pareto arrivals with
α= 1.32and bounds[84,5×10⁵], load 0.88.
on web servers.
5
Conclusions and future work
This paper has made the following contributions. First, we have (1) demonstrated that the assumption that file size is a good indicator of service time for web servers is unwarranted. File size and service time are only weakly correlated. The implication is that size-based scheduling policies that use file size, such as SRPT-FS and FSP-FS are likely to perform worse than expected. Next, using simulations driven by our web server trace, we have (2) evaluated the performance of SRPT-FS and FSP-FS and found that their performance does indeed degrade dramatically due to the weak cor-relation reflected in the trace. In response, we (3) pro-posed, implemented, and evaluated a better service time estimator that makes use of the hierarchical nature of routing on the Internet and the history of past requests available on the web server. We refer to SRPT and FSP augmented with our domain-based estimator as SRPT-D and FSP-D. The state size of our estimator is a param-eter. Finally, we (4) found that, with a small state size, SRPT-D can outperform PS, and with a practical state size, SRPT-D can exhibit close to ideal performance. FSP-D requires a significantly larger state size to per-form close to its ideal. SRPT reacts very quickly to in-creasingly accurate service time estimates.
Because the TCP connection (and disk) that a request uses can block, implementations of size-based schedul-ing in web servers often use what we call back-fillschedul-ing. An executing request that becomes blocked is preempted in favor of a request with a larger number of bytes re-maining to be handled—it is the non-blocked request
of smallest remaining size that is run, not the smallest request. Our simulations do not model such a system. However, as far as we are aware, there are no analytical results for size-based scheduling with blocking behavior either, making it quite difficult to validate a simulator.
References
[1] The apache software foundation. http://www.apache.org/.
[2] Bonnie, a unix file system benchmark. http://www.textuality.com/bonnie/.
[3] The internet traffic archive. http://ita.ee.lbl.gov/. [4] The ircache project. http://www.ircache.net/.
[5] The squid web proxy cache project. http://www.squid-cache.org/.
[6] ALLEN, A. O. Probability, statistics, and queueing
the-ory with computer science applications. Academic press,
Inc., 1990.
[7] BALAKRISHNAN, H., SESHAN, S., STEMM, M., AND
KATZ, R. H. Analyzing Stability in Wide-Area Net-work Performance. In Proceedings of ACM
SIGMET-RICS (June 1997), pp. 2–12.
[8] BANSAL, N.,ANDHARCHOL-BALTER, M. Analysis of SRPT scheduling: investigating unfairness. In
Proceed-ings of SIGMETRICS/Performance (2001), pp. 279–290.
[9] BARFORD, P.,AND CROVELLA, M. Measuring web performance in the wide area. Performance Evaluation
Review 27, 2 (1999), 37–48.
[10] BUX, W. Analysis of a local-area bus system with con-trolled access. IEEE Transactions on Computers 32, 8 (1983), 760–763.
[11] CHINOY, B. Dynamics of internet routing information. In Proceedings of SIGCOMM (1993), pp. 45–52. [12] DENG, S. Empirical model of WWW document arivals
at access links. In Proceedings of the IEEE International
Conference on Communication (June 1996), pp. 1797–
1802.
[13] DINDA, P.,ANDO’HALLARON, D. An evaluation of linear models for host load prediction. In 8th IEEE
Inter-national Symposium on High Performance Distributed Computing (HPDC-8) (1999), pp. 87–96.
[14] FRIEDMAN, E. J.,ANDHENDERSON, S. G. Fairness and efficiency in web server protocols. In Proceedings of
SIGMETRICS/Performance (2003), pp. 229–237.
[15] FULLER, V., LI, T., YU, J., AND VARADHAN, K. (rfc1519) Classless Inter-Domain Routing (CIDR): an address assignment and aggregation strategy, September 1993.
[16] GONG, M., AND WILLIAMSON, C. Quantifying the properties of srpt scheduling. In Proceedings of IEEE
MASCOTS (2003), pp. 126–135.
[17] GONG, M.,ANDWILLIAMSON, C. Simulation evalua-tion of hybrid srpt scheduling policies. In Proceedings of
IEEE MASCOTS (2004), pp. 355–363.
[18] HARCHOL-BALTER, M., SCHROEDER, B., BANSAL, N.,ANDAGRAWAL, M. Size-based scheduling to im-prove web performance. ACM Transactions on
Com-puter Systems (TOCS) 21, 2 (May 2003), 207–233.
[19] KRISHNAMURTHY, B., ANDREXFORD, J. Web
Pro-tocols and Practice: HTTP1.1, Networking ProPro-tocols, Caching, and Traffic Measurements. Addison-Wesley,
2001.
[20] LU, D., SHENG, H., AND DINDA, P. Size-based scheduling policies with inaccurate scheduling informa-tion. In Proceedings of IEEE MASCOTS (2004), pp. 31– 38.
[21] MANLEY, S.,ANDSELTZER, M. Web Facts and Fan-tasy. In Proceedings of the 1997 Usenix Symposium
on Internet Technologies and Systems (USITS97)
(Mon-terey, CA, 1997), pp. 125–134.
[22] MUTKA, M. W.,ANDLIVNY, M. The available capac-ity of a privately owned workstation environment.
Per-formance Evaluation 12, 4 (July 1991), 269–284.
[23] MYERS, A., DINDA, P. A.,ANDZHANG, H. Perfor-mance characteristics of mirror servers on the internet. In
Proceedings of IEEE INFOCOM (1999), pp. 304–312.
[24] PADMANABHAN, V. N.,ANDSRIPANIDKULCHAI, K. The case for cooperative networking. In IPTPS (2002), pp. 178–190.
[25] PAXSON, V. End-to-end routing behavior in the Inter-net. In Proceedings of the ACM SIGCOMM (New York, August 1996), ACM Press, pp. 25–38.
[26] PAXSON, V., ANDFLOYD, S. Wide area traffic: the failure of Poisson modeling. IEEE/ACM Transactions
on Networking 3, 3 (1995), 226–244.
[27] SESHAN, S., STEMM, M.,ANDKATZ, R. H. SPAND: Shared passive network performance discovery. In
Pro-ceedings of the USENIX Symposium on Internet Tech-nologies and Systems (1997), pp. 135–146.
[28] WESSELS, D.,ANDCLAFFY, K. ICP and the Squid Web cache. IEEE Journal on Selected Areas in
Communica-tion 16, 3 (1998), 345–357.
[29] ZHANG, Y., DU, N., PAXSON, V.,ANDSHENKER, S. On the constancy of internet path properties. In
Pro-ceedings of the ACM SIGCOMM Internet Measurement Workshop (2001), pp. 197–211.


![Figure 11. Mean sojourn time versus k for web trace, G/G/1/ m , Pareto arrivals with α = 1.32 and bounds [84, 5 × 10 5 ], load 0.88.](https://thumb-us.123doks.com/thumbv2/123dok_us/21738.2502800/9.918.489.800.102.305/figure-mean-sojourn-versus-trace-pareto-arrivals-bounds.webp)