Temi di Discussione
(Working Papers)
The interbank market after August 2007:
what has changed and why?
by Paolo Angelini, Andrea Nobili and Maria Cristina Picillo
(Working papers)
The interbank market after August 2007:
what has changed and why?
by Paolo Angelini, Andrea Nobili and Maria Cristina Picillo
economists with the aim of stimulating comments and suggestions.
The views expressed in the articles are those of the authors and do not involve the responsibility of the Bank.
Editorial Board: Alfonso Rosolia, Marcello Pericoli, Ugo Albertazzi, Daniela Marconi, Andrea Neri, Giulio Nicoletti, Paolo Pinotti, Marzia Romanelli, Enrico Sette, Fabrizio Venditti.
THE INTERBANK MARKET AFTER AUGUST 2007: WHAT HAS CHANGED, AND WHY?
Paolo Angelini*, Andrea Nobili* and Cristina Picillo**
Abstract
The outbreak of the financial crisis coincided with a sharp increase of worldwide interbank interest rates. We analyze the micro and macroeconomic determinants of this phenomenon, finding that before August 2007 interbank rates were insensitive to borrower characteristics, whereas afterwards they became reactive to borrowers’ creditworthiness. At the same time, conditions for large borrowers became relatively more favorable, both before and after the failure of Lehman Brothers. This suggests that banks have become more discerning in their lending, a welcome change, but that moral hazard considerations related to the ”too big to fail” argument should remain a main concern for central banks.
JEL Classification: E43, E52.
Keywords: interbank markets; spreads; financial crisis.
Contents
1. Introduction... 5
2. Data... 9
3. A preliminary look at the data ... 12
4. Regression analysis: basic specification and methodological issues... 14
5. Main regression results ... 16
5.1 The pre-crisis period ... 17
5.2 The crisis period, pre-Lehman... 19
5.3 The post-Lehman period... 23
5.4 Accounting for the soaring spread... 24
6. Robustness checks ... 26
7. Conclusions... 29
References ... 32
Figures and tables ... 34
Appendix ... 40
___________________
* Bank of Italy, Economic Outlook and Monetary Policy Department ** Bank of Italy, Market and Payment System Oversight Department
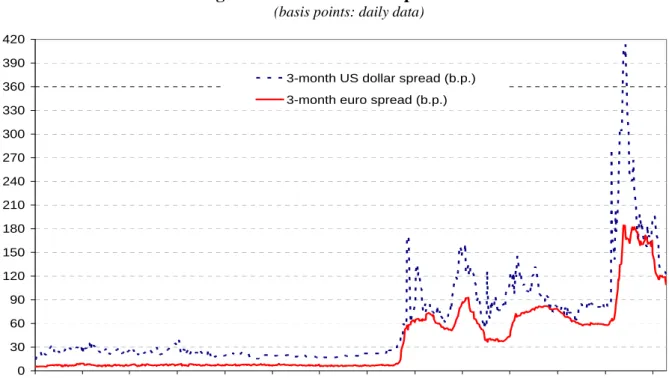
Since the summer of 2007 the world macroeconomic scenario has been dominated by the US sub-prime mortgage crisis and its repercussions on global financial markets and economic growth. The crisis resulted in higher risk premia worldwide and a large fall in share and bond prices. In money markets, interbank interest rates (the rates at which banks lend to each other) rose sharply for all the major currencies. In particular, spreads between interest rates on unsecured and secured deposits, which had been low and stable for several years, recorded an unprecedented rise (figure 1). A further, strong increase took place in mid September 2008, when the default of Lehman Brothers hit the markets.
Interbank rates are important from a macroeconomic viewpoint essentially because they represent the marginal cost of funding for banks. Thus, their variations are rapidly transmitted to the entire term structure, affecting borrowing conditions for households and firms. Furthermore, they underlie many important derivatives markets (e.g. the futures on 3-month rates on the main currencies). In short, interbank rates are a key part of the monetary policy transmission mechanism, and under normal circumstances are determined almost one-to-one by the monetary policy stance. This helps explain why central banks worldwide have been so concerned about the latest developments. In the attempt to restore orderly conditions in money markets, they have strived to provide adequate liquidity to the intermediaries, employing traditional instruments as well as new ones. Government interventions have become widespread too since the onset of the crisis. Most commentators agree that these attempts have been broadly successful and have prevented knock-on effects to other financial markets and operators. However, interbank spreads still remain well above the levels prevailing before the outbreak of the crisis.1
The purpose of the present paper is twofold. First, we investigate the causes of the increase in the spread. Taylor and Williams (2009) argue that its main driver was that
1
Indeed, the values of the spread seen since August 2007 are unprecedented even in comparison with previous periods of financial distress. Furfine (2002) shows that in the fall of 1998, characterized by the Russia’s default on its sovereign bonds and by the collapse of the hedge fund Long-Term Capital Management, the US federal funds market remained functional and risk premia were largely unaffected.
banks require a large premium to lend funds, and that the reduction in market and/or funding liquidity was not a main determinant; also, the exceptional refinancing operations conducted by the Federal reserve during the crisis did not cause a sizeable decline in the spread. Using a unique dataset which matches information on individual interbank transactions with key characteristics of the sellers and buyers of funds, we are able to corroborate this initial diagnosis and to provide new evidence on the phenomenon, studying the cross-sectional dispersion of the rates and its determinants. What share of the soaring spread is due to increased bank-specific default risk (the quantity of risk), and what to a generalized surge in risk aversion (the price of risk)? In the light of the “Too Big To Fail” debate, is the increase in the spread related to banks’ size? Did the actual default of a TBTF institution, Lehman Brothers, change the answer to the previous question, and if so, how? Finally, what is the role of accounting practices (an effect mentioned but not quantified by Taylor and Williams (2009))?
Our second, strictly related, purpose is to test predictions from various theories of the interbank market during a crisis. According to Flannery (1996), in a crisis lenders become more uncertain about their own skills in assessing borrowers’ creditworthiness, and about those of the other lenders. This gives rise to a non diversifiable risk, which can drive the interest rate up even if the creditworthiness of the average borrower does not deteriorate. By contrast, in Heider, Hoerova and Holthausen (2009) the increase of interbank rates in a crisis is due to adverse selection, which drives good risks out of the market and destroys the full participation equilibrium. Our dataset allows us to explore whether these factors contributed to the widening spread. Dudley (2008) suggests that during the current crisis banks with tight capital were forced to curtail interbank lending to avoid excessive leverage, whereas according to Acharya, Gromb and Yorulmazer (2008), banks with free capital/excess liquidity might be tempted to adopt a "predatory behaviour", rationing illiquid banks in the hope to acquire them at low prices once the liquidity crisis has evolved into insolvency.2 These two views yield opposite predictions concerning the relationship between lender’s liquidity/capitalization and the lending rate: negative in the former case, non-negative in the latter. Once more, our dataset allows us to test these implications.
2
Both Flannery (1996) and Acharya, Gromb and Yorulmazer (2008) provide a rationale for discount window lending by the central bank. In the former paper, central bank intervention acts as a device to curb the market power of “strong” banks in crisis situations.
Our results also shed light on the debate on the role and usefulness of the interbank market. Calomiris (1999) argues that a powerful element of discipline and stability of the financial system can be introduced by getting banks to monitor other banks. He suggests that banks be required to issue subordinated debt, to foster monitoring by holders (which should be financial institutions). In principle, the interbank market should be an alternative mechanism to implement market discipline: as interbank claims are generally unsecured (unlike retail deposits, typically covered by deposit insurance schemes), banks should have a strong incentive to monitor their counterparts. This intuition is formalized in the theoretical setup by Calomiris and Kahn (1991), where financiers monitor banks and roll over funding to good ones, but force liquidation of bad ones, thereby exerting welfare-enhancing market discipline.
However, other theoretical research suggests the existence of a “dark side” of wholesale funding, in which the incentives for banks to monitor their counterparts may be low. Huang and Ratnovski (2008) extend the framework by Calomiris and Khan (1991) to include a costless but noisy public signal on counterparts’ solvency (such as market prices and credit ratings for traded assets). They show that this simple modification of the setup is sufficient to lower financiers’ monitoring efforts and gives them excess incentives to withdraw funding, thus triggering inefficient liquidations. Rochet and Tirole (1996) point out a different mechanism undermining the ability of the wholesale market to impose market discipline, vividly illustrated by the following passage:
” … the current system of interbank linkages suffers from its hybrid nature: On one hand, banks engage in largely decentralized mutual lending. On the other hand, government intervention, voluntary or involuntary, destroys the very benefit of a decentralized system, namely, peer monitoring among banks” (p. 735).
In a nutshell, the inability by the central bank to commit not to rescue a defaulting bank may dilute or entirely eliminate all incentives for its lending counterparties to exert costly monitoring effort. If this is the case, then one might do away with the interbank market altogether, as suggested by Rochet and Tirole (1996) themselves, Goodfriend (2002), Martin and McAndrews (2007).
The only piece of empirical evidence on banks’ screening and monitoring activity in the interbank market that we are aware of is Furfine (2001).3 He finds that banks do monitor their interbank market counterparts in normal circumstances, charging higher rates to riskier borrowers. We shall see that our results provide mixed evidence on the issue: prior to the onset of the current crisis, banks did not differentiate lending conditions based on borrower’s creditworthiness, but they began to do so afterwards.
Following Taylor and Williams (2009), we focus on the spreads between uncollateralized and collateralized rates to eliminate the direct effects of central bank policy moves – expected or actual changes in official rates, or in the supply of central
bank money – as these factors should in principle affect both types of rates.4 Our
empirical approach is very simple. Spreads (derived from individual transactions) are regressed on a set of bank-specific and market-wide explanatory variables. We allow for the possibility of a structural break in the estimated relationships after August 9, 2007, as banks may have suddenly realized that the lending practices heretofore prevailing in the market were no longer adequate – indeed, our results strongly support the hypothesis of a radical change in the reactivity of the spreads to their determinants after that date.
Our main data source is the e-MID, a screen-based trading facility used by Italian
and other European banks to exchange interbank funds. e-MID data comprise
information on individual interbank contracts in euro, at various maturities. Merging these data with key bank characteristics allows us to control for borrower- and lender-specific features, as well as market-wide effects. To our knowledge, a dataset with similar features has been built and used by Furfine (1999, 2000, 2001) for the US federal funds market, and in subsequent papers, but only for the overnight segment. By contrast, we are able to do a similar matching for longer term maturities, those at the center of the current policy debate.
3
See the references in Furfine (2001) for complementary evidence on other segments of wholesale markets, such as that of CDs, or subordinated debt.
4
Indeed, the behavior of the spreads in figure 1 is very similar for both dollar and euro rates, in spite of the fact that between August 2007 and the end of our sample period (May 2008) the Federal Reserve has lowered its target rate from 5.25 to 2.0, whereas the European Central Bank has left it unchanged.
Besides those mentioned above, only few papers have focused on the recent widening of interbank spreads and its determinants, due to the novelty of the phenomenon. Michaud and Upper (2008), Gyntelberg and Wooldridge (2008) suggest that both credit risk and liquidity factors have played a significant role. Cassola et al. (2008) present a rich analysis of the impact of the crisis on the euro area overnight market, documenting an increase in the cross-sectional dispersion of the interest rates and a decline in cross-border trades. Overall, they interpret their findings as reflecting increased asymmetric information problems. Our paper is also related to the rapidly growing literature on the impact of the crisis on the functioning of financial markets (e.g. Frank, González-Hermosillo and Hesse (2008)) and on central banks reaction to the crisis (e.g. Chailloux et al. (2008)).
The rest of the paper is structured as follows. Section 2 describes the data sources and some choices made for the construction of the dataset. Section 3 illustrates some key features of the data using tables and figures. Section 4 discusses a few non standard methodological choices made for the regression analysis; the main results are in section 5, and a series of related robustness checks in section 6. The final section summarizes the main results.
2. Data
Our main data source is the e-MID, a multilateral screen-based trading facility on which Italian and other European banks exchange electronically interbank deposits with various maturities. The data, collected by the Bank of Italy for supervisory reasons, consists of all the euro-denominated transactions executed on the platform between January 25, 2005 and December 31, 2008. Within the crisis period, we separate the subperiods August 9, 2007 - September 14, 2008, and September 15 - December 31, 2008, to control for the effect of the failure of Lehman brothers. In what follows, for brevity we refer to this period as the post-Lehman period.
The e-MID represents the only readily available source of micro data on interbank transactions in the euro area - most other transactions of the species are conducted over the counter. Another important advantage of the e-MID is that interest rates reflect actual transactions, and therefore they do not suffer from the potential distortions affecting offered rates, such as Libor or Euribor rates - another issue that has stirred
some debate recently (see e.g. Dolan (2008)). At the same time, e-MID rates track closely their better-known counterparts, as banks can arbitrage between the e-MID and the over-the-counter market. This allows us to make inference on the euro area interbank market by and large.
Market participant initiate a trade by posting a bid or an ask proposal on the system (a quantity and a rate) for any available maturity. A bid proposals is a request of funds by a borrower, an ask one is an offer of funds by a lender. The displayed quote, which shows the proponents’ identity, can be accepted by a counterparty for the entire quantity posted or for part of it.5 Bid contracts represent about 80 per cent of the traded volumes on the platform for the overnight trades and about 60 per cent for those at longer maturities.
While most of the activity on the e-MID is at very short maturities (overnight, tom-next and spot-next), we focus on longer-term contracts, because it is on these maturities that the spread has significantly increased since August 2007. Contracts are
traded on the e-MID for maturities of 1, 2 and 3 weeks, 1, 2, 3 .. 12 months. We
compute the interest rate spread as the difference between each individual rate and the
Eurepo rate of the corresponding maturity.6 Table 1 shows that, on average, 23
participants have been active every day in the markets for maturities of 1-week or beyond, accounting for 21 contracts, altogether worth 0.7 billion euro. The small decline recorded by these indicators during the crisis does not seem to have drastically changed this situation. Altogether, the e-MID market for longer maturities is very thin. This could be because the entire euro area market for longer maturities (including over
the counter transactions) is small, or because the e-MID has a small share in this
5
See Beaupain and Durrè (2008) for a detailed microanalysis of the e-MID and a description of its features. The proponent-lender has to confirm each incoming application of its quotation and can reject them for exceeding bilateral credit limits towards the participant asking for funds. Since these limits can be set by the lender on a totally discretionary basis, at a daily frequency, the proponent-lender can de facto choose the borrower. This explains why in the empirical analysis that follows we fail to detect significant differences in the behavior of bid- and ask- generated rates.
6
Eurepos are repurchase agreements on high quality government or government-guaranteed paper. Since Eurepo rates at intermediate maturities (four, five, seven, eight, ten and eleven months) are not available, we compute a linear interpolation. This procedure has no relevant effect on our results, also because it concerns only 1 per cent of the total number of contracts. OIS (Overnight Indexed Swap) rates have also been used to compute the interbank spread (see e.g. Taylor and Williams (2009)). We rely on Eurepo rates for our baseline results because the related time series start at an earlier date, allowing us to extend the pre-crisis estimation period. Results obtained with OIS rates are briefly discussed in the robustness checks section.
market. We are unable to discriminate between these two explanations, because data on over the counter transaction volumes are unavailable to us.
For data concerning banks’ individual characteristics we rely on several sources. Balance sheet data are taken from the Bank of Italy supervisory reports.7 Our baseline results are derived using quarterly data for individual institutions, merged with the daily dataset with a one-quarter lag to account for publication delay. For instance, daily market data for 2006.Q1 are merged with 2005.Q4 balance sheet data. Robustness checks were also conducted on quarterly balance sheet data at the group level, or annual balance sheet data at the bank level taken from Bankscope (the latter allow us to keep foreign banks into the analysis). We briefly describe the related results in section 6. Rating variables by leading rating agencies (Fitch, Moody's and Standard & Poor's) are taken from Bloomberg. These data have a daily frequency, so that ratings changes are recorded and attributed exactly to the day in which they are released. Table A1 in the Appendix reports details for the available rating types and the numerical coding that we used to construct the related regressors. In short, we assign a 1 to the best rating class, and increasing integer values to the lower classes, so that lower ratings correspond to higher values of our rating measures. No rating of any type is available for 60 of the 197 market participants in our sample. Of these, 13 belong to a group in which the controlling company is rated, so we assign them the rating of the latter. Over our
sample period, 7 bank mergers and acquisitions were recorded, involving 14 e-MID
participants. The two banks involved in each operation were considered as separate entities until the effective date of the operation, and as a new, single one afterwards, even if in 6 cases the two treasury desks continued to operate on the e-MID separately for a short period after the merger. Also, contracts signed by branches of institutions are attributed to the home company.
Finally, we use a limited set of aggregate time series, mostly macroeconomic indicators, which will be briefly described in what follows.
7
Since lack of quarterly data for foreign e-MID participants forces us to omit them from the regressions, we also worked with annual balance sheet data taken from Bankscope; we describe the results in the section documenting the robustness checks.
3. A preliminary look at the data
Figure 2 shows the time series behavior of e-MID - Eurepo spreads at key maturities, in comparison with those computed using Euribor rates. The e-MID series are simple daily averages of rates on individual transaction. Although at times divergences appear, overall the e-MID rates closely track their Euribor counterparts. A marked widening of the spreads since August 2007 is clearly visible for all the series, roughly proportional
to the maturity.8 The dispersion of the rates in the cross-section of banks has
significantly increased since the onset of the crisis. This is documented by the kernel probability densities in figure 3, estimated for the differential between e-MID rates on individual transactions and the Eurepo rate of the corresponding maturity. For instance, at the 1-month maturity the standard deviation jumps from 2 basis points over the pre-crisis period to 22 points (excluding the post-Lehman period). For 3-month contracts the increase is from 2 to 15 basis points. The post-Lehman period is characterized by a further increase in the average spread and in the cross-section dispersion, as shown by the densities to the right in each panel.
To focus on the genuine cross-sectional variability of the spread, the data used in figure 3 were regressed on a set of daily dummies, one maturity at the time. The densities were then re-estimated using the residuals from the regressions, thereby eliminating the time series variability of the spread documented in figure 2. The results, in figure 4, suggest that only a limited portion of the increased variability detected in figure 3 is due to genuine cross-sectional dispersion of borrowing conditions across market participants: over the crisis period (excluding the post-Lehman sub-sample) the standard deviation of 1-month spreads is now 5 basis points, vs. 22 in figure 3; for the 3-month spread it is 4 points, vs. 15.
Summing up, the comparison of figures 3 and 4 show that the increased variability of interest rates spreads since the onset of the crisis is mostly due to aggregate factors; at the same time, a substantial portion reflects an increase in genuine cross-sectional dispersion, suggesting that bank-specific characteristics may have played a more important role since August 2007.
8
The overnight spread (the differential between the overnight and the minimum rate on the main refinancing operations of the EBC, not reported in the figure) is an exception: it was positive before
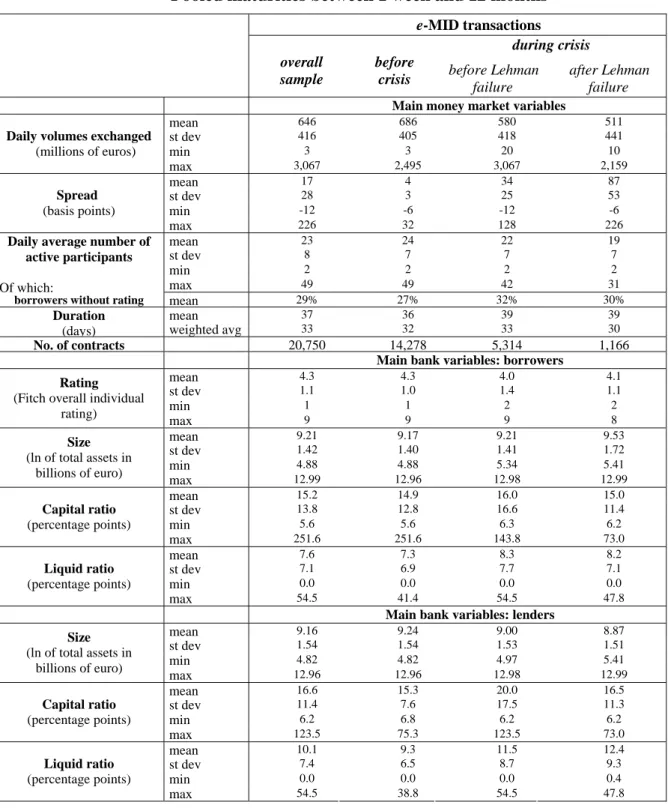
What explains these patterns? Some initial answers are provided by Table 1, which reports statistics for the pooled contracts on maturities from 1 week to 12
months.9 This methodological choice helps overcome the market thinness problem
discussed in section 2; we also adopt it in the regression analysis presented in the next section. The daily average volume of transactions was 686 million euros before the outbreak of the crisis. It declined somewhat afterwards, to 580 million during the first stage of the crisis, and to 511 in the post-Lehman period. The decline recorded by the average number of daily participants is more modest: it was 24 before August 2007, 22 between that date and September 2008, and 19 in the post-Lehman months. These declines are significant, but do not support the popular hypothesis of a breakdown of the interbank market during the crisis, or even after the Lehman default.10 The average duration of the transactions was 36 days prior to the crisis, and increased slightly afterwards.
The average borrower size (proxied by the logarithm of total assets) records a slight increase after August 9, 2007, and a further small increase after the Lehman failure. The borrower capital ratio remains roughly unchanged or improves slightly. Likewise, the Fitch overall individual rating, used to derive our baseline results in what follows, records a slight improvement; a similar pattern emerges using alternative rating types from the various rating agencies (evidence not reported). This may seem puzzling in the light of two common arguments of the current debate: that rating agencies underestimated actual risk, and that a large number of (belated) downgrades took place after the onset of the crisis. Indeed, since August 2007 we observe a relatively large number of downgrades (about three quarters of the total number of rating changes observed in the period, based on Fitch overall individual rating) and a correspondingly small number of upgrades (about one quarter). The slight improvement August 2007 and turned negative afterwards, partly due to the massive liquidity injections performed by the ECB with the aim to keep the tensions under control.
9
The statistics in Table 1 are derived over the full sample, whereas the dataset used in the regressions comprises a smaller number of observations, due to missing balance sheet data for a subset of banks, and to the use of filters to eliminate outliers. Table 1 was also computed over this smaller dataset without detecting major changes.
10
By contrast, there is clear evidence that the volume of transactions declined sharply in the overnight segment of the e-MID. This can be partly explained by the fact that the ECB took up a significant amount of intermediation at very short maturities, and by a migration of e-MID transactions to the over-the-counter market. See Gabrieli (2009). Our evidence suggests that longer maturities were little affected by these phenomena.
in borrower rating which we detect is due to the fact that the table reports transactions-weighted averages: relative to the pre-crisis period, borrowers with worse-than-average credit ratings performed fewer transactions than those with good ratings, or left the market altogether. Overall, this suggests that bank-specific default risk (the quantity of risk) was not an important determinant of the soaring spread.
Changes in the composition of the panel seem somewhat more evident on the supply-side of the market. The average lender size records a slight decline after the breakout of the crisis, and a further one after the Lehman failure. Both the capital ratio and liquidity ratio of the average lender record an increase. All in all, the evidence suggests that lender quality improved during the crisis.
Overall, the market does not seem to have suffered drastic alterations since the onset of the crisis. In particular, the pool of borrowers remained relatively stable, and so did some of their key features. Therefore, sample selection bias does not seem a relevant problem with our e-MID data. Two caveats are in order. First, Table 1 shows that the share of borrowers without a rating increased during the crisis. One might speculate that these banks are on average riskier than those with a rating. Second, untabulated data show that the volume of cross-border transactions (Italian banks lending to foreign banks, or vice-versa) dropped dramatically during the crisis. This could be evidence of heightened asymmetric information problems. We explore the first issue in section 5, the second in section 6; in a nutshell, we conclude that they do not seem to be important determinants of the rise in the spread. Altogether, our evidence seems in line with the model of Flannery (1996), which can generate an interest rate increase even in the absence of changes in the creditworthiness of the average borrower, less so with Heider, Hoerova and Holthausen (2009), where the higher rate is a consequence of the more creditworthy participants leaving the market.
4. Regression analysis: basic specification and methodological issues
We regress the interest rates spreads illustrated in the previous section on a series of market-wide and bank-specific explanatory variables, allowing for possible changes in the relationships after August 2007. We estimate reduced form equations of the following type:
where rit is the interest rate spread paid by bank i at time t, xit is a vector of bank-specific variables, whereas zt controls for a series of market-wide effects, influencing interbank rates at various frequencies and maturities, which we discuss below. Dturm,t is a dummy variable taking value 1 for the period after the 9th of August 2007 and zero otherwise, reflecting the assumption that the breakout of the strains coincided with the first massive liquidity injection of the ECB.11 The coefficients vectors β2 and β4 allow us to test whether there has been a general change in money market patterns during the
strains (β2=β4=0 would be consistent with no structural change in the estimated
relationships).12
Our focus on the spread – rather than on the absolute level of the interbank rates – is warranted by our desire to factor monetary policy out of the analysis. Taylor and Williams (2009) appeal to the no-arbitrage model with macro factors in Ang and Piazzesi (2003) to show that the spread should in principle be affected by risk premia, and not by monetary policy or liquidity factors.
The dependent variable is constructed by stacking all the e-MID contracts with maturity equal to or longer than one week, in deviation from the Eurepo rate of the corresponding maturity. This choice is dictated by the thinness of the market for longer maturities, discussed in section 2. One consequence is that the coefficients of bank-specific regressors – rating, size, etc. – must be interpreted as the effect of the regressors on an “intermediate” maturity, and not on any specific maturity. On average over the crisis period (excluding the months following the Lehman default) our dependent variable has a maturity of 39 days and a value of 34 basis points (averages weighted by the number of contracts). The latter value closely matches those computed using Euribor-Eurepo spreads at the 1- and 2-month maturities (32 and 50 points, in the order), and is not too distant from the 3-month spread, a key gauge of the tensions (66 points). Thus, we argue that our results carry over to longer maturities.
11
This choice for the beginning of the crisis period, which follows Taylor ands Williams (2009), appears the natural one based on the behavior of the relevant time series. However, we also experimented with alternative dates, such as the 10th of July, when S&P announced the possible downgrading of 612 residential mortgage-backed securities backed by US sub-prime loans and a revision of the rating methodology of CDOs. Our result are robust to this alternative choice.
12
Frank, González-Hermosillo and Hesse (2008) provide evidence in line with a structural break caused by the crisis, although not specific to the interbank market.
One key explanatory variable is the credit rating, available at a daily frequency for individual banks. The regression results reported below are derived using Fitch overall individual rating, coded so as to take values from 1 to 9, corresponding to the best and worst observed rating classes, in the order (see table A1). The rating variable for banks with no rating is set to 10; at the same time, we introduce in the regressions a dummy variable taking value 1 for banks with no rating and 0 otherwise.13
Finally, we also include among the regressors a proxy for risk aversion computed using the methodology outlined in Jackwerth (2000) as implemented by Tarashev, Tsatsaronis and Karampatos (2003).14 In short, it is obtained as the ratio between the density estimated using historical data from the S&P/MIB index (the benchmark index for the Borsa Italiana, tracking the 40 most-traded stocks), and the risk-neutral density derived from the options on the index. This variable should be able to capture a generalized increase in risk aversion among market participants, allowing us to distinguish between the increase in rates due to the measured quantity of risk (our proxies of borrowers’ creditworthiness) and the price of risk.15 Indeed, as shown by Taylor and Williams (2009), analyzing the spread between uncollateralized and collateralized rates amounts, in principle, to analyzing the time-varying risk premium part of the rates. Introducing measures of creditworthiness (default probability) as well as this measure of risk aversion among the regressors allows us, in principle, to identify the two effects separately.
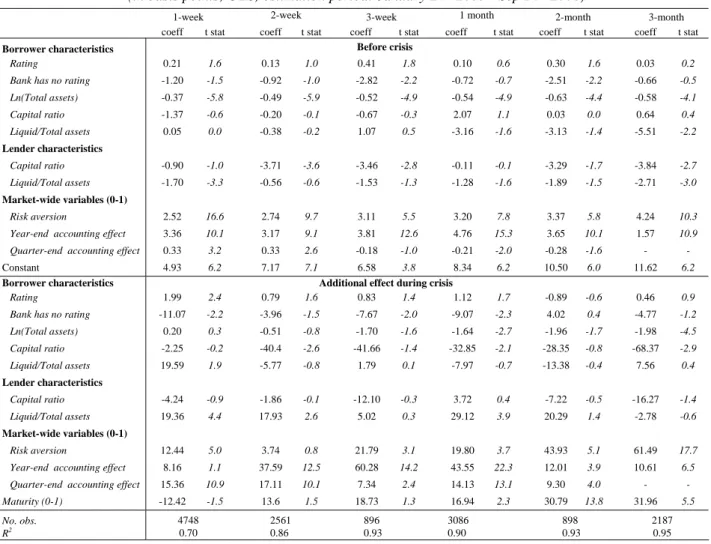
5. Main regression results
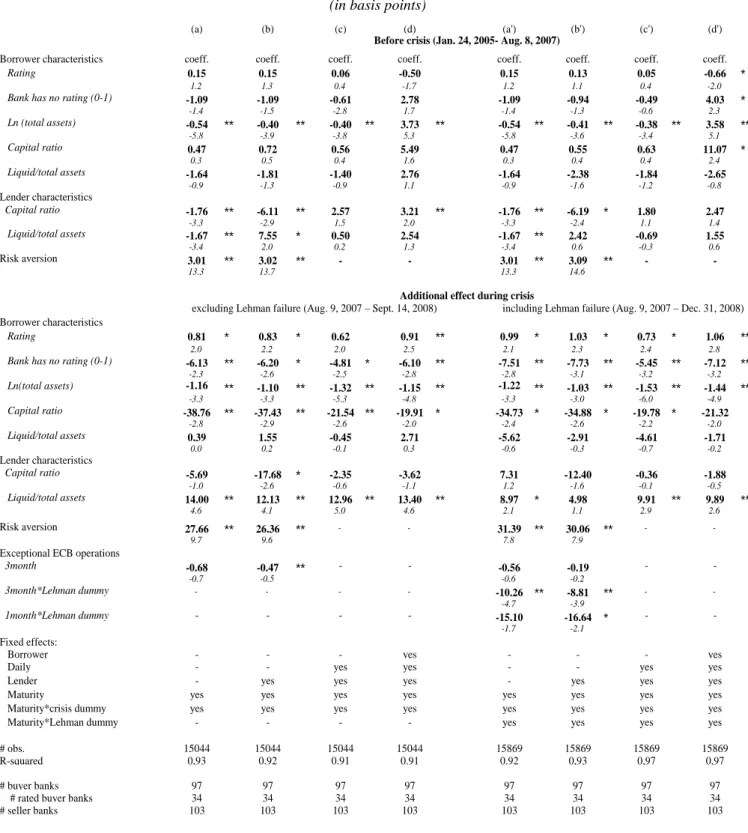
The regressions results are in table 2. Due to the structure of the data, we report standard errors adjusted for clustering, which have been shown to have good statistical
13
This procedure amounts to constraining the coefficients of all other variables – bank-specific and deterministic ones – to be the same across banks with and without a rating. It allows us make inference about banks without a rating, and significantly increases the number of available observations. For the same reason, we pool bid- and ask-originated contracts. In section 5 we assess the robustness of our key results to these choices, as well as to several other features of the baseline specifications presented in this section.
14
This variable was kindly provided to us by Marcello Pericoli. 15
Our reliance on this regressor need not imply a causality link from the stock market to the interbank market. Rather, it aims at capturing an exogenous effect that may impact on both markets. Working on US data, Furfine (2009) finds that proxies for underlying uncertainty in both these markets recorded large increases during the current crisis.
properties in panel contexts (see e.g. Petersen (2005)). After experimenting with clustering at the lender and borrower level we chose the latter, since we found that in our case this yields more conservative standard error estimates.16
5.1 The pre-crisis period
We mostly base our comment on the OLS estimates in the first column, discussing the rest of table 2 where appropriate. The coefficients for the pre-crisis period (column (a), upper part of the table) suggest that in normal times the creditworthiness of the borrower does not have an effect on the spread: the coefficient of the rating is positive but insignificant. Likewise, the effect of capitalization is nil. The coefficient of borrower’s liquidity (the ratio between liquid and total assets) is likewise insignificant. The same holds true for the coefficients of the zero-one dummy for borrowers with no rating, suggesting that the borrowing costs faced by banks without rating are in line with those of banks with an average rating. Size (proxied by total assets) is the only important borrower characteristic during the pre-turmoil period: the negative and significant coefficient indicates that large banks borrow at relatively good rates. This discount (which, however, is not fully robust; see below) could be rationalized in various ways.17 In Huang and Ratnowsky (2009), the lenders’ incentives to exert costly monitoring effort are related to the availability of costless public signals about the borrower. Such signals are going to be more readily available for banks holding a larger share of arm’s length assets, and less so for banks focusing on relationship lending. Our result could reflect the fact that such public signals are more readily available for large banks. Alternatively, the discount enjoyed by large banks could simply reflect a too-big-to-fail implicit guarantee.
Our discussion thus far has focused on the OLS specification in column (a) of table 2. Columns (b) through (d) present estimates of the same equation featuring additional controls on the right hand side. Specification (b) includes fixed effects for the lender; in (c) we eliminate the proxy for aggregate risk aversion and the controls for the
16
Indeed, the clustering adjustment causes the coefficients of most bank-specific variables in the pre-crisis period to become insignificant; without this correction most pre-pre-crisis coefficients are highly significant in all the specification considered.
17
This discount is not due simple scale returns: all our regressions include a dummy variable controlling for the size of the transaction, which is not statistically significant.
exceptional monetary policy operations, and add daily dummies to specification (b); in (d) we add borrower fixed effects. The results broadly confirm the OLS results which we have discussed thus far, with one major exception. Namely, the coefficient of bank size becomes positive and significant using borrower fixed effects (specification (d)). It could be that these fixed effects “absorb” the true size effect: bank size records little genuine time series variability over our short sample period, so the fixed effects could simply leave some spurious positive correlation between size and spreads. This view is confirmed by anecdotal evidence gathered from market practitioners and participants, suggesting that large banks did not pay a premium on the interbank market prior to the outbreak of the crisis. Furfine (2001) also reports evidence that large banks borrow at a discount. Overall, we tend to believe that the effect of borrower size in the pre-crisis period is best captured by the OLS estimates.
Summing up, this evidence on the determinants of interbank interest rates in the pre-crisis period confirms the view that this market poses the dilemma vividly illustrated by the quote from Rochet and Tirole (1996) reported in the introduction, and stands in contrast with previous studies. Furfine (2001), analyzing the overnight federal funds market, finds a negative and significant relationship between borrowers’ return on assets and capital ratio and the loan rate, suggesting that lenders do monitor borrowers’ creditworthiness.18
Concerning lender characteristics, the OLS regression suggests that better capitalized and more liquid banks lend at lower rates. These effects support the argument in Dudley (2008), who maintains that a shortage of capital forced lenders to enact a squeeze on interbank lending. However, the effect of capitalization is not robust, as it is not confirmed by the alternative specifications reported in columns (b)-(d), which we discuss below. More importantly, both coefficients yield quantitatively negligible effects on the spread.
The regression also includes several controls for market-wide effects: for accounting effects; for each maturity traded; for bid vs. ask transactions; for the size of
18
Furfine (2001) presents several other interesting results: the overnight federal funds loan rates is negatively related with the size of the lender, and with the ratio between transaction size and capital of the borrower; also, borrowers with a higher market share pay a significant premium, while lenders’ market share is negatively related to interest rates. In section 5 we briefly discuss the results of introducing these variables in our regressions.
transactions. Finally, we include the proxy for risk aversion described in section 4, which is consistently highly significant, and displays the expected positive sign. All these variables are also interacted with the crisis dummy. Except for the risk aversion proxy, the related coefficients are not reported in the table;we discuss some of them below.
We also experimented with various other macro variables (also interacted with the crisis dummy), including GDP growth, measures of the output gap and of the monetary policy stance for the euro area, an indicator of returns for the Italian stock
market, a measure of aggregate daily trading volumes in the e-MID. These variables
turned out to be insignificant or to lack robustness. Furthermore, including these variables among the regressors did not have appreciable effects on the other estimated coefficients, so they were omitted from the regressions presented in the table.
5.2 The crisis period, pre-Lehman
The lower panel of table 2, column (a), presents the incremental effects estimated over the crisis period (excluding the Lehman subsample). The picture is quite different. Most coefficients are now much larger in absolute value. The effect of borrower creditworthiness, measured by rating and capitalization, is now significant and sizeable. Interestingly, the lack of a rating is not associated with a perception of heightened risk: the spread for banks without rating becomes only slightly larger than that paid by banks in the best rating class, and 5 basis points smaller than for banks with the worst rating.19 This suggests that reduction in the share of rated borrowers observed since August 2007 is unlikely to be an important determinant of the increase in the spread.
The negative coefficient for borrower size is particularly interesting. A priori, the effect of size on the spread during the crisis is ambiguous. Considering that large banks are on average more complex and internationally diversified, more likely to hold illiquid/high risk assets, more dependent on wholesale sources of funds, one would have expected large borrowers to pay a premium after the outbreak of the crisis. On the
19
Recalling that the rating variable is set to 10 for non rated banks, the estimated effect of the lack of rating during the crisis period is 2 basis points (obtained as 10 times the coefficient of the rating, 0.81, plus the coefficient of the dummy for banks without rating, -6.13). This compares to an estimated effect of 0.8 basis points for banks with the best rating (obtained by multiplying the best rating, 1, by the rating coefficient, 0.81) and to 7 points for banks with the worst rating (0.81*9=7.3).
other hand, the classical “too big to fail” argument, in the light of the wave of bailouts at the end of 2007 and in 2008, would suggest an opposite effect. The robust negative coefficient of size in the crisis period suggests that the latter considerations have offset the former, and that moral hazard risks may have increased.
Borrower liquidity is irrelevant, as in the pre-crisis period. This result is interesting because liquidity considerations have been paramount in the current crisis. If funding liquidity were an important factor behind the increase in the spread, we should expect relatively low spreads for highly liquid banks, but we fail to confirm this a priori.20 This evidence is consistent with Acharya, Davydenko and Strebulaev (2009), who find that spreads on corporate bonds are positively correlated with the issuing firm's cash holdings, even though firms with higher cash reserves intuitively should be safer. They rationalize this result within a model in which firms subjected to financing frictions jointly choose cash holdings and investment policies. With all due caveats, due to the difficulty of coming up with reliable proxies, this evidence suggests that funding liquidity does not seem an important determinant of the widening of the spreads.
To gauge the impact of market liquidity on the spread, we included in the regressions dummy variables equal to one on the day of the announcement of exceptional long-term refinancing operations (1, 3 and 6 month maturity) launched by the European central bank since August 2007. The idea is that if the spread was partly due to a market freeze (lenders refusing to supply funds), then the exceptional liquidity injections provided by the ECB should help reduce it. In Table 2 we report only the results for the dummies whose coefficients are significant and with the expected signs. The related coefficients suggest that the ECB interventions have an important effect on the spread only after the Lehman failure. The coefficients of the exceptional refinancing operations with a 1 and 3 month maturity conducted after the Lehman failure have the expected negative sign (specifications (a’)-(d’) on the right hand side of the table), lowering the spread by respectively 17 and 9 basis points. The announcement of the 6 month operations had a significant but positive impact on the long-term rate in both the
20
The robustness of this result is confirmed using alternative measures of borrower liquidity (e.g. the ratio between interbank assets and liabilities, the ratio between interbank liabilities and total assets): in general, the related coefficients are insignificant or take a positive sign, both before and after August 2007.
crisis periods.21 Overall, this evidence is in line with the results in Taylor and Williams (2009) concerning the lack of important effects of the Fed’s term auction facility on US interbank spreads, and with those in Brunetti, Di Filippo and Harris (2009) who find limited evidence that ECB actions during the crisis were associated with improved money market conditions. Our evidence need not imply that these refinancing operations were unsuccessful: arguably, their first order effect was on the level of short-term rates, whose analysis lies outside our scope. More broadly, we believe that analyses of this specific issue, including ours, are fraught with identification problems, and that lack of a counterfactual scenario makes it virtually impossible to tell what would have happened in the money market in the absence of central bank interventions.
Coming to the effect of lender characteristics, our OLS regression in column (a) of table 2 suggests that the effect of lender capitalization did not change during the crisis (the additional term is not significant). By contrast, more liquid lenders charge higher rates after August 2007. This effect is robust across the various specifications presented in the table. It is in line with the prediction of Acharya, Gromb and Yorulmazer (2008), who argue that predatory behavior by liquidity rich banks could be a driver of high lending rates during a crisis. On the other hand, it might also capture idiosyncratic risk aversion: lenders with a higher share of liquid assets may be more risk averse than the average. Be that as it may, it is quantitatively negligible, as we shall see below. Overall, this evidence does not lend support to the hypothesis set forth by Dudley (2008), who suggests that the recent surge of marked-to-market losses may have caused a shortage of bank capital, contributing to curtail supply in the interbank market and therefore to increase the spread. By contrast, there is more support for the hypothesis set forth by Taylor and Williams (2009) to explain increased overnight funds volatility in the US market: if traders are more suspicious about some borrowers than others, this will show up in increased dispersion of rates in the cross-section. In turn, increased dispersion across banks will tend to show up as time series volatility in the aggregate rates.
21
Similar results were obtained using alternative dummies for the long term refinancing operations, based on the auction date or the settlement date of the operations. We also experimented with a zero-one dummy variable in the attempt to capture the move to a fixed rate, full allotment auction procedure implemented by the ECB since October 15, 2008. However, the variable takes a positive sign.
We now discuss the controls for market-wide effects. The coefficient of our proxy for risk aversion remains highly significant, and records a nine-fold increase. As we shall see in sub-section 5.4, this is by far the single largest determinant of the increase in the longer term spread. Recalling from section 3 that the observable measures of the quantity of risk (capital ratio, rating) remain roughly unchanged from the pre-crisis to the crisis period, this evidence confirms that that the increase in the term premium was largely driven by a generalized increase in risk aversion.
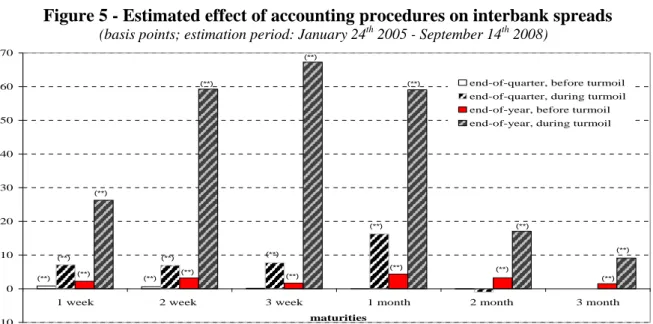
The use of dummies capturing accounting effects, which we limit to maturities up to 3 months, is prompted by the observation that interbank rates of the various maturities tend to record an upward jump as soon as the period spanned by related contract includes the key day – the final day of the quarter, or of the year. This reflects the sharp increases typically recorded by the overnight rate on these days. In turn, this
appears to be due to accounting practices;22 window dressing might also play a role
(Furfine, 2004).23 In what follows we do not investigate the competing hypotheses
behind the calendar-related changes in spreads, and refer to these dummies as capturing accounting effects. The estimates reveal that the dummies controlling for accounting
effects are important.24 The related coefficients for the pre-crisis and the crisis
(excluding the Lehman sub-period) periods are reported in figure 5. With all due caveats, made necessary by the limited number of observations available, the impact of the crisis is self-evident. Consider the end-of-year effects first. On December 15, 2007 the 2 week rate soared by 60 basis points; a similar increase was recorded on the 7th by
22
Specifically, end-of-quarter data are used to compute capital requirements. In the case of listed companies, they are also incorporated in quarterly statistical releases to the market. In practice, these data determine “capital absorption”, i.e. a cost to the banks. Hence at quarter-end banks’ attempts to minimize on interbank exposures drive interest rates up.The effect is magnified at year-end because annual balance sheet data mostly rely on the situation on the final day of the year. The overnight rate also displays end-of-month patterns, generated by banks’ effort at minimizing their end-of-month debt exposure. In turn, this may be due to the practice of tracking the capital requirements and reporting to the bank’s top management on a monthly basis for internal strategic purposes.
23
Furfine (2004) shows that risk-premia embodied in overnight federal funds transactions increase dramatically at year-end and at quarter-end. This re-pricing partly reflects differences in public disclosure requirements across institutions, namely window dressing effects: on those days, foreign banks wish to disclose greater lending to the safer US commercial banks,.
24
The dummies are constructed as follows. For the 1 week maturity, we set the end-of-quarter (end-of-year) dummy equal to 1 during the week to quarter end (year-end), and to zero otherwise. That is, the dummy is turned on as soon as the contract incorporates the final day of the quarter (year). Likewise, for the 2-week contract the dummy is set equal to 1 on the 2 weeks to quarter-end (year-end), and so forth. For the 3 month contract only year-end dummies are used. As we have seen in the regressions for the overnight, an increase is clearly documented at month-end as well.
the 3-week rate, on November 30 by the 1-month rate. The increases at the 2 and 3 month maturity are much smaller, 17 and 9 basis points, respectively, but still economically significant, considering that since August 2007 the 3 month spread has averaged 66 basis points. In the pre-crisis period these effects present a similar pattern, and are clearly identified, but are smaller roughly by a factor of 10. Figure 5 also shows that end-of-quarter tensions, barely visible before August 2007, become significant on shorter maturities; the “jump” in the 1-month rate is as large as 15 basis points. This suggests that since the onset of the crisis banks have become more reluctant to report
their interbank exposures. That is, the increased premia documented in figure 5 signals aversion not so much to interbank exposure per se, but to making such exposures public – either internally or externally.25
The additional specifications reported in columns (b) through (d) of table 2, which include fixed effects for the lender, daily dummies, and borrower fixed effects, broadly confirm the OLS results in column (a), which we have discussed thus far.
5.3 The post-Lehman period
The results discussed thus far have been obtained using a sample period ending on September 13, 2008. In the weekend before September 15, Monday, the news of the Lehman failure hit the markets. In the right-hand side of table 2 regressions (a)-(d) are replicated over an extended crisis period, which includes the months following the Lehman default, when the spread soared to record heights. In these regressions the Lehman default is partly treated as a second structural break. That is, we introduce additional maturity dummies interacted with a “Lehman” dummy, equal to one between September 15 and December 31, 2008. However, the other regressors were left unchanged, as three months of additional data were deemed insufficient to support a full set of additional parameter estimates.
25
Concerning the other market-wide controls, the dummies for maturity are in general highly significant but of no particular interest, since the magnitude of the related coefficients is affected by e.g. the coding of the rating variable. The spreads relating to bid transactions are consistently and significantly lower than those on ask transactions; the difference increases after August 2007. However, the effects are negligible, about a half basis point over the crisis period, one basis point afterwards. The dummy for large transactions (with value above the median) is insignificant, both before and after the outbreak of the crisis.
The estimated coefficients appear to confirm the ability of our regression to explain a good part of the increase in the spread and in the cross-sectional dispersion. The coefficients of the borrower rating and of the risk aversion proxy increase, suggesting that these determinants have become more important after the Lehman default, whereas the coefficient of borrower’s capitalization declines somewhat.
The coefficient of borrower’s size is particularly interesting, in the light of the increased discount to large banks documented in the regressions on the left of table 3. The a priori on how this coefficient should have changed after the Lehman default are ambiguous. On the one hand, the event could have shattered the faith in the “too big to fail” implicit warranty, causing the discount to large borrowers to decline, or even to become a premium. On the other hand, considering that after this event the financial crisis recorded a sudden acceleration, it is equally plausible that lenders may have been reinforced in their belief that no (other) large bank would be allowed to fail.
The estimates predominantly support the latter view: the coefficient of borrower size estimated over the full crisis period does not change in the first two specifications, and it increases slightly in specifications (c) and (d). Simple t tests (not reported) cannot reject the null hypothesis that that the size coefficient is stable across the pre- and post-Lehman sub-periods. Overall, including the data following the failure of post-Lehman brothers in the estimation window does not seem to make a substantial difference to our previous conclusion. Specifically, large banks still benefit from a reduction in the cost of borrowing funds, relative o the pre-crisis period.
5.4 Accounting for the soaring spread
In this section we obtain a quantitative assessment of the contribution given by the various factors discussed above to the increase in the interbank spread. To this end, we use the estimated OLS coefficients from Table 2, column (a). To get an estimate of the effect of risk aversion on the spread during the pre-crisis and crisis periods, we simply multiply the related coefficient by the average value of the variable over the periods. Likewise, to assess the impact of accounting effects at the quarterly and annual frequency, we multiply the average value of the relevant dummy variables by the corresponding coefficients, and add them up.
The resulting values are in Table 3, panel A. Before August 2007, our dependent variable averages 5 basis points, jumping to 37 over the crisis period (excluding the sub-sample following the failure of Lehman brothers), with an increase of 32 points. The contribution of risk aversion in the two sub-periods is 2 and 25 basis points, respectively; the contribution of accounting effects is 0 and 5 points, respectively. Thus, these two effects alone explain a level of the spread equal to 30 basis points, or 28 of the 32 points of its overall increase.
The bank-specific variables are also important, but their interpretation within this context is not obvious. In particular, it is not possible to draw meaningful conclusions based on the effect of the various regressors evaluated at the sample
means.26 To address this difficulty, we simulate the OLS equation for banks which,
according to the estimated effects, should be able to borrow at the “best” conditions: those with the best rating; large banks, highly capitalized banks (those in the top decile of the size and capital ratio distributions, respectively). The idea is that the increase in the spread suffered by these banks must be “unexplained”, since it cannot be accounted for by any of the regressors. In the simulations, we eliminate the effect of risk aversion and accounting effects by setting the related coefficients to zero. The results shows that, net of the effects of these variables, for the “best” banks (large banks with best rating and high capitalization) the spread declined, from 3 to -1 basis points; for the “worst” banks, it increased from 5 to 16 points.
How much cross-sectional variability of the spread is explained by individual banks characteristics? The simulated spread over the crisis period, in panel B of Table 3, goes from a maximum of 16 basis points paid on average by the “worst” banks to a minimum of -1 for the “best” banks. Thus, the range is 17 points, vs. 2 points during the pre-crisis period. Pooling the data of figure 4 across maturities, as we did for the regressions, the 10th-1st decile range of the spread is 3 basis points until August 2007 and 20 points afterwards (excluding the Lehman sub-period). Thus, bank-specific
26
For instance, since the log size for the average borrower is 9.2, roughly constant over the entire period, one could argue that the increased sensitivity of the spread to borrower size in the crisis period (-1.16; specification (a)) accounts for a 10 basis points (9.2*1.16) reduction in the spread for the bank of average size. However, replacing size with its reciprocal in the regression (quite a legitimate alternative specification), the coefficients turn positive, and the increased sensitivity to size would yield a positive contribution to the spread for the average bank.
characteristics in our regressions explain most of the increase in the cross-sectional variability of the spread.
6. Robustness checks
In this section we summarize the results of a series of robustness checks conducted on the regressions presented in the previous section. Some are documented in the appendix. First, we check the sensitivity of our results to our treatment of observations pertaining to banks without rating, described in section 4. To this end, the regressions were estimated separately over two subsamples of banks: those that do not have a rating, and those that have it. For the first subsample the estimated coefficients are broadly of the same sign and magnitude as those in the baseline regressions in Table 2. The same holds true for the second group, although the estimates yield a smaller absolute value of coefficients for both the size and the capital ratio. All in all, constraining the bank-specific variables to have the same effect for both rated and non rated banks does not seem to significantly affect our conclusions regarding banks’ characteristics, in particular on the differences between the pre-crisis and crisis sub-periods.
Second, we assess the sensitivity of our results in Table 2 to our choice of pooling the various contracts on maturities longer than or equal to 1-week into a single dependent variable. To this end, we augmented the baseline specification with interactions between each bank-specific variable and the maturity of the contract, allowing each corresponding coefficient to change linearly as the maturity lengthens. The estimated coefficients for the interaction terms in size and capital ratio are negative and significant during the crisis. Precisely, the discount for better capitalized banks increases by about 1.0 basis points as the maturity lengthens by one week; the corresponding discount for larger banks is just 0.2 basis points. Interestingly, the spread elasticity to the rating variable appears to be instead roughly constant across maturities. This picture is common to both the OLS and fixed-effect regressions. We also run separate regressions for the maturities for which a sufficient number of contracts was available. In spite of the small number of observations, the related results, in table A2, confirm the increase in the reactivity of rates to size and to capitalization in the post-crisis period. Furthermore, they suggests that the effects are roughly proportional to the maturity of the contract.
Since the 3-month maturity has been the gauge of the tensions preferred by most commentators, we used the related regression results to replicate the exercise reported in Table 3. Across the pre- and crisis periods, the 3-month spread increases on average by 59 basis points (from 7 to 66). For large, highly capitalized banks the cost of funds increases by 45 points (from 7 to 52), implying that heightened reaction to individual bank characteristics explain 18 basis points of the increase. Accounting effects explain an increase of 2 points (although this figure is likely an underestimate, because the 3-month rate is also partly influenced by the tensions for the shorter maturities, documented in section 5, that are not captured by the end-of-year dummy). Risk aversion explains 53 points of the increase; as a proportion of the total increase this is larger than documented in the previous subsection. This suggest that the relative importance of risk aversion grows as the maturity of the interbank contract lengthens, whereas that of accounting effects declines. Overall, these results are broadly coherent with those in section 5.4.
Third, we worked with annual balance sheet data. Besides representing a robustness check, this exercise has two important advantages. First, it allows us to keep foreign banks (for which quarterly data were unavailable to us) into the estimation sample. This is interesting because differences in nationality have been mentioned in the literature as a potential proxy for asymmetric information. Second, we can control for a broader set of bank-specific balance sheet variables, available in the annual data. Interestingly, our panel suggests that in the pre-crisis period Italian lenders did not charge their foreign counterparts a premium. The same holds true for foreign lenders vis-à-vis Italian borrowers. With the breakout of the crisis, the number of cross-border transactions diminished: just 8 percent of total contracts were settled between foreign and Italian banks, vs. 11 percent in the pre-crisis period. This evidence confirms the results obtained by Cassola et al. (2008) for overnight transactions. However, we still fail to detect an impact on interest rate: the premium/discount is statistically zero. The annual balance sheet dataset allowed us to introduce in the regressions the cost-income ratio, and the return on average equity (ROAE) and on average asset (ROAA). The former variable should proxy for banks’ efficiency, the latter two for profitability. The estimated coefficient for the cost-income ratio tends to take the wrong sign during the pre-crisis period (less efficient banks would borrow at a discount); after the breakout of the strains the coefficient is positive but not significant. The coefficients for the ROAE
or the ROAA are generally not significant, both before and during the crisis.27 The other estimated coefficients were broadly similar to those reported in Table 2, except that lenders’ characteristics become insignificant. We also introduced various regressors proposed by Furfine (2001) in our specifications. The ratio of transaction size to borrower’s capital is positive but never significant in the pre-crisis period; it become significant during the crisis period, but only under specifications (a) and (b). Lender size is presents a consistently negative and significant relationship with the lending rate across our specifications. We omitted it because its introduction leaves the other estimated coefficients unaffected, and it is not a crucial result within our context.
Fourth, we considered ask- and bid-originated contracts separately. As mentioned in section 2, in ask-originated contracts the lender posts a quote on the dedicated e-MID screen without knowing the identity of the applicant borrower. This warrants the premium on ask-originated rates documented in section 5. To make sure that pooling bid and ask originated contracts does not significantly affect our main results, we ran separate regressions for each contract type. The results confirm that the estimated coefficients are broadly similar across the two contract types.
Fifth, we replaced Eurepo with OIS rates in the construction of the spreads at various maturities. OIS (Overnight Indexed Swap) rates have often been used in recent months as a baseline against which to measure movements in the uncollateralized rates (see e.g. Taylor and Williams (2009)). Our results are robust to this change.
Sixth, we assess whether there is a discount when interbank transactions involve banks belonging to the same banking group. This control could capture the effect of reduced informational asymmetries due to lending relationships between borrowers and sellers of funds.28 The estimated coefficients are not significant both before and during the crisis.
27
Regressions analogous to those in Table 2 were also run using balance sheet data consolidated at the group level. This choice yields a slight deterioration of the regression fit and a slightly lower absolute value for estimated coefficients, although by and large the latter still maintain the sign and significance patterns of the baseline specification.
28
See Furfine (2001) for the investigation of banking relationships in overnight loans transactions. Since small borrowers may have difficulties to convey their credit standing to potential lenders, they may benefit by maintaining a stable relationship with a small number of banks. Furfine (2001) used both the number of transactions between a given pair of banks and the number of days on which the given pair of banks transacted as proxies of such relationships, finding only the latter to be negatively correlated with the rates paid on transactions.
Finally, we experimented with different rating measures. In principle, ratings pertaining to the short-term outlook should be best suited for the interbank market. However, we experimented with all the ratings in Table A1. Our choice of Fitch overall individual rating for the baseline regressions was based on availability (it was among the most commonly available for our sample of banks) and good regression fit. The only other ratings that yielded similar results are the Fitch long term issuer default rating and the Fitch senior unsecured debt rating. The other ratings were generally insignificant for the crisis period or for both the pre-crisis and crisis periods.29 We also experimented with squared and log alternatives to the rating variable used in the baseline regressions. Overall, the linear form seemed the more robust, although in some unreported specifications the other versions also worked well. The interpretation of the regression results in Table 2 was little affected.
7. Conclusions
This paper uses microeconomic data to gain insights on the sharp increase recorded by interbank interest rates, and by the spreads vis-à-vis the corresponding collateralized rates, since August 2007 – the “crisis period”. Our main results can be summarized as follows.
Our estimates suggest that borrower characteristics were not an important determinant of the cost of funds during the pre-crisis period. This could be due to banks’ unwillingness to engage in peer monitoring when they believe that the central bank will intervene in case of a crisis, in line with theories arguing that the implicit guarantee supplied by the central bank destroys banks’ incentives to monitor their counterparts in the interbank market (Rochet and Tirole (1996)). Alternatively, it could reflect the availability of public noisy signals about borrowers’ creditworthiness, which reduces lenders’ monitoring incentives (Huang and Ratnowsky (2009)).
After August 2007, better rated, better capitalized borrowers obtained a sizeable discount, whereas riskier institutions paid a correspondingly large premium. This is a
29
Bongaerts, Cremers and Goetzmann (2009), who mainly focus on industrial firms, find that Fitch ratings are relatively uninformative compared to either Standard and Poor’s or Moody’s. Together with our results, this evidence suggests that Fitch might be comparatively strong in the assessment of banks and financial firms.
welcome change. However, borrowing conditions improved, in relative terms, for large banks. A priori, the effect of size on the spread is ambiguous. Considering that key features of large banks (complexity, international diversification) make them likely to be more exposed to the crisis, one could have expected large borrowers to pay a premium after August 2007. On the other hand, the classical “too big to fail” argument, in the light of the wave of bailouts at the end of 2007 and in 2008, would point to an opposite effect. The robust negative incremental effect of size in the crisis period suggests that the latter considerations have offset the former, and that moral hazard risks may have increased.
The most important determinant of the widening spread seems to have been a rise in aggregate risk aversion (the price of risk): about two thirds of the increase observed since August 2007 can be traced to the effect of a proxy of risk aversion, extracted from stock market option data. A quantitatively less important contribution (about one sixth of the increase) came from accounting procedures: quarter-end and year-end data on outstanding interbank loans appear in internal and external accounts and “absorb” capital, inducing banks to curtail lending on those days. While this pattern is well-identified throughout our entire sample, after August 2007 it accounts for large jumps in the spread. This suggests that banks have become more reluctant to show interbank credit exposures, in addition to incur them.
Our results also provide clues regarding factors that did not have important
effects on the spread. These include, first, a deterioration in observable measures of borrowers’ creditworthiness (the quantity of risk), such as ratings or capital ratios. An increase in the share of borrowers without rating and a decline in cross-border transactions are observed over the crisis, but our estimates suggest that these changes did not affect the spread. Overall, this evidence does not lend support to theories focusing on limited participation as an important determinant of the increase in the spread. Second, measures of borrower funding liquidity turn out to be unrelated to the spread. In a similar vein, we find that the special longer term refinancing operations launched by the ECB since August 2007 had a dampening effect on the spread only in the post-Lehman period. Overall, this evidence suggests that low market or funding liquidity were not major drivers of the rise in the spread. Third, we fail to support the hypothesis that a shortage of lender capital contributed to the increase of the spread. There is some evidence that better capitalized lenders did charge lower rates, but the