Leased Lines Charge Control
Annexes
Statement
Contents
Annex
Page
1
Responses to this consultation
3
2
Migration credit under AI basket
4
3
TISBO and AISBO service charges and cost recovery
15
4
Follow up – Analysys-Mason Report “A study of BT’s regulatory
financial statements for business connectivity markets”
17
5
PoH related costs
23
6
Financial analysis for 2006/07 and 2007/08 costs, revenues and
volumes
31
7
Ofcom’s forecasting model
55
8
KCOM commitment letter
94
9
Legal Instrument: SMP conditions
95
Annex 1
1
Responses to this consultation
Responses to our December Consultation
A1.1 The following is a list of respondents to our December Consultation:
• BT
• Cable and Wireless
• Talk Talk • Colt • European Commission • Global Crossing • Kingston Communications • MBNL • SKY • UKCTA • Verizon Business • Virgin Media
A1.2 Non-confidential responses can be found at:
Annex 2
2
Migration credit under AI basket
Introduction
A2.1 In this Annex we set out the methodology we used to determine the “migration credit” to apply for the AI basket.
A2.2 As discussed in Sections 3 and 5 of this document, customers migrating to networked Ethernet services (referred to as Orchid-based services) are, on
average, expected to obtain price savings relative to those remaining on the legacy products1
A2.3 Therefore, we concluded in Section 3 that it is appropriate to calculate a credit under the charge control that reflects the fact that we would anticipate customers paying a lower price on average for new Orchid-based services. However, reflecting our concerns over creating a complex charge control formula, we have done this in a simple way by adjusting the required reduction in the value of X for the AI basket.
. We have concluded in Section 3, that it would be disproportionately difficult to devise a charge control formula that takes this into account and we decided to adopt a simpler formula design. The chosen charge control formula is able to reflect price changes Openreach makes on individual services or items. However, the price savings from migration between services (resulting from
differences in price levels) would not be captured. If we ignored these price savings, this could result in a tougher charge control being set than if the formula took those price savings into account and this could reduce the incentive to introduce new lower cost technologies at lower prices.
A2.4 Broadly speaking, there were three main aspects of our modelling required to calculate this credit. First, using forecasts of the volume of demand for legacy and new products, we made assumptions over the rate of migration between services. Second, we calculated the savings that customers, on average, would be expected to achieve due to migration. Finally, we combined this information to calculate the overall savings associated with migration over the charge control reference period. We then translated this total saving into an implied annual percentage saving arising from migration. This annual average saving represents the AI migration credit that we applied to the (unadjusted) value of X.
A2.5 In summary, reflecting our AI migration credit calculation, we consider that the value of X should be reduced by 2.26% percentage points. We therefore adjusted the unadjusted value of ‘X’ of RPI-9.35% to an adjusted value of RPI – 7.09% (before rounding it to the nearest quarter).
Our approach to calculating the migration credit
A2.6 To calculate the migration credit we sought to find out how much of a saving Openreach’s customers could achieve due to migration. Using as the starting point Openreach’s current price lists, we calculated the average expected savings from moving from Openreach's point to point "legacy" Ethernet services to "equivalent" networked services on the Orchid platform over the charge control period. We also had to estimate the extent of likely migration of legacy services to new products
1
The proposed formula would only credit BT for further reductions on the individual prices of either the legacy product or the new services (but not for migration between legacy and new services).
1.1 BT volume forecasts 1.2 BT’s current prices 1.3 Average circuit lengths and other factors affecting average prices.
1. Model inputs 2. Key modelling assumptions 2.2 Calculate average annual rental and connection charges for legacy and new services 2.1 Infer migration volumes from BT’s forecasts 3. Calculate revenue savings arising from migrations 1.4 Unadjusted value of ‘X’
3. Calculate forecast total revenues arising from migration based on migration volumes from 2.1 and starting prices in 2.2. Calculate revenue savings relative to “counterfactual” scenario (based on what revenues would have been with no migration). 4. Output 4. Convert total revenue saving (arising from migration) into an annual average saving. The resulting figure provides our AI migration credit. over the charge control period. We then combined these modelling assumptions to model, for the AI basket as a whole, the likely reduction in basket revenues that would arise from migrations.
A2.7 The structure of the model we used to estimate the expected average price savings is set out in Figure A2.1 below.
Figure A2.1 Model structure
A2.8 In the rest of this Annex, we describe the methodology that we followed under each of the above steps. We then explain under the final step the outputs of our model.
Model inputs
A2.9 The first step in the modelling process was to collect appropriate data on volumes, prices and further detail on circuit demand (for example, on average circuit lengths).
Volume forecasts
A2.10 One of the key inputs to the model was the volume of circuits Openreach forecasted for its legacy WES and BES services and its new Orchid –based services such as Ethernet Backhaul Direct. Figure A2.2 below shows the predicted changes in the rental volumes for the main legacy services in the Ethernet basket over the charge control period.
Figure A2.2 Openreach’s forecasts for the main AISBO products
Source: Ofcom June 2008, based on Openreach’s volume forecasts
A2.11 The forecasts suggest a decline in all of the main BES services. Openreach
forecasted that WES circuits at most bandwidths will not see a very large overall net decline over the charge control period and WES 100 Mbit/s circuits would see a net increase.
A2.12 Although not represented in the Figure A2.2, it is worth noting that WES services currently represent a large proportion of the AI basket. It follows that with minor net changes in these services over the period as a whole, these services are likely to continue to represent a significant component of the AI basket by the end of the charge control period. This means that migration volumes and the savings offered on other services would have to be fairly significant to have a large impact on average prices.
Openreach’s current prices
A2.13 We used Openreach’s current price lists for its main WES, BES and Orchid-based services to calculate the typical charges for legacy and Orchid-based services. We have listed the main starting prices in Table A2.1 below.
Table A2.1 Rental prices of main legacy and new services Service and bandwidth Rental elements
Fixed charges* Distance related (per metre)
BES - 10 Mbit/s 3,660 0.4 WES - 10 Mbit/s 4,200 0.4 EADLA -10 Mbit/s 2,500 0.4 EAD - 10 Mbit/s 4,400 0.4 BES - 100 Mbit/s 3,660 0.4 WES - 100 Mbit/s 4,600 0.4
EADLA - 100 Mbit/s 2,500 n/a
EAD - 100 Mbit/s 4,400 0.4
BES - 1 Gbit/s 4,150 0.4
WES - 1 Gbit/s 5,000 0.4
EBD - 1 Gbit/s 7,782 to 13,450** n/a
EADLA - 1 Gbit/s 4,800 n/a
EAD - 1 Gbit/s 9,500 0.4
*WES and BES fixed charges for two ends (WES unmanaged) **Charges vary by location (Band A to Band C)
Circuit lengths
A2.14 As legacy services have a distance-related element to charges we had to make assumptions over the average circuit lengths in order to calculate an average annual charge. We used information from Openreach on average circuit lengths in line with the values we have also used to inform our main charge control model. Table A2.2 Average circuit lengths for main legacy services
Product Average link length (m)
WES 10 Mbit/s 6,456 WES 100 Mbit/s 6,758 WES 1 Gbit/s 8,775 BES 10 Mbit/s 8,282 BES 100 Mbit/s 9,396 BES 1 Gbit/s 10,023 BTL mainlink 10,000
A2.15 EBD services do not have a distance related element. Instead, the annual rental charge for these services is split into three charging Bands depending on the location of the circuits. The charge for an EBD circuit sold in an area with more concentrated demand (typically in urban areas) would be lower than for an
equivalent circuit in semi-urban and rural locations. We asked Openreach to provide its forecasts of the likely distribution of circuits sold in each of these areas and weighted the different prices by this distribution to determine a typical average charge.
Key modelling assumptions
A2.16 Based on the above key inputs, we made a number of modelling assumptions to derive likely migration volumes (from each legacy product to a new service). In addition, we calculated the expected average annual charge in each year for each individual service (i.e. WES 100, BES 100, EBD 100, EAD 100) based on
Openreach’s starting prices and the average circuit lengths. A2.17 We followed three stages:
• We first inferred migration to the newer products based on the forecast reduction in demand for legacy products;
• We then calculate the average annual charges for legacy and new services; and
• We finally calculated the total revenues associated with migrations over the charge control period.
Inferring migration volumes from Openreach’s forecasts
A2.18 In Stage 1, we set out information on the main Openreach volume forecasts, which it provided to us for the legacy services (e.g. WES, BES) and new services (e.g. EBD, EAD, BTL). We then used these volume forecasts - also used in our main charge control model - to infer migration volumes. In discussions with Openreach, it had provided us with some estimates breaking down by each legacy service the potential migration volumes and the services that legacy customers were likely to migrate to. However, we were not able to reconcile these migration forecasts to the Openreach volumes used in our main charge control model. To ensure consistency with our overall charge control model, we inferred migration volumes using as our starting point the overall forecasts we used in our charge control model. We discuss below the steps we took to estimate the likely rate of migration implied by these forecasts.
We inferred migration based on the forecast reductions in demand for legacy
products
A2.19 We decided to infer the potential rates of migration using the overall forecasts for the main Openreach services. To do this, we assumed that any decline in legacy circuits (i.e. a reduction in the volume of rentals) would correspond to migration to an Orchid-based product. So, for example, if Openreach’s forecast demand for BES circuits was 100 circuits in Year 1 and 75 in Year 2, we would assume the decline in legacy circuits volumes (i.e. 25 circuits) would migrate to an “equivalent” volume of Orchid-based services.
A2.20 For those services where there was not an overall net decline (i.e. demand for the legacy services continued to increase) we did not apply a migration credit. As shown in Figure A2.2 above, if we compare the volumes of installed legacy circuits at the start of the charge control with the installed base at the end of our reference period, only for certain services is there an implied net decline. For example, for WES 100 circuits, although rental volumes start to decline towards the end of the period, our charge control forecasts suggested that the installed base of WES 100 Mbit/s circuits is higher than at the start of the period. Therefore, we did not include any migrations from WES 100 services.
Given the decline in legacy products we had to decide how this would translate into
demand for new services
A2.21 As discussed in paragraphs A2.18 to A2.20 above, our first step was to calculate the forecast decline in legacy circuits, which we assumed would then migrate to Orchid-based services. However, to come to a view on actual products that the legacy services might move to, we had to decide how to translate the volumes (associated with the decline in legacy volumes) into demand for “equivalent” services on the Orchid-platform.
A2.22 In the December Consultation, we published a matrix showing the mapping of existing legacy products to their Orchid equivalents as shown in Table A2.3 below. Table A2.3 Mapping matrix for legacy and new services (Table 6.1 from our
December Consultation)
A2.23 In practice the potential migration of products is not straightforward and this matrix therefore reflects some necessary simplifying assumptions. Subject to a few
“Relevant existing product”
“Relevant new product” used in the delivery of existing products
For the avoidance of doubt one unit of relevant existing product (i) is equivalent to the weighted sum of one unit
of each of the relevant new products used in the delivery of existing products where the weights are
shown in the table below in row (i). EBD 100 EBD 1000 BTL 1000 EAD 10 EAD 100 EAD 1000
i = 1 BES 10 No equivalent product
BES 100 1 x
BES 1000 1 1
WES 10 No equivalent product
WES 100 1 x 1
WES 1000 1 1 1
WESLA 10 1
WESLA 100 1
WESLA 1000 1
ONBS 10 No equivalent product
ONBS 100 1 x
ONBS 1000 1 1
refinements discussed below, we used this mapping to determine the “destination” of a service migrating from an existing WES or BES product. For example, the above table shows that migration of a WES 1000 service would entail use of one EBD 1000 (for the backhaul element), one EAD 1000 (for the access element) and a share of BTL.
A2.24 In using this table we made a few refinements as some mapping issues were not fully resolved in the analysis for the consultation document. One factor we had to consider was the potential consumption of Bulk Transport Link (“BTL”) circuits by migrating products2. To estimate the demand for BTL circuits generated by migration of circuits of different bandwidths, we looked at BT’s forecasts of BTL demand relative to the overall demand for EBD circuits. We estimated that on average over the charge control period demand for BTL bandwidth was 3% of the total demand for EBD bandwidth (i.e. the total demand for EBD 1 Gbit/s circuits). Therefore, as we had inferred migration of each legacy service to a relevant EBD product at a particular bandwidth, we could then calculate the likely BTL demand that migration would generate.3
A2.25 We also calibrated our inferred levels of migration to Openreach’s forecasts of the demand for Orchid-based services. For example, the decline in legacy services implied a higher level of migration demand for EBD 1Gbit/s than our charge control forecasts suggested (i.e. in terms of overall EBD 1Gbit/s demand). As the demand for EBD1Gbit/s (implied by the decline in legacy demand) exceeded Openreach’s forecasts we pro-rated the inferred migration volumes to be consistent with the forecasts for EBD 1Gbit/s in the charge control. This approach is justified as the decline in legacy services could be due to a loss of market share (e.g. due to Openreach’s wholesale customer beginning to self-supplying or cessations) or migration to higher bandwidths outside of the market. We therefore re-calibrated our model so that the implied rates of migration did not exceed Openreach’s forecast demand for Orchid-based services at particular bandwidths.
A2.26 Another issue not reflected in the above mapping matrix was the difference between EAD product variants. Openreach informed us that it offers two different EAD services, with one (EAD Local Access (“EADLA”)) providing access only services similar to legacy WESLA services. The other EAD variant is an end-to-end service that provides similar service to WES and BES services but using single fibre working and cheaper electronics. In the mapping matrix presented in the December consultation, we had not separated EAD into its EADLA and EAD end-to-end variants and instead assumed that WES services migrating to Orchid-based
services would combine EADLA with EBD to replace legacy services. We therefore asked Openreach to provide estimates of the proportions of migrating circuits likely to go to EAD or EADLA variants at different bandwidths. This information suggested that for WES services overall the majority would move to EAD services (90%) and a lower proportion to EADLA variants.
2
BTL is an interconnection product that allows OCPs that are not co-located at an Openreach Handover Point (the point where an EBD circuit would terminate) to use a BTL circuit to reach their own handover points. Not all OCPs will use BTL’s, for example if they pick up EBD traffic at the OHP using its own interconnection circuits. In addition, as BTL is only available at 1 Gbit/s, we had to determine the likely utilisation of BTL generated by a WES 100 circuit moving to EBD 100 plus a share of BTL.
3
Note that using this methodology implied that the migration of a WES 1000 or BES 1000 would not necessarily generate demand for one BTL 1000 (as was suggested by the “mapping matrix” in our December Consultation). This may be reflective of the fact that, among other things, on average, not all CPs will necessarily require a BTL interconnection product. Our average rate was 3%.
A2.27 Taking all of the above information together we were able to derive an overall view of the proportion of WES and BES services at each bandwidth likely to migrate to new services over our reference period. We also had sufficient information from Openreach to come to a view of the services on the Orchid platform that migrating WES and BES customers at different bandwidths.
Calculating average annual charges for legacy and new services
A2.28 The next stage was to calculate the expected average prices. We calculated the expected average annual charge in each year of the charge control for each individual service (i.e. WES, BES, WESLA, EBD, EAD, BTL at each bandwidth) based on Openreach’s starting prices, average circuit lengths and assumptions on the overall reductions in prices required by the charge control.
We calculated initial average annual charges based on Openreach’s price lists and average circuit lengths
A2.29 As we explained in paragraphs A2.13 to A2.15 above we gathered together information from Openreach’s price lists (as of February 2009) and average circuit lengths. We then used this information to calculate average annual rental and connection charges.
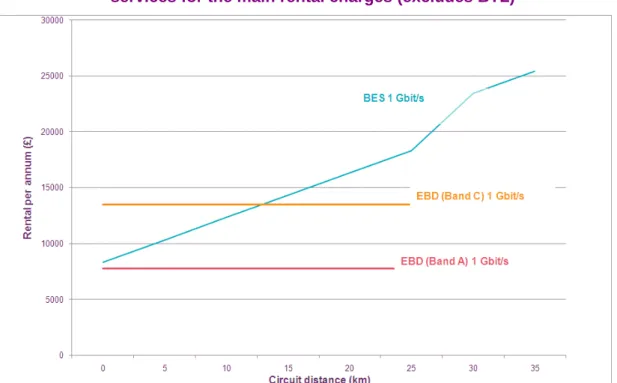
A2.30 Figures A2.3 and A2.4 compare the annual rental charge for 1 Gbit/s WES and BES service of different circuit lengths to the same bandwidth Orchid-based products. In these figures it is possible to see the prospective savings currently available (for Openreach’s main rental elements) by moving from a legacy 1 Gbit/s circuits to an equivalent 1Gbit/s Orchid-based services.
Figure A2.3 Comparison of legacy BES 1 Gbit/s services and “equivalent” new services for the main rental charges (excludes BTL)
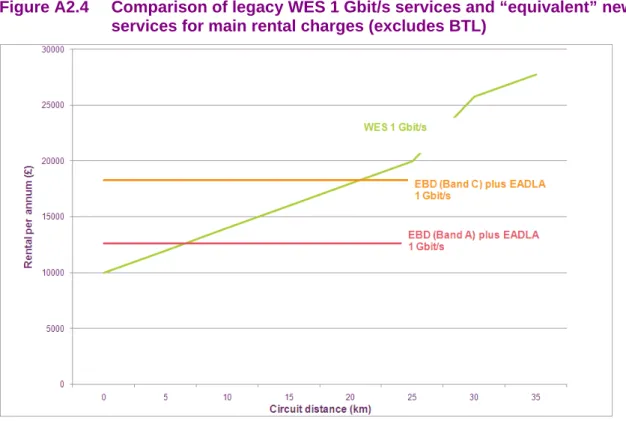
Figure A2.4 Comparison of legacy WES 1 Gbit/s services and “equivalent” new services for main rental charges (excludes BTL)
A2.31 Figures A2.3 and A2.4 show that the prospective savings available from moving from Orchid-based products are not always clear-cut. Depending on the location and distances of the circuits, a CP may or may not find the “equivalent” Orchid products more attractive. We note, however, that on average there should be savings available in rental services. Based on Openreach’s roll-out plans, most Orchid-based services will initially be available from the more densely populated exchanges where the lower Band A prices will apply. For an average distance WES and BES circuit (both 10km), there appear to be prospective savings (although this is less clear cut for WES services).
A2.32 The above comparisons only show potential savings in terms of rental prices. Thus the prospective savings could be smaller if a customer faces charges for new connections and interconnection links. The connection charge for an EBD 1 Gig/s service is higher than respective WES/BES 1Gbit/s connections. In addition, we have not included BTL pricing in the above comparison, which further reduces potential savings. OCPs that are not co-located would have to face the additional cost of interconnecting circuits. As the charging structure for BTL is relatively complex, we have not gone into the detail here, but the costs are likely to be significant. A customer migrating circuits to EBD that also requires a BTL would need to be able to spread the costs of the BTL over a sufficient number of circuits to make migration to Orchid-based products worthwhile.4
Calculation of total savings associated with migration
A2.33 Following Stages 1 and 2 of our modelling process, we then calculated the total revenues associated with migrations over our reference period (i.e. the charge
4
For example, the annual rental charge for a single 1 Gigabit/s BTL circuit is a minimum of £30,000 per annum (or higher for longer distance interconnection circuits). Once a customer has a single BTL circuit in place, the cost of adding subsequent circuits is lower. But, the initial rental fee will continue to apply, so a BT wholesale customer requiring a BTL circuit will have to generate sufficient
control period). The calculation of these revenues was relatively straightforward as we simply added:
• Openreach’s forecasts of the volume of customers remaining on legacy products multiplied by the relevant current price (as shown in Table A2.1 above); and
• Our assumed (cumulative) volume of migrated users from the legacy product to the relevant new service multiplied by the relevant price (as shown in Table A2.1 above).
A2.34 We show in Table A2.4 below an illustrative calculation of total revenues for BES 1 Gbit/s services. The absolute levels used for our volumes in our modelling are not shown, but we have indexed the numbers to the volume of BES circuits to show the relative proportions of migrated and non migrated circuits used in our model. Table A2.4 Example of total revenue calculation
BES 1 Gbit/s rental EBD 1 Gbit/s rental BTL 1 Gbit/s rental Total Volumes 100 470 14 - Average annual charge 12,309 7,969 37,396 - Revenues 1,230,920 3,748,240 523,920 5,503,080
A2.35 We combined the revenues from circuits remaining on the legacy products and those migrating to new services, which, in our illustrative example, would suggest total revenues of £5.5 million. We repeated this process for each of the main services that we considered in our credit calculation (namely WES and BES
services at 10, 100 and 1000 Mbit/s) and summed the resulting revenues calculated for each service to derive a total revenue figure.
A2.36 To calculate the total revenue saving, we then compared the above total revenues against a relevant counterfactual. We based our counterfactual on the total
revenues assuming that no migration occurred (i.e. all migrated volumes had stayed on legacy products). So, in the example above, we would assume that the 470 EBD plus 14 BTL circuits would have instead remained on BES 1Gbit/s. Our total
revenues under the counterfactual scenario would therefore be 100 plus 4705 multiplied by the average price for BES 1 Gbit/s of £12,3106
5
Although our forecasts volumes suggest 470 EBD circuits and 14 BTL circuits, the equivalent end-to-end legacy volumes would only be 470, as we would assume that each BES migration would require an EBD circuit as well as a share of BTL.
6
For services such as BES 100 Mbit/s migrating to EBD 1 Gbit/s we had to take a view of the appropriate counterfactual product would have been (had the service not migrated to the Orchid platform over the charge control period). We made the assumption that under the counterfactual scenario, there could have still been migration between bandwidths (i.e. from BES 100 Mbit/s to BES 1Gbit/s). On this basis, our counterfactual scenario calculated total revenues assuming migrated EBD 1Gbit/s circuits would have otherwise used BES (or WES) 1 Gbit/s had those circuits remained on the legacy platform. This had the effect of potentially increasing the AI credit.
A2.37 Having followed the steps in paragraphs A2.33 to A2.36 we then had estimates of total revenues under two scenarios, one using forecast migrations and legacy demand reflecting our charge control model and the other a counterfactual scenario assuming that our inferred migration had not occured. Comparing these total
revenues figures allowed us to calculate the saving associated with migration. This suggested that Openreach’s customers would pay around 6.8% less for AI rental services in the final year of the control then they otherwise would.
Final model outputs
A2.38 We calculated the total revenue savings of associated with migrations of the main rental services in the in the AI basket. As a final step, we then translated this total saving into an annual figure. This step was necessary as we needed to express the total saving into an annual amount as the value of ‘X’ in our RPI-X control relates to required annual price changes.
A2.39 Translating the overall saving into an annual figure suggested that the annual average savings associated with migration would be -2.26%7
A2.40 Therefore, our modelling suggests an AI credit of -2.26%, which would have the effect reducing the unadjusted value of ‘X’ = 9.35% (i.e. Openreach would be subject to a control of RPI-7.00% control on its AI basket).
. This is the value that we used for AI migration credit and shows (in percentage points) the amount by which we should adjust the value of X.
7
We therefore spread our estimated total revenue saving of -7.00%over the 3 year duration that the RPI-X charge control is in effect
Annex 3
3
TISBO and AISBO service charges and
cost recovery
Costs recovered via the different AISBO and TISBO service charges
A3.1 The below table summarises the capital and operating costs recovered via key TISBO and AISBO service charges.
Figure A3.1 Costs recovered via the key TISBO and AISBO service charges
Traditional interface Alternative interface1
Circuit charges Equipment & infrastructure charges Circuit charges Rentals Conns Third party link Point of handover (Local) ends Per metre Physical elements of service Local end Link Per km Conns Rentals Conns Rentals Conns Rentals Rentals
Third party customer access link Customer specific
Transmission equipment x x
Blown fibre x x
Copper drop wire x na
Non-customer specific
Transmission equipment x na
Spine fibre x x
All other elements of copper pair x na
Duct x x
Customer and non-customer specific
Maintenance costs (all elements) x x
Indirect costs (all elements) x x
Core transmission
Equipment located at terminating exchanges x na
All other transmission equipment x na
Fibre & duct x x
Circuit set up x x
PPC point of handover link (not migrated links)
Customer specific Transmission equipment x Blown fibre x Equipment maintenance x Non-customer specific Spine fibre x Duct x
Elements both customer and non-customer specific
Maintenance costs (save equipment) x Indirect costs (all elements) x Note 1: current (point-to-point fibre) services only
Annex 4
4
Follow up – Analysys-Mason Report “A
study of BT’s regulatory financial
statements for business connectivity
markets”
Introduction
A4.1 In our December Consultation we attached an independent report by Analysys-Mason commissioned to review the volumes and revenues of TISBO and AISBO services following the discovery of significant errors in BT’s calculation of volumes that underpin its calculation of internal revenues (the “AM Report”). The correction of these errors led to a material restatement of the TISBO service revenues in BT’s 2006/07 RFS.
A4.2 The main findings of Analysys-Mason were that:
• the approach taken by BT in making its 2006/07 restatement for TISBO services, wholesale trunk segments and technical areas appears to be reasonable, given the limited historical data available;
• the volumes reported in the RFS are reasonably well aligned with the revenue measure appropriate for the LLCC model;
• the current systems and processes, although complex, are potentially capable of delivering reliable volume data for TISBO and related services, provided care is taken at each stage and;
• Analysys-Mason has not been able to conduct a review of Openreach’s systems and processes which deliver volume data for AISBO services.
A4.3 The AM Report identified 17 action points suggesting Ofcom may wish to follow these up with BT.
A4.4 We set out below the 17 action points as identified by Analysys-Mason together with our commentary. BT cooperated fully and constructively in dealing with each point providing additional analysis and data as necessary. A few minor errors in the data were found and appropriate corrections made in financial analysis. The
following are examples of where our follow-up of the action points resulted in further corrections or further developments to BT’s methodologies:
• Each leased line in BT’s source operational system is marked with its operational status (such as “CURR” – currently in use). These markers have been examined more deeply and improvements made to the interpretation of this data for internal revenue calculations. A small number of internal circuits previously excluded from the revenue calculation are now included.
• Analysys-Mason identified an error in the calculation of 64kbit/s transmission lengths. These were discussed and accepted by BT who subsequently amended the data used in our modelling.
• BT supplied additional information on the breakdown of the £46m 2006/07 restatement and a revised breakdown on AI service revenues (and main link volumes) for 2007/08. We have reviewed and applied the 2007/08 data in our analysis. We intend to examine this matter in more detail once the 2008/09 data is available because it is unclear if service level information is sufficiently robust for reporting purposes.
A4.5 Although the AM report provided some assurance that BT’s corrected data provided a reasonable basis for setting charge controls, we believe that our ongoing review process of BT’s RFS should focus on improving the reliability of leased line data (financial and non-financial). BT’s 2008/09 RFS due for publication in late July will provide a valuable source of information to test the recent changes made by BT to improve the reliability of its reporting processes.
A4.6 We are also aware that in addition to our examination of BT’s regulatory financial information, the findings of the AM report and comments from CP’s, BT has
commissioned an independent review of its methods and processes for calculating revenues disclosed in the RFS. The findings of all of this work will inform the areas we wish to examine with the benefit of 2008/09 outturn information. If the results of this work indicate that further changes are needed then these will be included in our 2009/10 RFS update consultation which we aim to publish before the end of the financial year.
Table A4.1 Impact of BT’s re-statement on individual services within the TI basket
Issue #
Analysys-Mason remark Link
to issue
Purpose Ofcom follow up comment
Assessment of the accuracy of the revised turnover calculation and supporting volume data
1 Request BT to provide an analysis of the nature of the circuits in COSMOSS without a ‘CURR’ status.
11 To ensure that circuits are not being removed
inappropriately.
BT provided additional analysis and explanatory material on the status records captured in its
“COSMOSS” system. A minor error was identified in the interpretation of this data and subsequently corrected in BT’s costing processes. The
interpretation of volume data from source systems now seems reasonable. However, a key assumption is that the operational systems used by BT are reliable and we may require a more detailed view of the checks and controls applied to these systems after analysing the latest 2008/09 data.
2 Request BT to provide a reconciliation of the restatement with the original statement for 2Mbit/s volumes, accounting explicitly for the impact of Site Connect and RBS volumes.
To identify whether this is the remaining source of the discrepancy between the original and restated 2Mbit/s external connection and link volumes.
BT provided a reconciliation to Ofcom and
explanation of treatment of Site Connect and RBS volumes.
3 Request BT to provide an analysis of how each of the different input changes to the DPCN model affected the volumes of 64kbit/s link reported. If possible BT should also cross reference its restated external 64Kbit/s link volumes with the appropriate volumes produced using the same source as for internal 64Kbit/s links.
4 / 7 To build confidence in the 64kbit/s internal link volumes.
Issue #
Analysys-Mason remark Link
to issue
Purpose Ofcom follow up comment
4 Request BT to update on an RSS basis the factor of 5.07 used to convert from nx64kbit/s to 64kbit/s links, or to provide evidence that such an update would not have a material impact on the restated volumes.
3 / 7 To ensure 64kbit/s volumes are as reliable as possible.
BT is putting in place for 2008/09 RFS a substantially more granular methodology for calculating sub 2 mb/s revenues based on the price of individual services by bandwidth. We intend to review the implementation of this new methodology as part of the regulatory reporting work we undertake. 5 Request BT to provide details of the clean-up
conducted on archived Powerhouse data in order to provide volumes of 64kbit/s local ends.
To build confidence in the revised 64kbit/s local end volumes.
Additional explanatory information was provided by BT.
6 Review with BT the local end calculations carried out on data from COSMOSS and CTCS, and in particular the count and type of circuits with 2, 1 or 0 local ends in each case.
To build confidence in the revised local end volumes.
BT’s methodology was reviewed and discussed.
7 Request BT to calculate separate average lengths for internal and external 64kbit/s circuits and apply those to the associated link volumes in order to obtain the transmission volumes.
3 / 7 To improve the accuracy of relative lengths for internal and external 64kbit/s circuits.
The new methodology referred to in #3 will also reflect the actual length of individual circuits.
8 Revise 64kbit/s transmission lengths downwards by 194 614 (internal) and 67 295 (external).
To reflect an error identified in BT’s DPCN model.
BT confirmed and corrected error. 9 Work with BT to conduct a more detailed analysis
of missing AISBO circuit volumes in Powerhouse in 2006/07 and 2007/08, and identify the extent to which they explain the additional revenues.
To identify whether the additional revenues reported by Openreach have been allocated to appropriate AISBO services.
BT supplied additional information on the breakdown of the £46m 2006/07 restatement. These additional revenues contained very significant levels of high value but low volume resilient circuits. We believe there is weakness in this analysis. However we have applied the revised 2007/08 revenue analysis in this charge control.
We intend to examine this matter in more detail once the 2008/09 data is available because it is unclear if
Issue #
Analysys-Mason remark Link
to issue
Purpose Ofcom follow up comment
service level information is sufficiently robust for reporting purposes.
10 Review the systems and processes used by Openreach.
To ensure that these systems are delivering reliable volume and revenue data.
Ad-hoc assessment of relevant Openreach systems to be considered as part of ongoing evaluation of regulatory accounting processes.
Opinion on whether or not the recognition and measurement basis on which turnover is calculated for price control calculations and the RFSs is relevant, reliable and fit for purpose
11 Verify with BT whether circuits that have more than one associated job status in COSMOSS, including ‘CURR’, are included in RSS.
3 To ensure that circuits with both ‘CURR’ and ‘ICRE’ status are included in the RSS, since both of these categories are potentially revenue-generating.
Included in #1.
12 Further investigate the source of the proportion used by BT to differentiate between network and retail own-use.
1 To establish whether or not the approach taken is reasonable .
BT provided further information supporting its approach based on the network/retail use of BT’s computing services (an important consumer of internal leased lines). Although based on a proxy assumption, we believe this approach is reasonable. 13 Clarify with BT whether circuits with resilience are
counted once or twice.
To ensure appropriate treatment of these circuits in Ofcom’s analysis
BT explained how revenues (and their associated volumes) from resilience services are reflected in revenues. BT will be reporting both the costs and the revenues for resilience separately in 2008/09 RFS. We intend to review this in more detail to ensure matching between costs, revenues and volumes. Appraisal of the capability of BT’s source data
Issue #
Analysys-Mason remark Link
to issue
Purpose Ofcom follow up comment
volume data and recommendations for further quality improvements to the data used in setting leased-line charge controls, and changes to the regulatory financial reporting of the relevant markets.
14 Encourage BT to establish a greater dialogue between the Powerhouse designers and the RFS team.
(cross reference 9.1.3 in the AM Report)
To build confidence in the reliability of the data feeds.
BT acknowledged the importance of source system data being applied appropriately. We will discuss with BT what level of dialogue took place in
preparing 2008/09 data and any relevant outcomes. We will then consider if further actions are required to ensure the reliability of the source data.
15 Request BT to review the sources to the DPCN model, including the conversion factor of 5.07, to ensure that they are all on an RSS basis.
4 To build confidence in the 64kbit/s link and transmission volumes.
Included in #3.
16 Request further information from BT concerning the selection of D-codes that represent bearers, and the nature of these bearers.
To build confidence that all bearer codes have been captured.
Bearer code analysis was provided and explained by BT.
17 Request BT to make a technical review of its CTCS procedures.
To build confidence in the reliability of these procedures.
BT acknowledged importance of reliable source system data.
Annex 5
5
PoH related costs
Purpose
A5.1 In Section 4 we set out our conclusions in relation to the recovery of point of handover (“POH) costs. The purpose of this annex is to set out in more detail the history of this cost recovery, what it precisely comprises of, the two recovery mechanisms and the resulting implications that shaped our policy making as
explained in paragraphs 4.145 to 4.165 in Section 4. Finally we also explain how we have calculated the point of handover charges to be in force at the outset of the charge control.
Background
A5.1 In the 2002 PPC Pricing Direction8
A5.2 Oftel increased the price it would otherwise have determined for third party local end charges by 31% (sub 2 mb/s) and 38% (above 2 mb/s) to recover these costs. This adjustment has been called the “local end adjustment” since.
(the “2002 PPC Direction”) Oftel directed that BT should recover certain point of handover costs via a surcharge on external third party local end rental charges. Oftel described these costs as “network overheads” in the direction.
A5.3 In the regulatory financial statements BT deflated the external price by 23%, equivalent to inflating the internal price by 30%, to arrive at the internal price. Therefore in the published statements local end rentals shows two different prices for ostensibly the same services.
A5.4 As part of our work in relation to replicability9
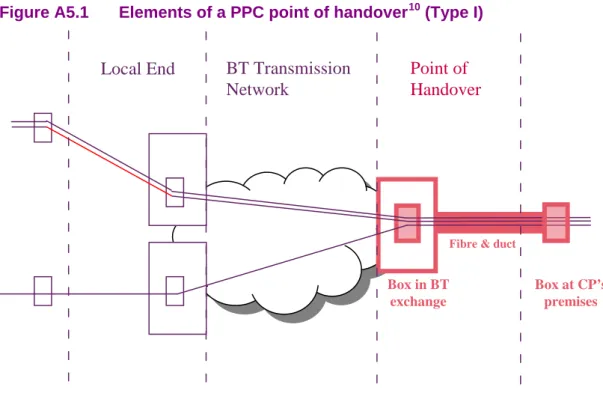
What does a point of handover link comprise of?
, we flagged up the local end adjustment as a difference between the level of local end charges BT charges communication providers and the level it charges itself. Such a difference in charges could indicate that that there was not a level playing field between BT and CPs in providing services into markets downstream of PPCs.
A5.5 Each and every PPC circuit a CP purchases from BT requires a POH link. This link comprises the physical infrastructure (fibre & duct) as well as two boxes at either end of the link.
A5.6 Figure A5.1 highlights the elements of a PPC POH link. It also shows how a number of PPC circuits purchased by a single communication provider can be aggregated through to the CP’s over a single bearer. In addition to the equipment and
infrastructure elements shown in this figure, BT will also incur maintenance costs for the link. 8 9 http://www.ofcom.org.uk/consult/condocs/draftconsent/
A5.7 Once set up, BT can handover as many individual circuits as the capacity of the link will allow at no further cost. The costs involved therefore are driven by the link itself (i.e. the bearer) rather than the individual circuits delivered over it.
Figure A5.1 Elements of a PPC point of handover10
Local End
Point of
Handover
Fibre & duct
BT Transmission
Network
Box in BT exchange Box at CP’s premises (Type I)Source: BT
10The diagram above depicts customer sited handover i.e. where BT delivers the PPC circuits right into a communication provider’s premises deploying a box located in one of its exchange buildings. The other option is in-span handover which involves BT providing the fibre up to a footway box located near its exchange. Here the communication provider connects its fibre to BT’s fibre with itself, rather than BT, providing the box in its exchange building.
How does BT currently recover these costs?
Type I: PPC point of handover links
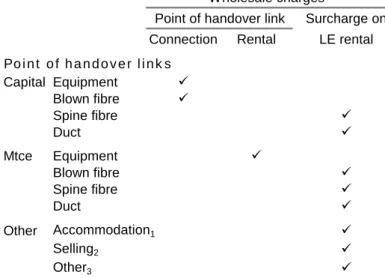
A5.8 The table below summarises which charges are intended to recover precisely which cost elements. We further explain below how the various elements of map onto the charges through which BT recovers these costs. Note the table only relates to the situation where a CP has purchased POH infrastructure.
Table A5.1 Recovery of different cost elements for PPC point of handover links Wholesale charges
Point of handover link Surcharge on Connection Rental LE rental Point of handover links
Capital Equipment Blown fibre Spine fibre Duct Mtce Equipment Blown fibre Spine fibre Duct Other Accommodation1 Selling2 Other3 Notes
1 Exchange operating costs i.e. accommodation, security and the like 2 Wholesale selling costs
3 Other indirect costs attributable to these services
A5.9 BT recovers the cost of these links through a combination of PPC POH connection and rental charges as well as through a surcharge on all circuits delivered over this link i.e. the local end adjustment. As this absolute value of this surcharge varies by bandwidth, the extent of this cost recovery depends on both the number and bandwidth of the circuits delivered.
A5.10 BT’s policy is to recover customer-specific capital costs through connection charges and all other costs through rental charges. The capital costs BT considers to be customer-specific include any equipment it deploys at either end of the link and that element of the fibre pair between BT’s exchange building and the CP’s premises that it cannot re-use (i.e. the blown fibre element). We illustrate this blown fibre element in Figure A6.2 in annex 6.
A5.11 There are about 50 different connection charges on the PPC price list to cover all the different permutations of handover offered. The minimum bandwidth BT offers is, however, 155 Mbit/s.
A5.12 BT has told us that the POH rental charges are designed to recover contractual maintenance charges from its equipment suppliers. This means that the surcharge recovers all other costs, both operational and capital.
A5.13 We note that the same surcharge applies whether there is a distance-related element (customer-sited handover) or not (in span handover). Hence, there are no
distance related charges for Point of Handover (with the exception of the MSH product11
A5.14 The analysis provided by BT suggests that only 300 out of a total 21,000 equipment boxes used to handover PPC circuits to CPs are used exclusively to handover over PPC circuits. In other words it appears that only a minority of PPC circuits are delivered to CPs using this Type I cost recovery mechanism.
).
The different cost recovery mechanism for handover for migrated PPCs
Type II: new point of handover links
A5.15 In the above paragraphs, we explained the structure for PoH charges envisaged by Oftel’s in the 2002 PPC Direction to be applied going forwards. In practice,
however, there has been alternative way in which BT charges communication providers to recovery PPC handover costs. The other charging approach, which we now understand to be by far the most common, applies to circuits originally
purchased on retail terms that CPs have subsequently reclassified as wholesale PPCs.
A5.16 The only charge BT makes for delivering these migrated PPC circuits to a
communication provider is the previously explained surcharge on third party local ends. This contrasts, for example, with the charges faced by PPC services that have not been migrated discussed in paragraphs at 5.10 above, where the CP finances the cost of the boxes at either end of the handover as well as any customer specific fibre and duct.
A5.17 BT delivers migrated PPCs to a communication provider on the pre-existing local end equipment & infrastructure. The bandwidth of this infrastructure ranges from a 64 Kbit/s copper link to a 2.5 Gbit/s fibre link and on every bandwidth in-between. BT uses this pre-existing equipment and infrastructure to deliver other leased line services to the communication provider.
A5.18 The significance of the shared use of this equipment & infrastructure is that some circuits are regulated wholesale leased line services whereas other leased line circuits fall in markets downstream of PPCs. We therefore have certain cost types which need to be attributed across wholesale and retail markets. As a result the model of having bearer circuits dedicated to handing over PPC circuits to CPs breaks down.
A5.19 In other words the physical handover link is often not unique to PPCs, and therefore the proportion of the links costs attributable to the PPC depends on what else is delivered over the link.
A5.20 Figure A5.2 shows one example of a migrated POH where the link delivers not only the migrated PPC sold on wholesale terms but also the VPN tail sold by BT to the same communication provider on retail terms.
11
The MSH network is a high capacity overlay of BT's SDH network. Connection to the MSH network allows the customer to bypass much of the SDH Tiers but access to this network is available at far fewer nodes than SDH. In these cases the point of handover link length would be typically much longer. BT informs us that it has not sold this service.
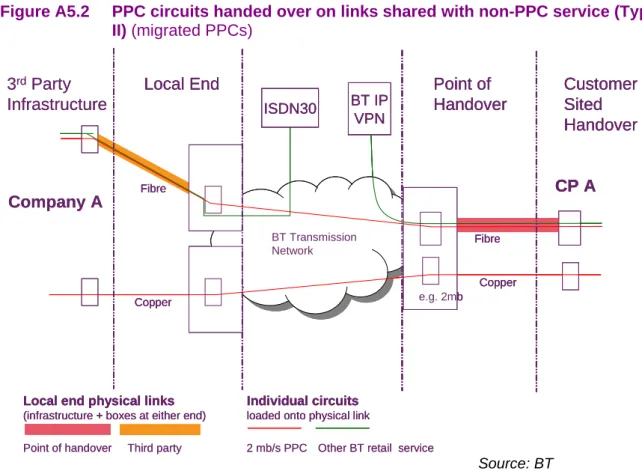
Figure A5.2 PPC circuits handed over on links shared with non-PPC service (Type II) (migrated PPCs)
Source: BT
Cost recovery between the two types of PoHs
A5.21 Table A5.2 contrasts how BT seeks to recover the different cost elements firstly over a PPC POH link (Type I) and secondly over a migrated link (Type II). We further explain below how the two types differ.
3rdParty
Infrastructure
Company A
Point of handover Third party 2 mb/s PPC Other BT retail service
Local End Point of
Handover Customer Sited Handover Copper Fibre BT Transmission Network Copper BT IP VPN ISDN30 CP A Fibre e.g. 2mb
Local end physical links
(infrastructure + boxes at either end)
Individual circuits
loaded onto physical link
Local End Point of
Handover Customer Sited Handover Copper Fibre BT Transmission Network Copper BT IP VPN ISDN30 CP A Fibre e.g. 2mb
Local end physical links
(infrastructure + boxes at either end)
Individual circuits
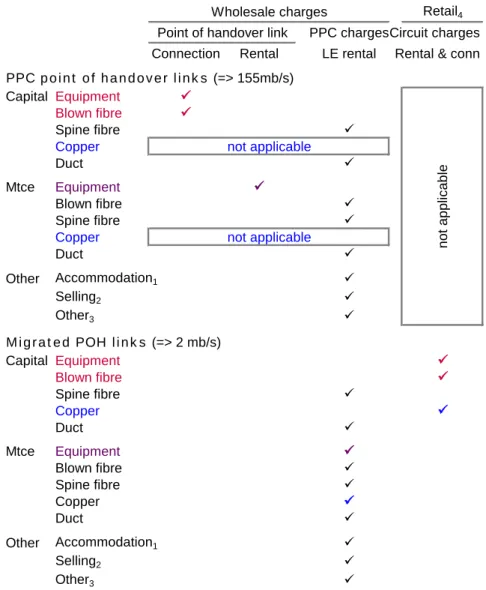
Table A5.2 Comparing & contrasting cost recovery between PPC (Type 1) and migrated (Type 2) POH links
Wholesale charges Retail4
Point of handover link PPC chargesCircuit charges Connection Rental LE rental Rental & conn PPC point of handover links (=> 155mb/s)
Capital Equipment Blown fibre
Spine fibre
Copper not applicable
Duct
Mtce Equipment
Blown fibre
Spine fibre
Copper not applicable
Duct
Other Accommodation1
Selling2
Other3
Migrated POH links (=> 2 mb/s)
Capital Equipment Blown fibre Spine fibre Copper Duct Mtce Equipment Blown fibre Spine fibre Copper Duct Other Accommodation1 Selling2 Other3 Notes
1 Exchange operating costs i.e. accommodation, security and the like 2 Wholesale selling costs
3 Other indirect costs attributable to these services
4 Retail charges relate to prior periods when CP bought circuits on retail terms
Items where the recovery differs highlighted in colour as follows Equipment and blown fibre capital
Equipment maintenance Copper not appl ic abl e
A5.22 As noted in 5.17 BT uses different equipment & infrastructure for the different arrangements. PPC POH links are always over fibre and have a minimum
bandwidth of 155 mb/s. In contrast migrated links can be over copper (indicated in blue).
A5.23 Although equipment maintenance costs (indicated by purple) are recovered through specific charges for PPC POH links, exactly the same surcharge on local end rentals applies to the two different handover arrangements.
A5.24 For migrated PPCs it is assumed that any customer-specific capital expenditure (indicated in pink) has already been recovered through retail charges. BT has however pointed out that, as communication providers can, and do, migrate a circuit
onto wholesale PPC terms after one year on retail terms, it does not always fully recover these costs.
A5.25 Finally, as noted in paragraph 5.17 but not directly shown in this table, all migrated POH links (type II) involve BT-provided fibre and duct beyond the immediately vicinity of BT’s serving exchange. In contrast CPs can and do self-provide fibre & duct just outside BT’s exchanges for PPC in span point of handover.
Implications of the differential treatment
A5.26 One consequence is that CPs who invest in new PPC POHs pay twice for
equipment maintenance costs, once through equipment rental charges and again through the (averaged) surcharge on local end rentals. This surcharge is designed to recover that equipment maintenance cost attributable to migrated POH links. A5.27 The second consequence is that there may be an incentive for CPs to choose the
migration route to avoid incurring the POH equipment & infrastructure charges. In these cases BT may well supply these circuits over a low bandwidth link. This may well result in a higher than average unit cost for each circuit handover. This
contrasts with the average unit costs obtainable with the use of a high capacity PPC handover link.
A5.28 The third consequence is that there is an element of averaging in the cost recovery for duct & spine fibre between type I and type II handovers, for type I handovers, between in span and customer-sited handovers. This averaging penalises those CPs who build out their networks to outside BT’s exchange premises. We note however that the fibre/copper/duct element of this recovery comprises a minor part of the total cost.
BT estimate of “local end adjustment” costs and revenues
A5.29 Since we published our December Consultation document we have obtained from BT a more detailed estimate of the costs currently recovery through the surcharge on external local end rentals. BT needs to produce an estimate for this cost because it does not currently separately identify these costs in its regulatory financial statements.
A5.30 In summary BT has estimated the total cost to be recovered by identifying the volume of POHs and using the cost of the associated equipment as a means to estimating all costs except for the fibre/copper & duct. BT estimated the cost of fibre/ copper & duct using a similar approach to that used to estimate the unit costs of the services in the equipment and infrastructure basket.
A5.31 The table below summarises BT’s estimate of the POH costs not otherwise recovered through other charges. It reflects 2006/07 circuit volumes & information for indirect costs drawn from its regulatory accounting system for 2006/07. The cost of the equipment it drew from its supplier price lists.
A5.32 We discussed our evaluation of the policy choices open to us and our final decision regarding this recovery in Section 4, paragraphs 4.145 and 4.165.
A5.33 The table below summarises BT’s latest cost estimate for these costs for 2006/7. This £11.7m reflects an increase of £0.6m over the £11.1m we reflected in our December Consultation. This reflects the inclusion of selling, general &
administrations costs in the total as well as a more systematic & granular methodology than the previous estimate.
Table A5.3 BT’s updated estimate of costs to be recovered through point of handover charges
All in £m Cost estimate
Exchange indirects 6.3
Access fibre/copper/duct 2.3 Equipment maintenance & indirects
Customer sited 1.0
Exchange located 0.8
Subtotal 1.8
Selling, general & admin on POH 1.3 11.7
How we have calculated our starting point of handover charges to be in force
at the outset of the charge control
A5.34 As set out at paragraph 4.164 in Section 4 we decided to implement the methodology we consulted on. In terms of the total sum to be recovered this decision is equivalent to updating the current local end adjustment to reflect the latest costs for POH and third party local end rentals. Using BT’s latest 2007/08 volumes and FAC cost estimate we recalibrated the individual charges we set out in the December Consultation to limit BT total recovery to this estimate.
A5.35 This approach results in the following charges: Per external circuit £ per year
64 Kbit/s £100 2 Mbit/s £170 34/45 Mbit/s £860 140/155 Mbit/s £1,600.
Annex 6
6
Financial analysis for 2006/07 and
2007/08 costs, revenues and volumes
Introduction
A6.1 BT published its 2007/08 regulatory financial statements (“RFS”) in September 2008. In this Annex we update our financial analysis to reflect this new information and cross check the results of our analysis as discussed in our December
Consultation.
A6.2 We made significant adjustments to the source information in respect of 2006/07 as set out in our December Consultation for two main reasons:
• to reflect a more reliable & consistent accounting view e.g. correcting for errors and matching costs to revenues
• to reflect our policy position on a variety of methodological issues e.g. technological neutrality
A6.3 It has been necessary for us to apply similar adjustments for 2007/08 and these are set out in this annex.
Objective of this annex
A6.4 The objective of this Annex is to describe and explain our adjusted 2007/08 costs, revenues and volumes for services in scope of the leased line charge control. We then compare these with our analysis of 2006/07 RFS data that we discussed in our December Consultation. We also summarise the quantitative results of this
analysis.
Purpose of the 2007/08 analysis
A6.5 The purpose of this analysis is to:• cross check the analysis we presented in our December Consultation based on 2006/07 RFS data; and
• provide the financial evidence on which we assessed the case for one-off price adjustments at the outset of the control.
Main finding
A6.6 We have found that the underlying level of adjusted profitability is broadly unchanged from 2006/07 at overall basket level, both for TI and AI.
Our analytical approach to calculating 2007/08 costs, revenues & volumes
A6.7 As with 2006/07, we undertook three different sets of analysis, one for each of the• Traditional interface (TI) services;
• Alternative interface (AI) services; and
• Equipment and infrastructure services.
A6.8 The first two baskets comprise circuit connection and rental services for the two different interfaces. The latter basket in contrast primarily consists of connection charges in relation to equipment and infrastructure deployed at the ends of traditional interface circuits, including point of handover (“POH”) ends. These charges typically support a number of circuits.
A6.9 Below we explain the types of adjustment we made, the outputs we produced and the inputs we used across all three types of analyses.
Table A6.1 Types of adjustments
# Question Type of adjustment Examples
1 Do BT’s reported figures provide a relevant & reliable accounting view of BT’s service costs and profitability for 2007/08?
Corrections to source data Mismatch between costs and revenues
e.g.
PPC local ends AI connection charges
Greater granularity BT didn’t identify backhaul per metre charges within its AI services in 2006/07, but did so for 2007/08.
2 Does our adjusted accounting view provide a suitable basis for price controls in terms of: a reflecting one-off events or
abnormal levels of cost or revenue?
Smoothing of costs & revenues
i.e. adjusting to reflect expected levels of future costs or revenues
Normalisation of current cost holding gains/losses
Smoothing of peaky reported costs identified from trend analysis
b how we expect BT to recover particular items of cost in future?
Implementing our cost recovery methodologies through adjustments to cost, revenues and volumes
Cost recovery profile for certain assets to be consistent with BT’s regulatory asset value (RAV) Change in the way in which costs are recovered for certain point of handover costs (previously referred to as “the local end adjustment”)
A6.10 We recognise that there are some interdependencies between the adjustments we have made. In this annex we list the adjustments in the order we have processed them. We do not believe that any re-sorting of this order would result in a materially different result.
Outputs
2007/08 profitability
A6.11 We prepared two different types of profitability analysis, both drawn from the same underlying adjusted base year information:
• individual service profitability based on comparing unit costs (including the cost of capital) to prices or average unit revenues; and
• basket & group service profitability based on return on capital employed (“ROCE”) in the case of the two main baskets (where the capital employed is significant) and a return on sales (“ROS”) for the equipment and infrastructure charges basket (where capital employed is insignificant and ROCE is therefore a poor measure of profitability).
A6.12 Mean capital employed (“MCE”) values reflect the extent to which BT had already depreciated its assets over their estimated useful economic life. We did not attempt to adjust MCE values to reflect “steady state” investment on an asset-by-asset basis in this analysis.
A6.13 In our individual service and basket profitability analysis we use a fully attributed cost (“FAC”) approach. This is the same costing method that BT uses to prepare its Regulatory Financial Statements (“RFSs”).
Adjusting 2007/08 profitability for latest prices
A6.14 In order to consider the need for further one off price changes we took into account price changes already implemented or proposed by BT. We did this by suitably adjusting 2007/08 revenue for these latest prices.
Information to incorporate within our RPI-X model for 2007/08
A6.15 We calculated the value of each adjustment (with the exception of the CCA normalisation and RAV adjustments which are modelled in our charge control model) across all the services within scope of the traditional and alternative interface baskets. We then ensure that these values are appropriately reflected within the 2007/08 costs & volumes generated by this model. We explain this further in paragraph A7.14 in Annex 7.
A6.16 The RPI-x model is not used for our price control decisions in respect of the the Equipment and Infrastructure basket. Therefore we did not need 2007/08 accounting information for this purpose.
Comparison with 2006/07
A6.17 We presented the adjusted 2007/08 basket level information in a form that allowed us to compare and contrast it with the information we prepared for 2006/07.
Inputs
A6.18 The starting point for our analysis was BT’s regulatory accounting information. This information is designed to provide costs and revenues at a granular level prepared on a basis suitable to be the starting point for regulatory decision making such as these charge control proposals. For example costs are prepared on a current basis,
the basis most relevant to give a view of the long run economic costs of providing these services. The information published in the regulatory statements is also subject to an independent audit.
A6.19 We took regulatory accounting information for 2007/08 from BT’s:
• audited published regulatory financial statements (RFSs);
• unaudited additional financial statements (AFSs) provided to Ofcom; and
• responses to our supplementary information requests.
A6.20 For 2007/08 we used information drawn directly from BT’s regulatory accounting systems for both main charge control baskets, the traditional and alternative
interface baskets. For the equipment and infrastructure basket, we were not able to follow this approach as BT does not expense this equipment and infrastructure in its regulatory costing system. Instead we used bottom-up unit costs provided by BT as our source information. BT incorporated contractual prices for equipment in its unit cost calculations.
The rest of the Annex
A6.21 In the following sections we describe in detail for each basket separately:
• the services involved;
• the inputs we use / their granularity;
• the adjustments we make; and
• the results.
TI basket services
Description of services
A6.22 This basket comprises PPC circuit rental and circuit connection charges. We
illustrate the rental elements of a PPC circuit in the Figure A6.1 below i.e. local ends and main link. Main link charges comprise the fixed (‘per link’) charges and variable per kilometre charges for distribution and trunk transmission.
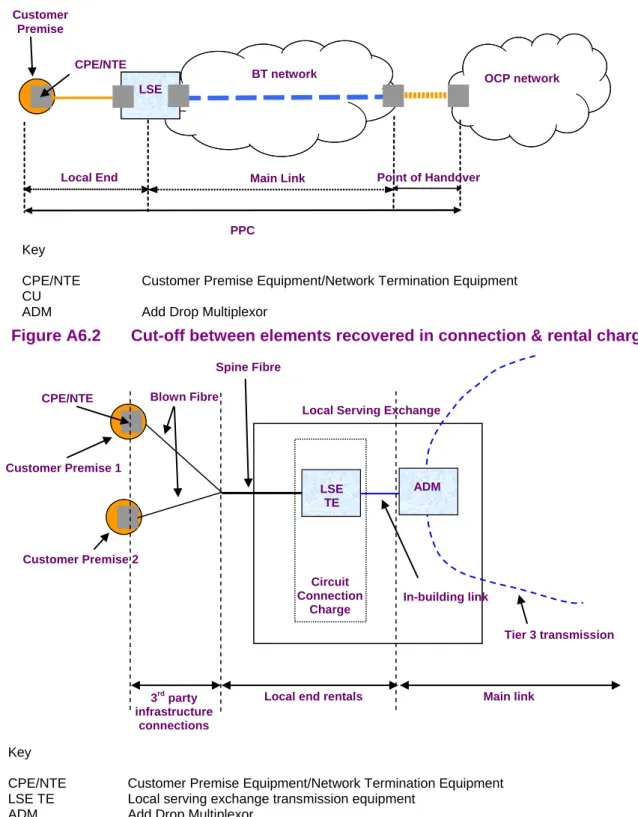
A6.23 There are also rental charges designed to recover certain point of handover (POH) costs, which also fall within this basket. POH refers to the bearer link across which BT delivers individual PPC circuits to CPs. We describe these costs more fully in Annex 5, Point of Handover Costs and Charges.
A6.24 There is one category of costs, local end fibre and copper, whose recovery depends on which side of the final flexibility point before the end user they fall. BT considers blown fibre and dropwire copper to be specific to a particular customer and recovers these costs within its third party infrastructure connection charges which fall outside this basket.
Figure A6.1 The different rental charging elements for a partial private circuit
Figure A6.2 Cut-off between elements recovered in connection & rental charges
A6.25 BT’s regulatory costing system separately identifies many of the services within the scope of our traditional interface baskets. We list out these services at paragraph A6.30. There are however two sets of exceptions, enhanced maintenance and sub 2 mb/s circuits, which we discuss below.
OCP network BT network Local End LSE LSE PPC
Main Link Point of Handover CPE/NTE
Customer Premise
Key
CPE/NTE Customer Premise Equipment/Network Termination Equipment CU
ADM Add Drop Multiplexor
Tier 3 transmission CPE/NTE Customer Premise 1 LSE TE Customer Premise 2
Local Serving Exchange
Main link Local end rentals
3rd party infrastructure connections ADM In-building link Spine Fibre Blown Fibre Circuit Connection Charge Key
CPE/NTE Customer Premise Equipment/Network Termination Equipment LSE TE Local serving exchange transmission equipment
Enhanced maintenance
A6.26 Enhanced maintenance charges relate to the premium repair service that
communication providers can opt to purchase to top up the service level associated with standard circuit rental charges. BT levies further fixed and variable distance charges for each PPC. For 2 mb/s circuits enhanced maintenance costs
approximately add a further 10% on the basic charges. In 2007/08 BT sold all PPC circuits with enhanced maintenance according to the RFSs except for trunk. For all rental services falling in origination markets reported in the RFSs BT identified this revenue separately and included in these services’ cost base an attribution of this cost. We therefore assess the level of circuit charges reflecting BT’s attribution of enhanced maintenance.
Sub 2 mb/s circuits
A6.27 BT offers sub 2 mb/s circuits in multiplies of 64 kb/s up to 1,024 kb/s for link and per kilometre charges. Prices for these services do not reflect a straight bandwidth gradient. In the RFSs, BT identifies 64kb channels rather than circuits for these link and per kilometre services. We therefore assess the profitability of these services by comparing average unit revenue for a 64 kb/s channel with the corresponding average unit cost.
A6.28 Furthermore, BT does not separately identify per kilometre volumes for trunk and distribution services. Instead it presents these two services together. We therefore assess profitability of distribution and trunk charges on a combined basis.
Inputs / granularity
A6.29 Our main financial data source for costs & revenues is contained in BT’s AFSs for 2007/08. These AFSs provide profit & loss and mean capital employed statements for all the services BT reports within its published RFSs in the same format as these published statements. The AFSs are not audited, but reconcile in aggregate to the costs and revenues appearing for each market reported in the audited RFSs. A6.30 We used the AFSs for 2007/08 for the following TI basket services: