The California Commission
on Health and Safety
and Workers’ Compensation
DRAFT
Impact of Physician-Dispensing of Repackaged Drugs on
California Workers’ Compensation, Employers Cost, and
Workers’ Access to Quality Care
A Study for the Commission on Health and Safety
and Workers’ Compensation
Frank Neuhauser
Survey Research Center, UC Berkeley Alex Swedlow
California Workers’ Compensation Institute Barbara O. Wynn
RAND
July 2006
CHSWC Members
Angie Wei (2006 Chair)Allen L. Davenport Leonard C. McLeod
Alfonso Salazar Kristen Schwenkmeyer
Robert B. Steinberg Darrel “Shorty” Thacker
John C. Wilson
Executive Officer
Executive Summary
Physician-dispensed prescription drugs comprise a significant portion of all pharmaceutical prescriptions dispensed in California’s workers’ compensation system. Because of limits on the reach of statute and regulations adopted under Senate Bill (SB) 228, physician-dispensed pharmaceuticals are also much more expensive than the same drugs dispensed through a pharmacy. This report documents the extra costs placed on the workers’ compensation system by physician-dispensed drugs. The report also reviews research on both the positive and negative impacts of physician dispensing, including the main arguments raised by proponents at Commission on Health and Safety and Workers’ Compensation (CHSWC) meetings and at Division of Workers’ Compensation (DWC) regulatory hearings.
Main findings on the direct cost of physician-dispensed drugs:
• Physician dispensing is much more common than most observers expected. 30.3% of prescriptions dispensed in the California workers’ compensation system are dispensed by physicians directly from their offices.
• Approximately half (50.8%) of the total cost of pharmaceuticals in the workers’ compensation system is paid to physicians for prescriptions dispensed from their offices.
• Because of the structure of the Official Medical Fee Schedule, physician-dispensed pharmaceuticals are much mo re costly than the same drugs dispensed by a pharmacy. On average, physician-dispensed drugs cost 490% of what is paid to pharmacies. In some cases, including the most commonly prescribed drug dispensed by physicians, the mark-up exceeds 1000%.
• The most common physician-dispensed drug, Ranitidine (generic Zantac) also has one of the highest mark- ups when physician dispensed. Physicians were reimbursed, on average for the ingredient cost at over 1700% ($2.97/pill) what pharmacies were paid ($0.18).
Price Points and Actual Reimbursements--Ingredient cost
Ranitidine (Generic for Zantac)
$0.00 $0.50 $1.00 $1.50 $2.00 $2.50 $3.00 $3.50 MediCal Reimbursement Pharmacy--Average AWP Repackage--Average AWP Average paid--Dispensing MDs Price point $/tablet Paid to pharmacies Average paid to dispensing MDs
• We estimate that for calendar- year 2006, insurers and self- insured employers will pay $649 million for prescription drugs. Of this paid amount, $263 million will be paid to dispensing physicians in excess of what would have been paid for the same drugs if dispensed by a pharmacy.
Distribution of Total Rx Paid--2006
($millions)
Pharmacy, $319 Excess to MDs, $263 MD if at Pharmacy, $67• We estimate that insured employers will face premiums for the 2006 policy year which are $490 million dollars higher than if all drugs were dispensed through pharmacies. This represents 2.2% of premium for the policy year.
Impact of Physician-Dispensing on
Employer Premium--2006 ($millions)
Excess to MDs, $490 Pharmacy, $594 MD if at Pharmacy, $125
Other findings on costs and benefits:
• The research literature on the subject of physician-dispensed drugs generally argues that physician dispensing leads to increased, possibly inappropriate, use of prescription drugs. The studies have usually been conducted outside the U.S., and the results cannot necessarily be generalized to the California workers’ compensation system. However, research on physician practices with similar incentives, such as self-referral for lab tests or imaging, has consistently found that incentives inherent in self-referral lead to over-utilization.
• The data in this study were not designed to determine whether physician dispensing led to increased utilization or changes in the types of drugs prescribed. However, the study does find striking differences in the types of drugs dispensed by physicians and pharmacies. This research could be extended to allow a fuller analysis of how financial incentives may change prescribing practices.
• Research finds only weak evidence for better compliance with drug regimes when the physician dispenses directly to the patient. There is virtually no research demonstrating better health outcomes or more rapid recovery when physicians dispense.
• It is important to extend the research in this study to examine whether extensive use of physician dispensing does affect health outcomes, and if so, whether the effect is positive or negative.
Report
I. Introduction
In 2000, the Commission on Health and Safety and Workers’ Compensation (CHSWC) issued a report (Neuhauser, et. al., 2000) identifying potential savings in the area of prescription drugs. The Official Medical Fee Schedule (OMFS) in effect at the time of that study reimbursed dispensers of scripts at a premium substantially above what was paid by MediCal (Medicaid), group- health providers, and many other workers’ compensation jurisdictions.
In response, the Legislature enacted Senate Bill (SB) 228 (Alarcòn) pegging the pharmaceutical portion of the OMFS to the MediCal reimbursement formula. MediCal reimbursement levels are carefully monitored by the federal government, the largest single payor of medical treatment in the U.S. Consequently, Medicaid schedules determine the accepted level of reimbursement for a plurality of prescription drugs delivered in an any calendar year.
The MediCal schedule represented a substantial reduction from the pre-SB 228 schedule. Estimated savings were substantial. However, much of the anticipated savings have not been realized by employers because a substantial, and until now unidentified, portion of pharmaceutical costs were represented by physician-dispensed drugs which remained largely unaffected by the reforms.
The interpretation of the statute by the Division of Workers’ Compensation (DWC) left considerable latitude for physician-dispensed drugs to be paid (at least as an upper limit) under the pre-SB 228 schedule. Previous research (Neuhauser, et al., 2000) had shown the pre-SB 228 schedule was overly generous. While the earlier schedule represents the maximum reasonable reimbursement rate, in practice, there has been little information on how employers/insurers were actually reimbursing dispensing physicians. In addition, there has been virtually no case law at the Workers’ Compensation Appeals Board (WCAB) about what represents appropriate reimbursement for physician-dispensed prescriptions. As we will see below, some claims administrators have acted, in the absence of DWC regulatory direction, to pay “reasonable fees” that are less than the maximum reasonable fees of the pre-2004 fee schedule. Such reimbursements have been met with no apparent litigation in the lien arena.
This report examines how a major exception to linking of MediCal fees to workers’ compensation fees, the dispensing of repackaged drugs directly by physicians, limits the savings under SB 228 for employers and workers. This loophole, particularly in regulation by the Department of Industrial Relations (DIR), continues to result in a significant fraction of prescriptions being paid at rates significantly higher, often several times higher, than prescriptions dispensed through pharmacies.1
Opportunities, both legislative and regulatory, have arisen to address this issue. That the issue had not been addressed more quickly resulted, in part, from a lack of information on the extent to which repackaged drugs, dispensed by doctors, are driving the pharmaceutical component of total workers’ compensation medical costs. This void in information includes the types of drugs dispensed, the difference in price between drugs dispensed by physicians and those dispensed by
1 The Division of Workers’ Compensation has recently submitted proposed regulations to the Office of Administrative Law. These proposed regulations are included as Appendix 5. The authors have not yet had an opportunity to review the impact of the proposed regulations.
pharmacies, and, finally, the total additional cost to employers and workers of the current pricing structure. Data on these issues are critical for crafting an appropriate legislative and/or regulatory solution that protects workers’ access to care while controlling employers’ costs. A number of stakeholders, particularly physicians, occupational health clinics, and the suppliers of repackaged drugs have made claims for the superiority of physician dispensing over pharmacy dispensing. While high-quality research supporting these claims is virtually non-existent, these concerns should be weighed. We address the issues raised by proponents and opponents in Section 5 of this report. In Section 5 we also review the available literature on each argument and data from this study where relevant.
2.0 Description of Physician Dispensing
Pharmaceuticals prescribed and dispensed by physicians are often referred to as “repackaged” drugs because the y are purchased by wholesalers from manufacturers in large quantities (e.g., 1,000-10,000 tablets) and repackaged into single prescriptions sizes (e.g., 15, 30, 60 tablets) appropriate for dispensing directly to patients.
For every combination of drug, manufacturer/wholesaler, and package size, the federal government assigns a unique 11-digit National Drug Code (NDC) number. Since repackagers are wholesaling a different package size than the original manufacturer, they are assigned a new NDC number. In addition, repackagers assign a new “average wholesale price” or AWP, a benchmark price frequently used by payors for reimbursement. The new AWP does not necessarily bear any resemblance to the original manufacturer’s AWP.
California’s professional code requires that physicians individually buy and maintain the drugs they dispense. (See Appendix 3 for the wording of the code.) Physician dispensing received a major boost in California with the introduction of computerized point-of-sale (POS) systems that are leased to physicians by repackagers and that automate the process of buying, dispensing, and billing drugs from physician offices. POS systems allow even multi-physician groups to appropriately segregate repackaged drug inventories by physician and stay wit hin the requirements of the codes.2
Some classes of drugs, while available from repackagers, are rarely or never dispensed by physicians because of additional controls imposed on these drugs by the Drug Enforcement Administration (DEA). DEA class 2 drugs, those considered to have the most potential for abuse (e.g., morphine, amphetamines), are infrequently dispensed by physicians. In the data sample for this study, 99.5% of DEA class 2 drugs were dispensed through pharmacies.
3.0 Description of pharmaceutical pricing
Pharmaceutical pricing is complex and poorly understood even by many regulatory agencies. Often this is because the terminology is arcane and sometimes misleading. Below is a brief explanation key drug pricing benchmarks. More detail is available in a prior CHSWC report.3
2 Physician dispensing was challenged by the retail pharmacy industry, but a California court case, 99 Cal. App. 4th 247, Park Medical Pharmacy v. San Diego Orthopedic Associates Medical Group, Inc., upheld the legality of physicians dispensing from their offices without a pharmacy license. See Appendix 4.
3 Additional detail is available in the prior report for CHSWC, at http://www.dir.ca.gov/CHSWC/Pharmacy/pharmacover.html
3.1 Average Wholesale Price (AWP)
AWP is probably the most widely quoted pricing benchmark, but the least meaningful. Every NDC number has an associated AWP. However, unlike what the name implies, the price has no relation to a wholesale price, average or otherwise. It is simply an artificial price point established by the manufacturer, wholesaler, or repackager. The AWP is often analogized to the “sticker price” on a new automobile. However, this is a poor analogy. The auto sticker price offers some information about the actual retail/wholesale price. The AWP, on the other hand, offers little information about the underlying wholesale pricing of “single-source, brand- name drugs” and absolutely no information about the underlying wholesale cost of generic drugs. Single-source, brand-name drugs are newer pharmaceuticals, still under patent protection, and available from only one source (or occasionally more than one source under licensing arrangements). An example is Ambie n, a non-narcotic, sleep aid, frequently prescribed in workers’ compensation. Other examples include the group of drugs know as Cox-II inhibitors, e.g., VIOXX, Celebrex, and Bextra. Cox-II inhibitors were prominent during the early period of the data for this study but were subsequently removed from the market because of severe side-effects (VIOXX), heavily restricted (Celebrex), or still generally available (Bextra). Single-source, brand-name drugs are typically reimbursed by insurers (group health, Medicare/Medicaid, workers’ compensation) at a discount to the AWP. Currently, MediCal (California’s Medicaid program) discounts single-source, brand- name drugs at 83% of AWP. In addition, MediCal negotiates significant rebates from the drug manufacturer for inclusion on the MediCal formulary. These rebates vary by drug, but overall average about 20-25% of MediCal total drug costs.4
The relationship between single-source, brand- name drugs and AWP is non-existent for multiple-source, generic drugs. Multiple-source, generic drugs represent, by far, the majority of dispensed drugs. However, because they are substantially less expensive, they represent a smaller portion of total expenditures. Typical of multiple-source, generic drugs are Ranitidine (generic for Zantac), Hydrocodone (Vicodin), and Naproxen (Naprosyn or Aleve [over-the-counter]). Each of these drugs is widely available in generic form and, as discussed below, the AWP is almost never related to the actual wholesale price or actual reimbursement rate.
As a rule, the AWP is only related to the actual reimbursement for single-source, brand- name drugs and only after consideration discounts to the AWP and direct rebates from the manufacturer. Otherwise, AWP is not consistently related to any appropriate retail pricing. 3.2 Federal Upper Limit (FUL)
The Federal Upper Limit (FUL) is used for multiple-source, generic drugs with multiple manufacturing sources. Generally, any generic equivalent for a brand-name drug for which the patent has expired and for which there are multiple manufacturing sources has a FUL price that applies to Federal and most state programs. There is sometimes a small window, maybe 6 months, between the expiration of the patent protection for a brand-name drug and the establishment of a sufficient number of alternative manufacturing sources, during which a brand-name drug with generic equivalents will still be priced relative to AWP. After multiple manufacturers have entered the market, FUL pricing is definitive. FUL pricing establishes
4 Figures on total drug expenditures and total rebates were available on the California Department of Health Services (CDHS) website, but recent changes have left these data inaccessible. Challenges have been made that California underestimated potential rebates and has failed to collect all rebates to which the MediCal program was entitled.
reimbursement at 150% of the lowest-cost generic equivalent available on the market, or, 150% of the AWP of the lowest-cost alternative available on the market anywhere in the U.S. The FUL often results in a price point that is a fraction of the AWP for a particular manufacturer or repackager. How this price point relates to the average AWP for generic equivalents is discussed below.
Within MediCal, the Federal Upper Limit (FUL) is determinant of pricing for the majority of multiple-source, generic drugs.
3.3 Maximum Allowable Ingredient Cost (MAIC)
Maximum Allowable Ingredient Cost (MAIC) is an alternative pricing scheme, always lower than or equal to FUL. MAIC pricing is established independently by individual states for some drugs that within the state may be generally available at a price lower than the FUL. Often these lower prices are negotiated directly with manufacturers, possibly in lieu of or in addition to rebates to the state from the manufacturer.
3.4 California MediCal Pricing
SB 228 made the California MediCal program the basis for pricing pharmaceuticals in the state’s workers’ compensation system. The default for the California MediCal program is the FUL price, except where a separate MAIC price has been established in the absence of FUL or because the MAIC is a discount even to the FUL. MediCal also publishes a “no substitution” price which applies if the physician specifies that a specific drug be dispensed. The no-substitution price is currently AWP – 17%. For drugs without a FUL or MAIC price, typically brand- name drugs without generic substitutes or for which fewer than three generic substitute prices are available, AWP - 17% is also the controlling price.
3.5 Pricing for Repackaged Drugs
MediCal excludes reimbursement for repackaged drugs. There is no price listed for these drugs or their National Drug Code (NDC) in the MediCal pharmaceutical fee schedule. In the absence of regulatory direction from the DWC, this has been interpreted as allowing reimbursement for these drugs to be controlled by the pre-SB 228 Official Medical Fee Schedule (OMFS) which set “maximum reasonable” reimbursement at 1.4*AWP for generic drugs and 1.1*AWP for brand-name drugs (plus professional fee). Actual reimbursements made by some payors attempting to pay reasonable fees is less than the maximum amounts allowed pre-SB 228, but more than the amounts allowed for pharmacies.5
Example of various prices---Ranitidine (generic for Zantac)
An example of how these various pricing approaches relate and how they can affect the price faced in workers’ compensation by employers/insurers for any single drug may more clearly illustrate this issue. Ranitidine is the generic name for the drug Zantac that treats gastro- intestinal problems. The chart below indicates that:
• MediCal set reimbursement for Ranitidine 150 mg at $0.18 per tablet.6 This price was also the FUL price. This was what pharmacies were paid for each unit of the ingredient portion
5 While different payors appear to take different approaches to reimbursement of physician-dispensed drugs and a significant portion of reimbursements are at a reduction to the prior OMFS maximum reasonable fee, a quick survey of WCAB judges did not indicate that there was any significant lien activity or other legal challenges to
reimbursement at less than the prior OMFS “maximum reasonable fee.” 6 MediCal price as of 7/05.
of reimbursement for a Ranitidine prescription (separate from the professional fee of $7.25/prescription).
• The average AWP for Ranitidine dispensed by pharmacies was $1.18 per tablet or about 6.5 times the actual reimbursement.7 That is, pharmacies were paid, on average, about AWP * .15.
• Physician-dispensed Ranitidine had, on average, much higher AWPs. The average AWP reported by drug repackagers was $2.35 per tablet, or about twice the AWP for pharmacy- dispensed Ranitidine.
• Dispensing physicians were actually reimbursed, on average, $2.97 per tablet. This was on average about 125% of average AWP and 1,750% of what pharmacies were reimbursed for the same ingredient component of a prescription.
Price Points and Actual
Reimbursements--Ingredient cost
Ranitidine (Generic for Zantac)
$0.00 $0.50 $1.00 $1.50 $2.00 $2.50 $3.00 $3.50 MediCal Reimbursement Pharmacy--Average AWP Repackage--Average AWP Average paid--Dispensing MDs Price point $/tablet Paid to pharmacies Average paid to dispensing MDs
There are several important points about this example. First, AWPs for generic drugs often bear little resemblance to the actual acquisition cost of pharmacies. In the case of Ranitidine, pharmacies were willing to dispense and, presumably profit, receiving an average reimbursement of 15% of the “reported” average “wholesale” price. Second, FUL and MAIC, when available, are virtually always the controlling prices. If pharmacies had been reimbursed at AWP – 17%, the ingredient cost would have been 540% higher. Third, AWPs for repackaged drugs are often (but not always) set even higher than the inflated AWPs reported on pharmacy-dispensed drugs. Finally, because FUL and MAIC prices do not apply to repackaged drugs, the actual paid amounts, based on AWP, can be many times higher than if the same drugs were dispensed by a pharmacy where FUL or MAIC control.
7 Average AWP as of 7/25/05 weighted to reflect the distribution of Ranitidine from different manufacturers as dispensed through pharmacies.
4.0 Impact of Physician Dispensing on California Workers’ Compensation Cost
Ranitidine is a particularly striking example of the impact of physician dispensing on employer cost. Estimating the impact of physician-dispensing across all drugs and total employer payments is more complex. Differences between physician-dispensing and pharmacy-dispensing costs depend upon a number of factors. We discuss below those factors and their impact. The following tables give examples that highlight the various issues.
Examples: Average Paid Amounts (Physician-Dispensed)
Generic Brand Name Dispensing fee/unit Ingredient paid/unit Dispensing fee/unit Ingredient paid/unit Generic (Percent of scripts) Ranitidine/Zantac 150 mg $0.12 $2.97 $0.13 $3.07 99.5% Naproxen/Naprosyn 500mg $0.15 $1.51 $0.13 $1.69 99.0%
Celebrex n/a n/a $0.15 $3.93 0.0%
Ultram/Tramadol 50 $0.11 $0.93 $0.10 $0.90 83%
Vicodin 5/500 $0.20 $0.69 n/a n/a 100%
Lidoderm 5% patch n/a n/a n/a n/a n/a
Examples: Paid Amounts (Pharmacy-Dispensed)
Generic Brand Name Dispensing fee/unit Ingredient paid/unit Dispensing fee/unit Ingredient paid/unit Generic (Percent of scripts) Ranitidine/Zantac 150 mg $0.11 $0.11 $0.17 $2.19 99.0% Naproxen/Naprosyn 500mg $0.18 $0.15 $0.20 $1.57 99.0%
Celebrex n/a n/a $0.15 $3.27 0.0%
Ultram/Tramadol 50 $0.09 $0.31 $0.16 $1.05 78.0%
Vicodin 5/500 $0.16 $0.08 $0.22 $0.67 97.0%
Lidoderm 5% patch n/a n/a $0.14 $4.96 0.0%
4.1 Professional fees
Payment for prescription drug dispensing is composed of two parts: (1) the per unit ingredient cost (discussed above); and (2) the professional or dispensing fee. The dispensing fee is a flat
rate per prescription dispensed. The dispensing fee can be an important component of a prescription’s cost, especially for generic drugs dispensed by pharmacies.
Dispensing fees do not vary much in absolute dollars. MediCal is at the upper end with a dispensing fee of $7.50/prescription. The prior OMFS, which apparently controls physician-dispensed drug professional fees, has dispensing fees of $7.25 for generics and $4.00 for brand-name drugs. Prior research by the authors found $2.00 to $2.25 typical of group health and pharmacy benefit network dispensing fees. The cost of dispensing fees per unit of drug is then largely dependent on the average size of prescriptions. In addition, the average number of units dispensed varies little depending upon whether a drug is dispensed by a physician or by a pharmacy.
An additional point to note about dispensing fees is that they are a major component of pharmacy reimbursement for generic drugs. In the examples above, they range from about 1/3rd of the reimbursement for generic Vicodin to ¾ of the reimbursement for Tramadol. For brand- name drugs dispensed by pharmacies, the dispensing fee is only a small fraction of the total paid amount. Because of the higher ingredient cost of physician-dispensed generics, the professional fee is only a small fraction of reimbursements for repackaged drugs.
4.2 Ingredient cost
Ingredient cost was discussed in detail in the example of Ranitidine. Here it is important to highlight that the spread between pharmacy reimbursement and physician reimbursement varies considerably depending on the drug and whether a brand or generic is dispensed. For example, in the table above, the spread between pharmacy-dispensed and physician-dispensed Tramadol is only about 120%, not over a 1000% as observed for Ranitidine.
The difference in ingredient cost for brand-name drugs is much smaller still. Naprosen (Brand) is very similarly priced and Ultram (Brand) is even slightly cheaper when physician-dispensed. 4.3 Brand vs. generic
Except for physician-dispensed drugs, generic versions of a drug are always much less expensive if there are multiple manufacturers. Consequently, one factor in any equation of savings is the distribution between brand and generic in the dispensing venue. Physicians virtually always dispense generics, when available. Pharmacies are required to dispense generics, except when the physician specifies no substitution. Consequently, it is unlikely that shifting dispensing between physicians and pharmacists will change the overall distribution between brand- name and generic equivalents.
For drugs, like Celebrex, where no generic equivalent was available at the time of the study, physicians are less likely to include these drugs in inventory, but when dispensed, the cost is similar to pharmacy dispensing.
When a significant fraction of a particular drug with both brand and generic versions available is dispensed as the brand-name (e.g., Ultram), savings from shifting to pharmacy/MediCal pricing will be smaller as a percent of expenditures on that particular drug. Ultram is one of the few drugs with generic equivalents where we observed more than 1% of a physician-dispensed drug type being the brand name. Brand- name drugs represent a somewhat larger portion of pharmacy prescriptions. However, this is not likely to result from any pattern of pharmacy practice. In California’s workers’ compensation system, pharmacies are required to dispense the generic
unless the doctor indicates that no substitution is allowed. Consequently, what is likely occurring is that because dispensing physicians rarely stock the brand name, scripts written for the brand are almost always filled by a pharmacy, even if the physician typically dispenses other drugs directly to patients.
4.4 Less frequently dispensed or controlled drugs
Finally, some drugs are rarely or never dispensed by physicians. In the tables above, Lidoderm is not in the sample of physician-dispensed drugs because it was so infrequently physician dispensed. Physicians have been generally more reluctant to keep narcotics in inventory, and for some DEA classifications, they virtually never stock them. Physicians appear to be less likely to stock newer brand- name drugs without generic substitutes (e.g., Ambien, Bextra), either because they do not yet prescribe them often enough, or possibly because the spread between AWP and what they are required to pay a repackager remains too narrow on these ne wer drugs. Also, there are a broad number of infrequently prescribed drugs that will not be economical for physicians to stock. For example (See Appendix 1), the top 20 drugs dispensed by physicians account for over 90% of the total dollars paid physicians. However, the top 20 pharmacy-dispensed drugs account for less than 50% of the dollars paid pharmacies. Over five times as many drugs (grouped by therapeutic equivalence, i.e., generic sequence number) appeared in the sample of pharmacy-dispensed drugs as appeared in the sample of physician- pharmacy-dispensed drugs.
4.5 Estimate of the percent impact on total workers’ compensation pharmacy cost of physician-dispensed drugs
We were provided access to a large sample of workers’ compensation pharmaceutical transactions from the Industry Claims Information System (ICIS) maintained by the California Workers’ Compensation Institute (CWCI). Pharmacy transaction data included:
• Drug description • NDC code • Units dispensed • Billed amount • Paid amount • Service data
A dataset was obtained from First Data Bank (FDB) including NDC code, pricing effective for all service dates, drug type (generic, brand), drugs in the same therapeutic class, and an identifier for repackaged drugs. MediCal pricing data was obtained from the state, including NDC code, FUL price or MAIC price, and the “no substitution” price.
These three datasets provided the tools to estimate the additional cost to employers/insurers of physician-dispensed drugs.8
Table 4.5.1 compares the average cost of physician-dispensed drugs and the same drug dispensed at a pharmacy. The drugs are ranked from top to bottom starting with the single drug (Ranitidine) responsible for the highest percentage of payments to dispensing physicians. The 23 drugs on the list account for over 90% of physician reimbursements for repackaged drugs.
The first two columns give the names of the drugs and the broad therapeutic groups into which they fall. The most common therapeutic categories are antacids, non-steroidal anti- inflamatories (NSAID), muscle relaxants, and medications for pain. The third column gives the portion of each physician-dispensed drug that was dispensed as a generic. The final four columns compare the average unit price for the generic and brand-name drug, between physician-dispensed drugs and what MediCal reimbursed, on average, during the same period.
Table 4.5.1
Top Physician Dispensed Drugs Current Physician Dispensed Cost/Unit
MediCal Pharmacy Dispensed
Cost/Unit Description Drug class
Percent of Repack
=
Generic Generic Brand Generic Brand RANITIDINE 150MG
TABLET Antacid 99.5% $3.09 $3.20 $0.22 $2.36 SOMA 350MG TABLET muscle relaxant 100.0% $2.97 $0.50 $3.85 NAPROSYN 500MG
TABLET NSAID 99.0% $1.66 $1.85 $0.33 $1.77 ULTRAM 50MG TABLET analgesic 83.0% $1.04 $1.00 $0.40 $1.21 VICODIN 5/500 TABLET pain medication Class III 100.0% $0.88 $0.24 $0.89 DARVOCET-N 100
TABLET pain medication Class IV 100.0% $0.86 $0.31 $1.22 VOLTAREN 75MG
TABLET EC NSAID 100.0% $1.66 $0.73 $2.15
MOTRIN 800MG TABLET NSAID 99.5% $0.61 $0.49 $0.18 $0.53 PIROXICAM 20MG
CAPSULE NSAID 100.0% $3.23 $0.29 $3.45
FLEXERIL 10MG TABLET muscle relaxant 100.0% $1.39 $0.45 $1.51 NAPROSYN 375MG
TABLET NSAID 100.0% $1.29 $0.30 $1.63
VICODIN ES TABLET pain medication Class III 100.0% $0.71 $0.25 $0.82 HYDROCODONE/APAP
10/650 TAB pain medication Class III 100.0% $1.25 $0.29 $1.39 LODINE 500MG TABLET NSAID 100.0% $1.72 $0.85 $1.67 CELEBREX 200MG
CAPSULE NSAID 0.0% $4.08 $2.86
NORCO 10/325 TABLET pain medication Class III 100.0% $0.87 $0.77 $1.09 LODINE 400MG TABLET NSAID 100.0% $2.12 $0.53 $1.79 CEPHALEXIN 500MG
CAPSULE antibiotic 100.0% $3.02 $0.58 $3.32 TYLENOL W/CODEINE #3
TABLET narcotic-analgesic 100.0% $0.76 $0.37 $0.69 AMBIEN 10MG TABLET sedative/hypnotics 0.0% $5.37 $3.22 DAYPRO 600MG CAPLET NSAID 100.0% $2.18 $0.12 $0.21 VIOXX 25MG TABLET Cox II inhibitor 0.0% $4.65 $2.80 ZANAFLEX 4MG TABLET muscle relaxant 100.0% $2.20 $0.89 $1.54
Table 4.5.2 extends this analysis by computing the average reduction in price if the physician-dispensed drugs had been physician-dispensed at the MediCal rate in effect on the service date. This table is the crux of the analysis. Column 7, “Overall % reduction” gives the average reduction in reimbursement for each physician-dispensed drug if dispensed at a pharmacy. The estimate is weighted for the distribution between brand-name and generic. For example, if physician-dispensed Ranitidine had been physician-dispensed by a pharmacy, on average, the cost would have been reduced by 93%. Norco (a combination of Hydrocodone [Vicodin] and Acetaminophen) would have seen a smaller reduction of 11%.
The next column calculates the impact of a change to pharmacy pricing on the total cost of physician-dispensed drugs. Again, for Ranitidine, prescriptions for this drug represented 31.2% of reimbursements for physician-dispensed drugs (column 8). Combining the information in column 7 and column 8, one can calculate that impact on the total cost of physician-dispensed drugs if any individual drug had been priced at the pharmacy level. For example, because Ranitidine accounts for such a large portion of physician-dispensed drug costs (31.2%) and the reduction is so large (93%), the effect of moving just this one drug to pharmacy pricing would be to reduce the total reimbursement to physicians for dispensing drugs by almost 29%. Because Norco accounts for a smaller portion of reimbursements (0.8%) and the reduction is smaller (11%), the impact of physician reimbursements is only 0.1%.
We analyzed these data for the full range of drugs dispensed by physicians. The total impact of switching to MediCal (pharmacy) reimbursement for physician-dispensed drugs would be to reduce the total reimbursement to dispensing physicians by 79.6%, or, stated another way, if the same drugs had been dispensed through pharmacies, the total cost would have been one- fifth of what was actually reimbursed to physicians.
Table 4.5.2
Top Physician-
Dispensed Drugs Dispensed Cost/Unit Current Physician-
MediCal Pharmacy Dispensed Cost/Unit Description Percent of Repack =
Generic Generic Brand Generic Brand
Overall Pct Change % of total Physician-dispensed reimburse-ments % change in total cost of repack RANITIDINE 150MG TABLET 99.5% $3.09 $3.20 $0.22 $2.36 -93% 31.2% -28.9% SOMA 350MG TABLET 100.0% $2.97 $0.50 $3.85 -83% 25.6% -21.3% NAPROSYN 500MG TABLET 99.0% $1.66 $1.85 $0.33 $1.77 -79% 8.6% -6.8% ULTRAM 50MG TABLET 83.0% $1.04 $1.00 $0.40 $1.21 -48% 5.2% -2.5% VICODIN 5/500 TABLET 100.0% $0.88 $0.24 $0.89 -73% 2.9% -2.1% DARVOCET-N 100 TABLET 100.0% $0.86 $0.31 $1.22 -64% 2.8% -1.8% VOLTAREN 75MG TABLET EC 100.0% $1.66 $0.73 $2.15 -56% 2.1% -1.2% MOTRIN 800MG TABLET 99.5% $0.61 $0.49 $0.18 $0.53 -70% 1.8% -1.3% PIROXICAM 20MG CAPSULE 100.0% $3.23 $0.29 $3.45 -91% 1.6% -1.5% FLEXERIL 10MG TABLET 100.0% $1.39 $0.45 $1.51 -68% 1.3% -0.9% NAPROSYN 375MG TABLET 100.0% $1.29 $0.30 $1.63 -77% 1.3% -1.0% VICODIN ES TABLET 100.0% $0.71 $0.25 $0.82 -65% 1.2% -0.8% HYDROCODONE/APAP 10/650 TAB 100.0% $1.25 $0.29 $1.39 -77% 1.1% -0.8% LODINE 500MG TABLET 100.0% $1.72 $0.85 $1.67 -51% 1.0% -0.5% CELEBREX 200MG CAPSULE 0.0% $4.08 $2.86 -30% 0.8% -0.2% NORCO 10/325 TABLET 100.0% $0.87 $0.77 $1.09 -11% 0.8% -0.1% LODINE 400MG TABLET 100.0% $2.12 $0.53 $1.79 -75% 0.8% -0.6% CEPHALEXIN 500MG CAPSULE 100.0% $3.02 $0.58 $3.32 -81% 0.7% -0.6% TYLENOL W/CODEINE #3 TABLET 100.0% $0.76 $0.37 $0.69 -51% 0.7% -0.4% AMBIEN 10MG TABLET 0.0% $5.37 $3.22 -40% 0.5% -0.2% DAYPRO 600MG CAPLET 100.0% $2.18 $0.12 $0.21 -95% 0.4% -0.4% VIOXX 25MG TABLET 0.0% $4.65 $2.80 -40% 0.3% -0.1% ZANAFLEX 4MG TABLET 100.0% $2.20 $0.89 $1.54 -59% 0.2% -0.1%
4.6 Estimate of the total cost impact of physician-dispensed drugs
According to the latest Workers’ Compensation Insurance Rating Bureau (WCIRB) of California report on “Workers Compensation Losses and Expenses,” (2006), prescription-drug expenses for insured employers were $436 million for calendar-year 2005. Insured employers account for approximately 72% of the total market in 2005. Consequently, we can estimate that total prescription reimbursements for all employers were approximately $600 million. Using 8%, a conservative estimate of the average annual growth in prescription drug costs for all health care, we estimate that prescription-drug cost for the current calendar year (2006) will be $471 million for insured employers and $649 million for all employers.
From an insured-employer perspective, the most important estimate is incurred cost, as this determines how much employers actually pay: estimated incurred costs are the basis for premium setting. Because incurred costs represent what will be paid on the current policy- year claims often many years in the future, a rule of thumb used in previous CHSWC studies, is that incurred costs are two times current paid amounts.9 In addition, insurer premiums are set at a multiple to direct costs (pure premium rates set by the WCIRB and Department of Insurance). The multiple is expected to cover administrative costs, taxes, commissions, and profits. While this number varies over time, another decent rule of thumb is that premiums are set at 1.3 times estimated direct costs. Based on these rules, one can estimate that the total incurred cost of prescription drugs on policy year 2006 claims will be $942 million (2 x $471 million) and the total cost to insured employers for prescription drugs, including administrative costs, will be approximately $1,225 million for policies incepting in 2006.
For the study, we reviewed a very large sample of workers’ compensation prescription-drug claims. Focusing on calendar-year 2004, after the new MediCal- linked fee schedule was adopted, we found that phys ician-dispensed drugs accounted for 30.3% of prescriptions written and 50.8% of all payments for prescription drugs. Consequently, estimated payments to physicians for dispensing prescription drugs during the 2006 calendar year will amount to $330 million.
Because, on average, physician-dispensed drugs cost four times what the same drug costs when dispensed by a pharmacy, the total impact of physician-dispensed drugs on the paid and incurred costs for employers can be estimated as follows:
• Paid amounts (all employers) for 2006 will be $263 million higher because of physician dispensing.
• Incurred amounts, for insurers, will be $379 million higher than if all prescriptions were dispensed through pharmacies.
• Insured-employer premiums for policy-year 2006 will be $490 million higher than if all prescriptions were dispensed through pharmacies.
• Premium paid by insured employers will be 2.2% higher for policy- year 2006 than if all prescriptions were dispensed through pharmacies.
9 This is somewhat conservative for an area like pharmaceuticals where the annual growth rates are quite high and likely to over-estimate somewhat for benefit areas like permanent disability, where benefits are fixed as of the injury date.
5.0 Other Cost-benefit Issues
A number of issues have been raised by proponents and opponents of physician dispensing:
• For physician dispensing:
o Improved access to prescriptions for workers, o Better compliance with ideal drug regiment,
o Improved health outcomes, because of better compliance,
o Physicians better able to deliver time-critical, lifesaving therapies that would otherwise be delayed, and
o Better patient information and hence safer drug therapy, particularly for non-English speaking workers.
• Against physician dispensing:
o Higher cost (discussed above),
o Increased incentive for physicians to over-prescribe,
o Increased incentive for physicians to prescribe “what’s on the shelf” rather than best drug available,
o Limited patient information, and o Reduced safety checks.
Some of the above issues cannot be answered definitively with the data and research at hand. However, the important issues can be informed by the data prepared for this project and from additional information from a review of prior published research.
5.1 Physician dispensing compensates for problems with access to pharmacy dispensing in workers’ compensation
In March 2000, Neuhauser et al. published a study on the accessibility of pharmacies to injured workers. At that time, some stakeholders speculated that fee-schedule changes in the reimbursement level of pharmaceuticals would lead to fewer pharmacies participating in the workers’ compensatio n system. This potential exodus of pharmacies, it was argued, would create an access problem for injured workers. For this report, researchers analyzed the proximity of 1.5 million injured workers against a database of pharmacies that were accepting workers’ compensation prescriptions. The results showed that at the time, California injured workers had to travel an average of 2.0 miles from their home to the closest pharmacy and had an average of 5 pharmacies within a 4-1/2 mile radius of their homes. It was noted that these estimates were conservative, as hospitals, clinics, physician offices and other facilities that also dispense drugs were not included in the analysis.
Given the adoption of the new fee schedule with its significant reduction in fee-schedule reimbursement levels from the prior fee schedule, the question of access has reemerged. Some of the same stakeholders who previously speculated that fee-schedule adjustments would compromise injured workers’ access to medications again have voiced concern over a potential reluctance of California’s pharmacies to continue to support the workers’ compensation system. In order to revisit the access issue, the aforementioned access analysis has been updated with current data. The new analysis uses data on more than 1 million injured workers and a revised list of pharmacies that accepted workers’ compensation prescriptions in 2004. The results are displayed in the chart below, with comparative results summarized in Table 5.1.1.
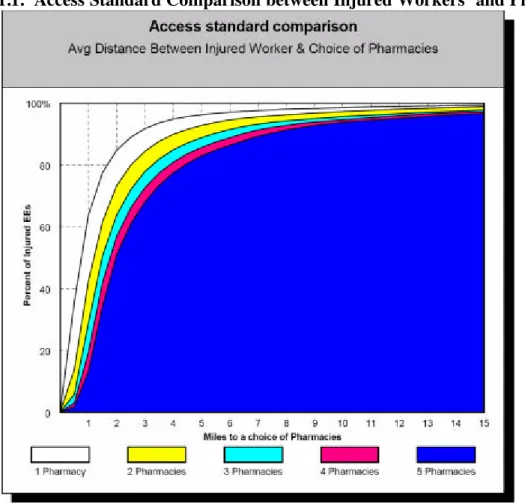
Chart 5.1.1. Access Standard Comparison between Injured Workers’ and Pharmacies
Chart 5.1.1 shows that more than 80 percent of California’s injured workers have a pharmacy that fills workers’ compensation prescriptions within 2 miles of their home. Almost 95 percent of injured workers have a pharmacy within 4 miles.
Table 5.1.1 compares the results of the prior 2000 analysis against 2004 revised and updated injured-worker and pharmacy- location data.
Table 5.1.1. Average Distance between Injured Worker & Choice of Pharmacies
Average Distance Between Injured Worker & Choice of Workers' Comp Pharmacies
Study Group 1 1 to 2 1 to 3 1 to 4 1 to 5
Original Study (Pre-2004 Fee Schedule) 2.0 2.7 3.4 3.9 4.5 Follow- up Study (under current 2004 Fee
Schedule) 1.2 2.0 2.5 3.0 3.5
Percent Difference -40.0% -25.9% -26.5% -23.1% -22.2%
The new data show that injured workers live within an average of 1.2 miles of a pharmacy that fills workers’ compensation prescriptions, a 40 percent reduction from the average of 2 miles noted in the 2000 study. Furthermore, the new study shows that on average, injured workers now have a choice of up to 5 pharmacies within 3.5 miles of their homes, compared to 4.5 miles in the
2000 study. This significant improvement in access is due in part to an increase in the number of pharmacies in California.
Other stakeholders have asserted that a change in reimbursement levels for repackaged drugs will result in physicians withdrawing from providing repackaged drugs, the result of which would cause another form of compromised access for injured workers. The authors also explored the association between physicians who dispense repackaged drugs and nearby pharmacies that routinely fill workers’ compensation prescriptions.
Table 5.1.2. Access: Average Distance between Repackaged Drug Dispensing MD to Choice of Pharmacies10
Distance from Repackaged Drug Dispensing MD to Choice of Pharmacies (in miles)
1 1 to 2 1 to 3 1 to 4 1 to 5 Total
Median 0.5 0.9 1.1 1.3 1.5 1.1
Mean 0.8 1.2 1.6 1.9 2.2 1.6
Table 5.1.2 shows that on average, injured workers need travel less than one mile from their physician’s office to access a pharmacy to fill their workers’ compensation prescription. Injured workers would have a choice of 5 pharmacies within 2.2 miles from their repackaged drug- dispensing physician.
We conclude that there is no evidence that prior to new pharmacy schedule, reimbursement rates compromised workers’ access to pharmacies willing to dispense drugs under workers’ compensation. Subsequently, there remains on evidence that workers’ access to pharmacies willing to fill workers’ compensation prescriptions has been reduced. If anything, access is at least as good in the post-SB 228 environment, if not better.
5.2 Physician dispensing leads to better compliance with drug regimes and, consequently, better health outcomes.
A major thrust of arguments in favor of physician dispensing revolves around better patient care and, ultimately, better health outcomes. The contention is that if physicians dispense directly to patients, patients will be more likely to obtain the drugs and, consequently, more likely to follow the appropriate regime. In turn, this will lead to better health outcomes.
This argument certainly has some validity. It is undeniable that if the drug is dispensed by the physician, then patients are more likely (100% of the time) to obtain a prescription than if they have to fill the prescription at a pharmacy (something less than 100% of the time). However, the impact on health outcomes is unclear. For example, the most common physician-dispensed drug is Ranitidine, an antacid typically prescribed for important, but infrequent side-effects for medium to long-term treatment with NSAIDs for conditions such as arthritis or chronic pain. One can imagine that patients fill prescriptions for side effects whenever the discomfort from the side effects due to the primary medication exceeds the anticipated side effects from the secondary medication and the burden of filling the prescription. Since all medications carry the
risk of negative side effects, it is appropriate to think that some threshold burden on filling the prescription is beneficial. Consider another example, opiate-based pain relievers. Does anyone argue that prophylactic dispensing of opiates in cases where pain is not an issue but might become an issue is appropriate?
The literature here is mixed. Osterberg and Blaschke (2005) present an extensive review article on compliance issues, listing major barriers to compliance with the prescribed drug regime, but never identify dispensing by physicians as a positive or negative factor. This suggests that at least peer-review research is silent on the advantage/disadvantages of physician dispensing on compliance. Ginde, et al. (2003) selected patients because they were candidates for antibiotics and the appropriate regime was important and clearly defined. The authors found a lower percentage of patients obtained drugs when directed to a pharmacy (at no cost) vs. when the prescription was received directly from the hospital after visiting the emergency department. However, actual compliance with the regime, based on self- reports, was the same and return visits to the emergency department were similar. The Ginde study was the only study reviewed that even attempted to link physician dispensing with outcomes.
5.3 Incentive for physician to over-prescribe (or prescribe “what’s on the shelf”)
One of the most common and important concerns raised by opponents of physician dispensing is that physicians who profit on the dispensing side may respond to the incentive by prescribing more drugs or the same drugs more often than non-dispensing physicians. Assuming that physicians without a profit incentive prescribe appropriately, opponents would argue that any additional scripts represent over-prescribing.
Physician dispensing of pharmaceuticals can be seen as a special case of a fairly large body of research addressing “physician induced demand” in health-care economics. Pertinent to the issue here, this research has consistently found that when physicians have a financial interest in a particular auxiliary service, the incentive tends to drive increased utilization. That utilization is generally interpreted as excess treatment. However, while the literature consistently finds much higher utilization when the physician has a financial interest in the ancillary service, the literature is not as strong at demonstrating that the services represent over-utilization rather than a more appropriate level of utilization relative to non-referring physicians.
Incentives for physician referral to physician-owned laboratories for medical testing ha s been extensively evaluated. The research on physician-owned laboratories was sufficiently compelling that Congress enacted national legislation restricting physician financial interest in medical laboratories (Iglehart, J. K., 1990, 1991). This was probably the initial thrust of statutory and regulatory restrictions on physician “self-referral” in the face of convincing evidence of higher-utilization driven by financial incentives.
Physician “self-referral” to imaging at centers where the referring physician had a financial interest or when the imaging was done within the doctor’s office, was the subject of extensive research in the 1980s and early 1990s. Hilman, et al., 1990, 1992; Mitchell, J.M. and Scott, E., 1992; and Kouri, Parsons and Alpert, 2002, among others, found evidence of substantially increased utilization of diagnostic imaging when physicians had a direct financial interest in the imaging process. Swedlow et al, (1992) made similar findings specific to workers’ compensation.
Research on the impact of physician dispensing on pharmaceutical use and health outcomes is more limited, particularly in the U.S. Much of the research and commentary occurred during the 1980s and surrounded federal decisions regarding Medicare/Medicaid prescriptions drugs. Medicaid generally prohibits payment for repackaged drugs and otherwise limits payments to a schedule of payments based on reimbursements to pharmacies.
More recently, the issue has risen to prominence because of the dramatically increasing importance of pharmaceuticals as a portion of total health-care costs. But, not much has been written about the extent of physician dispensing or its impact. Abood (1989) was the only reference identified that estimated the extent of physician dispensing, 1/10th of 1% of scripts. In addition, much of the research and commentary are being generated outside the U.S. and/or in journals associated with pharmacy professional association, presenting a potential for bias. In particular, pharmacists have seen the increase in physician dispensing as a challenge to their income and have responded with aggressive efforts to emphasize the importance of the role of the pharmacist. Gilbert (1998) discusses much of the tension between pharmacists and dispensing doctors, using the perspective of South Africa. Axon (1993), in a pharmacy research journal, referencing studies in several countries including the UK and Japan, makes the statement that “It is important in any campaign to know your enemy, but it is vital to ensure that the enemy is a common one. The first task was to ask ourselves what we mean by the term ‘dispensing doctor.’” Subsequently, Axon references a UK study, not identified, to say that dispensing doctors issued 12.9% more prescriptions than non-dispensing colleagues, at an additional 10.3% higher expenditure per patient. Nelson (1987) argues that physicians “might” dispense what is on the shelf, while Adritz and Rogan, pharmacy college professors, argue that benefits to patient of physician dispensing are over-estimated. Vivian et al. (2006) argue for a narrow legal interpretation of statutes regarding physician dispensing.11
On the other hand, physicians and medical associations actively protect their professional turf. Lober et al. (1988) proffer a non-empirically based, review article supporting physician dispensing. And certainly in the recent California debate both physicians and the distributors of repackaged drugs have marshaled several studies purporting to support the advantages of physician dispensing. Again, these studies are generally driven by the particular professional perspective of the author(s).
Independent research literature has generally found that physician dispensing leads to higher utilization of prescriptions drugs. In addition, some literature also finds the increased utilization is also associated with inappropriate or excess dispensing. Gilbert (1998) found dispensing-physicians averaged 2.38 scripts per patient while non-dispensers average 1.67. It is not clear whether the study cont rolled for differences in medical specialty, patients, etc. Axon. (1994), in England, found dispensing doctors issued 12.9% more scripts. Again, it is not clear what conditions were imposed to control for differences in patient characteristics or conditions. Trapp and Hansen (2002a, 2002b), in Zimbabwe, find dispensing doctors did not differ by rationality of drug prescribing which was poor for both dispensing and non-dispensing physicians. However, dispensing doctors prescribed sub-curative doses significantly more often and prescribed correct doses significantly less often. Park, et al. (2005) found that in Korea, after imposition of restrictions on physician dispensing, antibiotic prescribing declined substantially for patients with viral illnesses (inappropriate use of antibiotics) and only minimally for patients with bacterial illnesses (appropriate use of antibiotics). The dispensing restrictions also reduced the
prescribing of non-antibiotic drugs. Nizami et al. (1996), doing a study in Pakistan, found dispensing doctors under-prescribe oral re-hydration salt (ORS), the cheapest, first- level response, and over prescribe of anti-diarrhea medications relative to doctors that do not dispense. Trap, B and E. Hansen, (2002), find dispensing physicians contributed to increasing health hazards, cost, and risk of developing bacterial resistance, by inappropriately prescribing antibiotics.
The data prepared for this study can not be used to address directly the question of whether physician dispensing changes a physician’s prescribing practices. The prescriptions were not linked to individual claims or individual physicians. However, some dramatic differences between the distribution of drugs between dispensing and non-dispensing physicians suggest that their prescribing practices differ.
A review of the Tables in Appendix 1 shows substantial differences between the drugs most frequently dispensed by physicians and pharmacists. Some of these differences can be explained by other issues discussed in the Append ix, e.g., dispensing physicians are less likely to dispense low- margin, single-source, brand-name drugs, drugs on DEA restricted lists, and infrequently prescribed drugs. However, some of the differences are difficult to explain except as incentive- drive n prescribing practices. For example, although 70% of scripts are pharmacy-dispensed, 9 out of 10 prescriptions for Ranitidine are physician-dispensed. Ranitidine, as noted early, has one of the highest mark-ups associated with repackaged drugs, 1,750% of pharmacy reimbursement for the same ingredient portion. About ¾ or scripts for Carisprodol/Soma (a commonly dispensed muscle relaxant) are dispensed by physicians. Again, Carisprodol is also associated with a very high mark- up when dispensed by physicians. These two drugs alone account for 57% of all dollars paid for drugs dispensed by physicians, but only 2.6% of amounts paid to pharmacies.
5.4 Claim: Eliminating physician-dispensing would endanger patients by limiting access to time-critical, life-saving medications
This claim has been made several times in different forums by proponents of physician dispensing. However, nothing in the data reviewed supports this contention. A review of the top 50 repackaged drugs does not reveal the types of drugs that might be considered time-critical, life-saving prescriptions.
5.5 Information and safety
Both proponents and opponents of physician dispensing claim the high ground on information and safety. There is no definitive literature on this issue and empirically, it would be complex to establish which venue is the safest for dispensing. However, it is difficult to understand, logically, why physician dispensing would result in better information being communicated to the patient than pharmacy dispensing, especially in an occupational- medicine setting. First, proponents argue that physicians will give better or more complete information than pharmacists. However, it is not clear why physicians would give different information depending on the source of dispensing. We expect that physicians will give full and complete information to their patients whether they dispense or not. On the other hand, pharmacy dispensing allows another opportunity to communicate appropriate information to patients that should only reinforce safer dispensing and consumption.
One concern raised about physician dispensing within occupational medicine is potential problems with drug interactions. Occupational physicians may not be completely or accurately
informed about all medications the patient takes for non-occupational conditions. If the worker is using the same pharmacist for all medications, there is an additional check on potential drug interactions.
Finally, both proponents and opponents raise the issue of language barriers and potential safety problems. Here again, it is difficult to find logical support for physician dispensing leading to better information. It would seem that a physician, selected by the employer, will be no more likely to speak the native language of a non-English speaking worker than the pharmacist selected by the worker. Also, it would only seem to increase the chances of appropriate communication to have cautions communicated from both sources rather than either one alone.
6.0 Conclusions
Physician-dispensed prescription drugs comprise a significant portion of all pharmaceutical prescriptions dispensed in California’s workers’ compensation system. Because of limits on the reach of statute and regulations adopted under SB 228, physician-dispensed pharmaceuticals are also much more expensive than the same drugs dispensed through a pharmacy. This report documents the extra costs placed on the system by physician-dispensed drugs. The report also reviews research on both the positive and negative impacts of physician dispensing, including the main arguments raised by proponents at CHSWC meetings and at DWC regulatory hearings. Main findings on the direct cost of physician-dispensed drugs:
• Physician dispensing is much more common than most observers expected. 30.3% of prescriptions dispensed in the California workers’ compensation system are dispensed by physicians directly from their offices.
• Approximately half (50.8%) of the total cost of pharmaceuticals in the system is paid to physicians for prescriptions dispensed from their offices.
• Because of the structure of the OMFS, physician-dispensed pharmaceuticals are much more costly than the same drugs dispensed by a pharmacy. On average, physician-dispensed drugs cost 490% of what is paid to pharmacies. In some cases, including the most commonly prescribed drug dispensed by physicians, the mark-up exceeds 1000%.
• We estimate that for calendar- year 2006, insurers and self- insured employers will pay $649 million for prescription drugs. Of this paid amount, $263 million will be paid to dispensing physicians in excess of what would have been paid for the same drugs if dispensed by a pharmacy.
• It is estimated that insured employers will face premiums for the 2006 policy year that are $490 million dollars higher than if all drugs were dispensed through pharmacies. This represents 2.2% of premium for the policy year.
Other findings on costs and benefits:
• The research literature on the subject of physician-dispensed drugs generally argues that physician dispensing leads to increased, possibly inappropriate, use of prescription drugs. The studies have usually been done outside the U.S., and the results cannot necessarily be generalized to the California workers’ compensation. However, research on physician practices with similar incentives, such as self-referral for lab tests or imaging, has consistently found that incentives inherent in self-referral lead to over-utilization.
• The data in this study were not designed to determine whether physician dispensing led to increased utilization or changes in the types of drugs prescribed. However, the study does find striking differences in the types of drugs dispensed by physicians and pharmacies.
This research could be extended to allow more thorough analysis of how financial incentives may change prescribing practices.
• Research finds only weak evidence for better compliance with drug regimes when the physician dispenses directly to the patient. There is virtually no research demonstrating better health outcomes or more rapid recovery when physicians dispense.
• It would be important to extend the research in this study to examine whether extensive use of physician dispensing does affect health outcomes, and if so, whether the effect is positive or negative.
References:
Abood, R.R., “Physician dispensing: issues of law, legislation and social policy.” American Journal of Law and Medicine, 14(4), 1989.
Andritz, M. H. and M.P. Rogan, “Drug dispensing by physicians: promoter’s claims examined.” Pediatrics, 82(3), 1988.
Axon, Stephen R., “Dispensing doctors—an international perspective.” Journal of Social and Administrative Pharmacy, 11(3), 1994.
Gilbert, L., “Dispensing doctors and prescribing pharmacists: A South African perspective.” Soc. Sci. Med. 46(1) 83-95. 1998.
Ginde, A A., BC Von Harz, D. Turnbow, and LM Lewis, “The effect of ED prescription on dispensing on patient compliance.” American Journal of Emergency Medicine, 2003, 21(4). Hillman, B.J., C.A. Joseph, M.R. Mabry, J.H. Sunshine, D. Kennedy, and M. Noether, “Frequency and costs of diagnostic imaging in office practice—a comparison of self- referring and radiologist-referring physicians.” New England Journal of Medicine, 323(23), 1990.
Hillman, B.J., G.T. Olson, P.E. Griffith, J.H. Sunshine, C.A. Joseph, S.D. Kennedy, W.R. Nelson and L.B. Bernhardt, “Physicians’ utilization and charges for outpatient diagnostic imaging in a Medicare population.” JAMA 268(15) 1992.
Iglehart, J.K., “Congress moves to regulate self-referral and physicians’ ownership of laboratories.” New England Journal of Medicine, 322(23) 1990.
Iglehart, J.K., “Efforts to address the problem of physician self- referral.” New England Journal of Medicine, 325(25) 1991.
Kouri, D.E., R.G. Parsons, and H.R. Alpert, “Physician self-referral for diagnostic imaging: review of the empiric literature.” American Journal of Roentgenology, 179(4) 2002.
Lober, C. W., S.D. Behlmer, N. S. Penneys, J.L. Shupack, and B. H. Thiers, “Physician drug dispensing.” J. of American Academy of Dermatology, 19(5), 1988.
Mitchell, J.M., and E. Scott, “Physician self- referral: empirical evidence and policy implications.” Advance Health Economics and Health Services Research, vol 13, 1992.
Nelson, S., “Drug dispensing by MDs stirs controversy.” Hospitals 61, 1987.
Neuhauser, F, A. Swedlow, E. Edelstein, and L. Gardner, “Study of the cost of pharmaceuticals in workers’ compensation.” Report for the Commission on Health and Safety and Workers’ Compensation. San Francisco, CA. 2000.
Nizami, S.Q., I. A. Khan, and Z. A. Bhutta, “ Drug prescribing practices of general practitioners an pediatricians for childhood diarrhea in Karachi, Pakistan.” Social Science and Medicine,” 42(8), April, 1996, 1133-1139.
Osterberg, L. and T. Blaschke, “Adherence to Medication.” New England Journal of Medicine, 353(5), August, 4, 2005.
Park, S., S. Soumerai, A. Adams, “Antibiotic use following a Korean national policy to prohibit medication-dispensing by physicians.” Health Policy and Planning 20 (5), September, 2005. Ryan, M. and C. Bond, “Dispensing physicians and prescribing pharmacists: economic consideration for the UK.” Pharmacoeconomics, 5(1), 1994.
Trap, B., and E. Hansen, “Cotrimoxazole prescribing by dispensing and non-dispensing doctors: do they differ in rationality?” Tropical Medicine and International Health, 7(10) 878-885, Oct. 2002.
Swedlow, A, G. Johnson, N. Smithline, and A. Milstein, “Increased costs and rates of use in the California workers’ compensation system as a result of self- referral by physicians.” New England Journal of Medicine, 327(21) 1992.
Trap, B, E. Hansen, and H. Hoberzeil, “Prescription habits of dispensing and non-dispensing doctors in Zimbabwe.” Health Policy and Planning, 17(3) 2002. 288-95.
Vivian, J. C., “Physician-owned pharmacies.” U.S. Pharmacist, March, 2006.
WCIRB, “2005—Losses and Expenses.” Workers’ Compensation Insurance Rating Bureau, San Francisco, CA. 2006.
Appendix 1: Tables showing top 50 drugs by total cost and number of scripts
The following tables identify the top 50 drugs separately by the number of scripts written and total cost. The tables allow comparisons between the distribution of drugs prescribed and dispensed by physicians and those where the physician prescribes, but the drugs are dispensed by a pharmacy.
The tables need to be evaluated with some care. Physicians cannot not dispense the full range of drugs available. They will not find it convenient and/or profitable to maintain inventories of infrequently prescribed drugs. They may also find it unprofitable to maintain inventories of drugs that have low-profit margins, given that they dispense much less frequently than a pharmacy and each individual transaction may be more costly to inventory and dispense than with a high-volume pharmacy. Brand-name drugs without a generic equivalent is a class of drugs where the profit margin is lower than for drugs commonly dispensed as generics. Consequently, infrequently prescribed drugs, like specialized antibiotics and brand-name drugs without a generic equivalent, like Bextra, will be over-represented in pharmacy dispensing.
On the other hand, frequently prescribed drugs with broad application in occupational medicine are more appropriately compared between the two dispensing venues. In any case, the bias of any comparison is that a drug will be over-represented within pharmacy dispensing.
There are several and sometimes dozens of drugs within a therapeutic class. Drugs may have therapeutic advantages in particular cases, specific drug interactions with other medications the worker may be taking, or problematic side effects for any particular patient. Dispensing physicians cannot maintain as broad a selection of drugs as pharmacies, whose primary business is dispensing. Consequently, if physicians are not limiting their choice of the best drug to prescribe by what is “available on the shelf,” they will shift to pharmacies, at least to some extent, the process of dispensing all but the most commonly prescribed drugs. Therefore, the drugs universally maintained in inventory will be somewhat over-represented in the distribution of physician-dispensed drugs. Drugs infrequently maintained in physician-dispensed inventories will be over-represented in pharmacy dispensing relative to physician dispensing, because dispensing physicians may prescribe those drugs, but have them filled at a pharmacy.
The tables are arranged in three sets of two tables. The first set of tables lists the top 50 drugs dispensed in workers’ compensation, regardless of where they were dispensed, a physician’s office or pharmacy. The second pair of tables gives the top 50 drugs among those dispensed from physician offices. The third set gives the top 50 drugs as dispensed by pharmacies. Within each of these three sets, the first table gives the top 50 drugs by total cost and the second table gives the top 50 by number of scripts dispensed.