This 2008 Integrated Resource Plan Update (2008 IRP Update) Report is based upon the
best available information at the time of preparation. The IRP action plan will be
implemented as described herein, but is subject to change as new information becomes
available or as circumstances change. It is PacifiCorp’s intention to revisit and refresh
the IRP action plan no less frequently than annually. Any updated IRP action plan will
be submitted to the State Commissions for informational purposes or as required by
their respective IRP preparation and filing rules.
For more information, contact:
PacifiCorp
IRP Resource Planning
825 N.E. Multnomah, Suite 600
Portland, Oregon 97232 (503) 813‐5245 IRP@PacifiCorp.com http://www.PacifiCorp.com
This report is printed on recycled paper
Cover Photos (Left to Right):
Wind: Foote Creek 1
Hydroelectric Generation: Yale Reservoir (Washington)
Demand side management: Agricultural Irrigation
Thermal‐Gas: Currant Creek Power Plant
Transmission: South Central Wyoming line
T
T
AABBLLEEOOFFC
C
OONNTTEENNTTSS
Table of Contents ... 1
Tables and Figures ... 2
Executive Summary ... 4
1. Introduction ... 14
2. Planning Environment ... 15
Business Plan Development ... 15
Resource Procurement Update ... 16
All Source Request for Proposals ... 16
Renewables Requests for Proposals ... 16
Demand‐side Management Requests for Proposals ... 16
Emissions and Climate Change Policy ... 17
Currently Regulated Emissions ... 17
Climate Change ... 18
Environmental Protection Agency’s Advance Notice of Public Rulemaking ... 19
Impacts and Sources ... 21
EPRI analysis of Waxman‐Markey ... 21
Energy Gateway Transmission Program Planning ... 22
3. Resource Needs Assessment Update ... 25
Load Forecast ... 25
Changes to Existing and Firm Planned Resources ... 27
Existing Supply‐Side Resources ... 27
Existing Demand‐side Management ... 28
Firm Planned Supply‐Side Resources ... 29
Firm Planned Demand‐side Management ... 29
Updated Capacity Balance ... 30
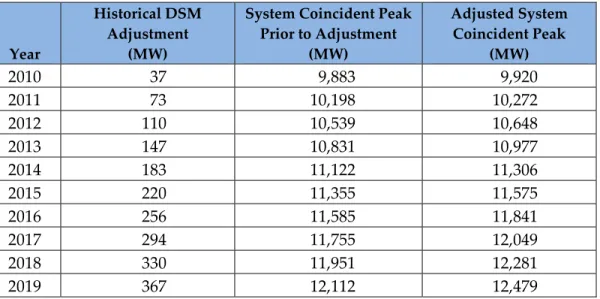
Historical DSM Adjustment ... 30
4. Modeling Assumptions Update ... 36
Natural Gas and Power Market Price Updates ... 36
Natural Gas Market Prices ... 36
Power Market Prices ... 37
Carbon Dioxide Emissions Cost and Compliance ... 39
Transmission Topology ... 40
Front Office Transactions ... 41
Preliminary 2010 Business Plan Scenario ... 45
2010 Business Plan Submissions ... 46
Resource Modeling Strategies ... 46
Thermal Resources ... 46
Class 1 Demand‐side management ... 46
Class 2 Demand‐side Management ... 47
Renewable Resources ... 48
Front Office Transactions ... 48
Combined Heat and Power ... 48
Business Plan Portfolio ... 48
Compliance with Renewable Portfolio Standard Requirements ... 54
6. Action Plan Update ... 55
Appendix A – Additional Load Forecast and Resource Portfolio Information ... 67
October 2009 Load Forecast ... 67
Detailed 2010 Business Plan Portfolio ... 68
T
T
AABBLLEESSAANNDDF
F
IIGGUURREESS Table ES.1 – 2010 Business Plan Portfolio ... 7 Table ES.2 – IRP Action Plan Update ... 8 Table 2.1 – Comparison of Waxman‐Markey and Kerry‐Boxer bills ... 19 Table 3.1 – Forecasted Annual Load Growth, 2010 through 2019 (Megawatt‐hours) ... 25 Table 3.2 – Forecasted Annual Coincidental Peak Load (Megawatts) ... 25 Table 3.3 – Annual Load Growth Change: October 2009 Forecast Less February 2009 Forecast . 26 Table 3.4 – Annual Coincidental Peak Growth Change: October 2009 Forecast Less February 2009 Forecast ... 26 Table 3.5 – Renewable Resource Additions ... 27 Table 3.6 – Contract Additions: Front Office Transactions ... 28 Table 3.7 – Changes to Firm‐Planned Resources ... 29 Table 3.8 – Historical DSM Adjustment to Coincident Peak Forecast ... 30 Table 3.9 – Capacity Load and Resource Balance, Megawatts (12% Target Reserve Margin) ... 33 Table 3.10 – 2010 Business Plan Capacity Balance Less 2008 IRP Capacity Balance, Megawatts . 34 Table 4.1 – Comparison of Carbon Dioxide Emissions Modeling Assumptions ... 40 Table 4.2 – Front Office Transaction Annual Limit Assumptions... 42 Table 4.3 – Resource Capital Cost Comparison, 2010 Business Plan vs. 2008 IRP ... 43 Table 5.1 – Class 1 Demand‐side Management Cumulative Additions ... 46 Table 5.2 – New Class 1 Demand‐side Management Capacity Comparison ... 47 Table 5.3 – 2010 Business Plan Portfolio ... 49 Table 5.4 – 2008 IRP Preferred Portfolio ... 49 Table 5.5 – Resource Differences, 2010 Business Plan Less 2008 IRP Preferred Portfolio ... 50Table 5.6 – Portfolio Load and Resource Balance with Additions (Megawatts) ... 52 Table 5.7 – Differences: Load and Resource Balance 2008 IRP versus 2008 IRP Update (Megawatts) ... 53 Table 6.1 – IRP Action Plan Update... 56 Table A.1 – Post‐DSM: Annual Forecasted Loads in Megawatt‐hours ... 67 Table A.2 – Post‐DSM: Annual Forecasted Coincidental Peak Loads in Megawatts ... 67 Table A.3 – Class 2 DSM Megawatt‐hours included in Post‐DSM Load Forecast, 2010‐2019 ... 68 Table A.4 – 2010 Business Plan Resource Portfolio (2010‐2028) ... 69 Figure ES.1 – Capacity Position Comparison, 2008 IRP versus the 2010 Business Plan ... 6 Figure 2.1 – Environmental Regulatory Timeline at the Federal Level ... 18 Figure 3.1 – Capacity Position Comparison, 2008 IRP versus the 2010 Business Plan ... 31 Figure 3.2 – System Coincident Peak Loads and Resources, 2010 Business Plan ... 32 Figure 4.1 – Henry Hub Natural Gas Prices (Nominal) ... 37 Figure 4.2 – Average Annual Flat Palo Verde Electricity Prices ... 38 Figure 4.3 – Average Annual Heavy Load Hour Palo Verde Electricity Prices ... 38 Figure 4.4 – Average Annual Flat Mid‐Columbia Electricity Prices ... 39 Figure 4.5 – Transmission Topology ... 41 Figure 5.1 – Annual State and Federal RPS position Forecasts ... 54
E
E
XXEECCUUTTIIVVEES
S
UUMMMMAARRYYThis 2008 Integrated Resource Plan (IRP) update report describes resource planning
activities that occurred subsequent to the filing of the 2008 Integrated Resource Plan in
May 2009, and presents the Company’s revised 10‐year resource portfolio and IRP
action plan.1 These activities centered on preparation of the Company’s 10‐year business
plan for the period 2010‐2019 (“2010 business plan”).
Preparation of the 2010 business plan occurred against the back‐drop of the economic
recession and lower load growth; a tight credit market; the continuing need for large
capital expenditures to support load growth, system reliability, emission controls and
other regulatory mandates; and ongoing uncertainty regarding government policies on
climate change and clean energy. As a consequence, PacifiCorp reexamined the need
and timing for capital investments and, where appropriate and feasible, the business
plan eliminates or defers resource investments.
Against this backdrop, allocating capital for transmission expansion is a precondition
for maintaining transmission system reliability, supporting future load obligations, and
accessing new and existing resource areas. PacifiCorp also assumed that making
investments in environmental controls for sulfur oxides (SOX) and nitrous oxides (NOX)
was needed unless the emission control requirements are modified.
Another key business planning consideration is the progress and challenges associated
with the Energy Gateway transmission expansion project. Construction of the first
segment (Populus to Terminal) is underway and remains on schedule for completion in
2010. In an effort to maintain schedule flexibility for future segments, in‐service dates
have been updated to provide flexibility while maintaining the urgency to complete the
project. These date adjustments, combined with the lack of additional transmission
capacity on the existing system, prompted deferral of planned wind resources
dependent on the availability of new transmission. PacifiCorp will continue its focus on
maintaining system reliability and efficient use of new and existing transmission as
additional operational experience is gained with large‐scale and rapid wind penetration
in certain areas of the system.
As an extension of ongoing transmission planning efforts, Idaho Power and PacifiCorp
also recently signed a Memorandum of Understanding (“MOU”) that outlines a process
to fully define and develop joint ownership of extensive transmission facilities,
1
Action plan revisions reflect modified resource strategies reflecting the current planning environment, as well as revised or new action items adopted by the Company as part of the 2008 IRP acknowledgment proceedings.
including the Boardman to Hemingway transmission project and the Gateway West
Project. The two companies already share a partnership on Gateway West. Joint
ownership of the Hemingway to Boardman project is a new development and is
expected to replace further near‐term review and consideration of the Hemingway to
Captain Jack project listed as “under review” in the 2008 IRP.
At least two factors could change the Company’s decision to defer additional renewable
energy resources until 2017. First, as the particulars regarding federal emissions
reduction regulations become clearer, it may be prudent to resume adding renewable
energy sooner than 2017. Second, the Company remains open to acquiring renewable
energy projects that represent economically attractive and unique opportunities for its
customers. This aspect of the updated IRP action plan remains unchanged.
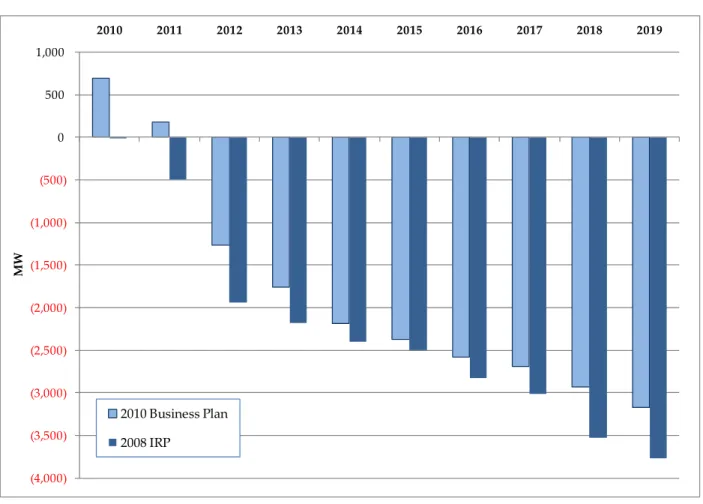
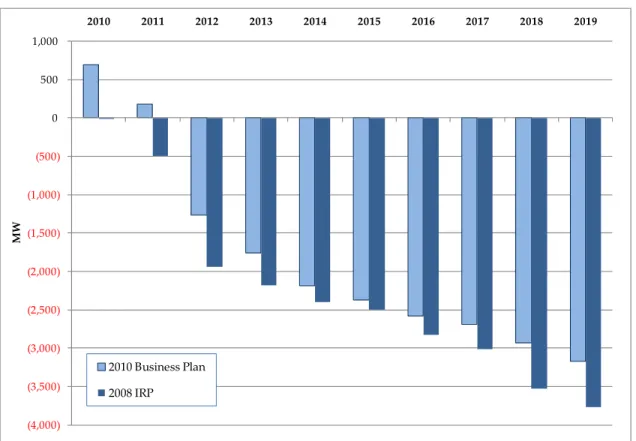
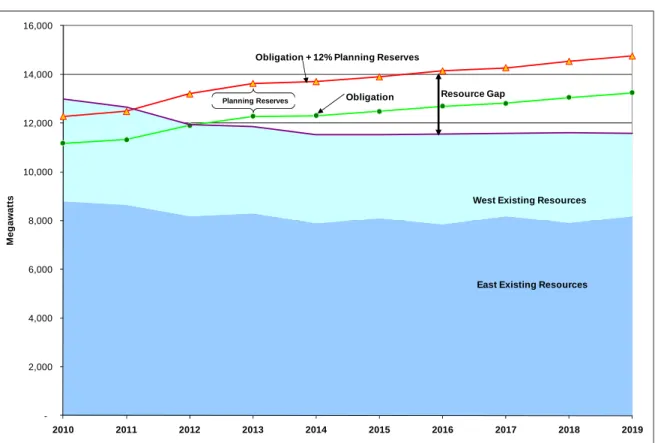
With the 2010 business plan load forecast prepared in October 2009 (showing
reductions in annual system loads from 2.2 million megawatt‐hours in 2010 to 0.6
million megawatt‐hours by 2019 relative to the 2008 IRP load forecast prepared in
February 2009), the system becomes short on capacity in 2012 rather than 2011 without
additional resources (Figure ES.1)
Development of the 2010 business plan resource portfolio was supported by the use of
the Company’s capacity expansion optimization model, System Optimizer, which helped
determine the timing and type of gas resources and firm market purchases based on
updates to forecasted loads, resources, market prices, and other model inputs.
Figure ES.1 – Capacity Position Comparison, 2008 IRP versus the 2010 Business Plan
The significant resource changes with respect to the 2008 IRP preferred portfolio
include the following:
• Deferral of the need for new natural gas resources from 2014 and 2016 to 2015 and
2018
• Postponement of wind resource acquisition in the 2012‐2016 timeframe
¾ This deferral does not impact the Company’s ability to satisfy state and potential
federal renewable portfolio standard requirements throughout this period.
¾ PacifiCorp has exceeded the MidAmerican Energy Holdings Company
commitment to have 1,400 MW of economic renewable resources in the portfolio
by 2015; with resources acquired after 2003, PacifiCorp is expected to surpass this
commitment by 333 MW by the end of 2010. (4,000) (3,500) (3,000) (2,500) (2,000) (1,500) (1,000) (500) 0 500 1,000 2010 2011 2012 2013 2014 2015 2016 2017 2018 2019 MW 2010 Business Plan 2008 IRP
• A 170 MW reduction in the 200 MW planned expansion of the Utah Cool Keeper
residential air conditioning control program from 2010 through 20192, which has
been generally offset by the proposed introduction of a Commercial Curtailment
product and increased participation forecasts for the Company’s irrigation load
control programs.
Table ES.1 summarizes the 2010 business plan portfolio resources, showing the years for
which the resources are available to meet summer peak loads.
Table ES.1 – 2010 Business Plan Portfolio
* The 2011 wind resource is the Top of the World project (200 MW), with an in‐service date of December 31,
2010.
* *Other Class 1 DSM consists of (1) irrigation and residential air conditioning control, and (2) commercial
curtailment, including customer‐owned standby generation.
Table ES.2 presents the updated 2008 IRP Action Plan. The Action Plan table in Chapter
6 indicates changes to the version published in the 2008 IRP.
Resource 2009 2010 2011 2012 2013 2014 2015 2016 2017 2018 2019 East
CCCT F 2x1, Utah (North 2015, South 2018) - - - - - - 607 - - 536 - 1,143
East PPA - - - 200 - - - - 200
Coal & Gas Capacity Upgrades 2 16 20 2 11 37 - - - 86
Wind * 128 227 200 - - - - - 160 100 200 887
DSM, Class 1, Utah Cool Keeper Load Control - 18 6 5 - - - - 28
DSM, Class 1, Other ** - 25 5 15 20 10 3 - - - - 78
DSM Class 2 56 65 65 66 68 68 49 50 51 50 53 585
Front Office Transaction - 3Qtr HLH 75 - - 200 338 519 300 300 350 347 350
West Coal Plant Turbine Upgrades - 4 - - - 12 12 8 12 48
Wind 75 - - - - -
-DSM, Class 1, Other ** - - 5 17 18 5 - - - - - 45
DSM Class 2 39 40 40 39 40 40 37 37 27 27 27 353
Solar Photovoltaic (utility-scale) - - 1.8 1.8 1.8 1.8 1.8 - - - - 8.8 Front Office Transaction-3Qtr HLH - - - 404 594 704 494 623 608 289 444
Annual Additions, Long Term Resources 299 394 342 344 149 125 708 136 251 721 292
Annual Additions, Short Term Resources 75 - - 604 932 1,223 794 923 958 636 794 Total Annual Additions 374 394 342 948 1,081 1,348 1,503 1,059 1,208 1,357 1,087
Capacity, MW Cumulative Total (2010-19)
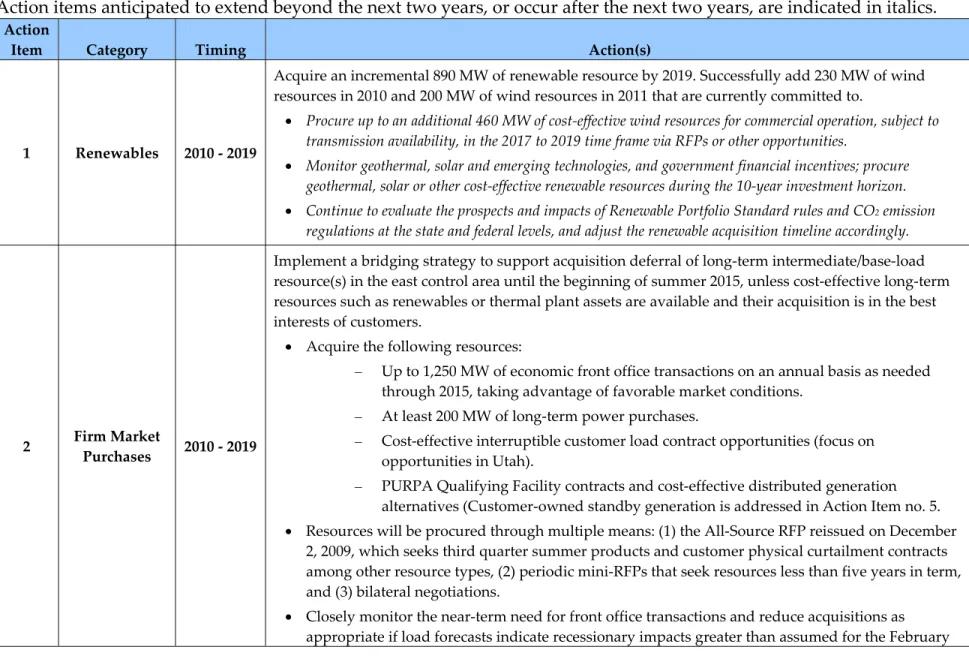
Table ES.2 – IRP Action Plan Update
Action items anticipated to extend beyond the next two years, or occur after the next two years, are indicated in italics.
Action
Item Category Timing Action(s)
1 Renewables 2010 ‐ 2019
Acquire an incremental 890 MW of renewable resource by 2019. Successfully add 230 MW of wind
resources in 2010 and 200 MW of wind resources in 2011 that are currently committed to.
• Procure up to an additional 460 MW of cost‐effective wind resources for commercial operation, subject to
transmission availability, in the 2017 to 2019 time frame via RFPs or other opportunities.
• Monitor geothermal, solar and emerging technologies, and government financial incentives; procure
geothermal, solar or other cost‐effective renewable resources during the 10‐year investment horizon.
• Continue to evaluate the prospects and impacts of Renewable Portfolio Standard rules and CO2 emission
regulations at the state and federal levels, and adjust the renewable acquisition timeline accordingly.
2 Firm Market
Purchases 2010 ‐ 2019
Implement a bridging strategy to support acquisition deferral of long‐term intermediate/base‐load
resource(s) in the east control area until the beginning of summer 2015, unless cost‐effective long‐term
resources such as renewables or thermal plant assets are available and their acquisition is in the best
interests of customers.
• Acquire the following resources:
– Up to 1,250 MW of economic front office transactions on an annual basis as needed
through 2015, taking advantage of favorable market conditions.
– At least 200 MW of long‐term power purchases.
– Cost‐effective interruptible customer load contract opportunities (focus on
opportunities in Utah).
– PURPA Qualifying Facility contracts and cost‐effective distributed generation
alternatives (Customer‐owned standby generation is addressed in Action Item no. 5.
• Resources will be procured through multiple means: (1) the All‐Source RFP reissued on December
2, 2009, which seeks third quarter summer products and customer physical curtailment contracts
among other resource types, (2) periodic mini‐RFPs that seek resources less than five years in term,
and (3) bilateral negotiations.
• Closely monitor the near‐term need for front office transactions and reduce acquisitions as
Action
Item Category Timing Action(s)
2009 load forecast, or if renewable or thermal plant assets are determined to be cost‐effective
alternatives.
• Acquire incremental transmission through Transmission Service Requests to support resource acquisition.
3 Peaking / Intermediate / Base‐load Supply‐side Resources 2014 ‐ 2016
Procure through acquisition and/or company construction long‐term firm capacity and energy resources
for commercial service in the 2012‐2016 time frame.
• The proxy resource included in the 2010 business plan portfolio consists of a Utah wet‐cooled gas
combined‐cycle plant with a capacity rating of 607 MW, acquired by the summer of 2015.
• Procure through the 2008 all‐source RFP issued in December 2009.
– The Company submitted a benchmark resource, specified as the addition of a second combined
cycle block at PacifiCorp’s Lake Side Plant.
• In recognition of the unsettled U.S. economy, expected continued volatility in natural gas markets,
and regulatory uncertainty, continue to seek cost‐effective resource deferral and acquisition
opportunities in line with near‐term updates to load/price forecasts, market conditions,
transmission plans, and regulatory developments.
– PacifiCorp will reexamine the timing and type of gas resources and other resource changes as
part of a comprehensive assumptions update and portfolio analysis to be conducted for the
2008 RFP final short‐list evaluation in the RFP approved in Docket UM 1360, the next business
plan, and 2008 IRP update.
4
Plant
Efficiency
Improvements
2010 ‐ 2019
Pursue economic plant upgrade projects—such as turbine system improvements and retrofits—and unit
availability improvements to lower operating costs and help meet the Company’s future CO2 and other
environmental compliance requirements.
• Successfully complete the dense‐pack coal plant turbine upgrade projects by 2019, which are expected to add
86 MW of incremental capacity in the east and 48 MW in the West with zero incremental emissions.
• Seek to meet the Company’s aggregate coal plant net heat rate improvement goal of 213 Btu/kWh by 20183.
• Monitor turbine and other equipment technologies for cost‐effective upgrade opportunities tied to future
Action
Item Category Timing Action(s)
5 Class 1 DSM 2010 ‐ 2019
Acquire up to 200 MW of cost‐effective Class 1 demand‐side management programs for implementation
in the 2010‐2019 time frame.
• Pursue up to 30 MW of expanded Utah Cool Keeper program participation by 2019; revisit the program’s
growth assumptions in light of the recent passage of Utah legislation that permits an opt‐out program design.
• Pursue up to 100 MW of additional cost‐effective class 1 DSM products including commercial curtailment
and customer‐owned standby generation (55 MW in the east side and 45 MW in the west side) to hedge
against the risk of higher gas prices and a faster‐than‐expected rebound in load growth resulting from
economic recovery; procure through the currently active 2008 DSM RFP and subsequent DSM RFPs.
• For 2010, continue to implement a standardized Class 1 DSM system benefit estimation
methodology for products modeled in the IRP. The modeling will compliment the supply curve
work by providing additional resource value information to be used to evolve current Class 1
products and evaluate new products with similar operational characteristics that may be identified
between plans.
6 Class 2 DSM 2010 ‐ 2019
Acquire 900 ‐ 1,000 MW of cost‐effective Class 2 programs by 2019, equivalent to about 4.1 to 4.6 million
MWh.
• Procure through the currently active DSM RFP and subsequent DSM RFPs.
7 Class 3 DSM 2010 ‐ 2019
Acquire cost‐effective Class 3 DSM programs by 2018.
• Procure programs through the currently active DSM RFP and subsequent DSM RFPs.
• Continue to evaluate program attributes, size/diversity, and customer behavior profiles to determine the
extent that such programs provide a sufficiently reliable firm resource for long‐term planning.
• Portfolio analysis with Class 3 DSM programs included as resource options indicated that at least 100 MW
may be cost‐effective; continue to evaluate program specification and cost‐effectiveness in the context of IRP
portfolio modeling. 8 Planning Process Improvements 2010
Portfolio modeling improvements.
• For the next IRP planning cycle, complete the implementation of System Optimizer capacity
expansion model enhancements for improved representation of CO2 and renewable portfolio
standard (RPS) regulatory requirements at the jurisdictional level. Use the enhanced model to
provide more detailed analysis of potential hard‐cap regulation of carbon dioxide emissions and
Action
Item Category Timing Action(s)
to evaluate the cost‐effectiveness of coal facility retirement as a potential response to future
regulation of carbon dioxide emissions.
• Refine modeling techniques for DSM supply curves/program valuation, and distributed
generation.
• Investigate and implement, if beneficial, the Loss of Load Probability (LOLP) reliability constraint
functionality in the System Optimizer capacity expansion model.
• Continue to coordinate with PacifiCorp’s transmission planning department on improving
transmission investment analysis using the IRP models.
• For the next IRP planning cycle, provide an evaluation of, and continue to investigate,
intermediate‐term market purchase resources for purposes of portfolio modeling.
• Consider developing one or more scenarios incorporating plug‐in electric vehicles and Smart Grid
technologies.
9 Transmission 2009‐2011
Obtain Certificates of Public Convenience and Necessity and conditional use permits for
Utah/Wyoming/Idaho segments of the Energy Gateway Transmission Project to support PacifiCorp load
growth, regional resource expansion needs, market access, grid reliability, and congestion relief.
• Obtain Certificate of Public Convenience and Necessity for a 500 kV line between Mona and
Oquirrh.
• Obtain Certificate of Public Convenience and Necessity for 230 kV and 500 kV line between
Windstar and Populus.
• Obtain Certificate of Public Convenience and Necessity for a 500 kV line between Populus and
Hemingway.
10 Transmission 2010
Complete Utah/Idaho segments of the Energy Gateway Transmission Project to support PacifiCorp load
growth, regional resource expansion needs, market access, grid reliability, and congestion relief.
• Complete construction of a 345 kV line between Populus to Terminal.
Complete permitting and construction of the Utah segments of the Energy Gateway Transmission Project to
Action
Item Category Timing Action(s)
• A 345 kV line between Oquirrh and Terminal.
12 Transmission 2014 ‐ 2016
Complete permitting and construction of Wyoming / Idaho / Utah segments of the Energy Gateway Transmission
Project to support PacifiCorp load growth, regional resource expansion needs, market access, grid reliability, and
congestion relief. Includes:
• A 230 kV and 500 kV line between Windstar and Populus.
• A 345 kV line between Sigurd and Red Butte.
13 Transmission 2016 ‐ 2018
Complete permitting and construction of Idaho segment of the Energy Gateway Transmission Project to support
PacifiCorp load growth, regional resource expansion needs, market access, grid reliability, and congestion relief.
Includes:
• A 500 kV line between Populus and Hemingway.
14 Transmission 2017 ‐ 2019
Complete permitting and construction of the Wyoming/Utah segments of the Energy Gateway Transmission
Project to support PacifiCorp load growth, regional resource expansion needs, market access, grid reliability, and
congestion relief.
• A 500 kV line between Aeolus and Mona.
15 Transmission 2010‐2011 Obtain rights of way for the Wallula‐McNary line segment by the end of 2010, and complete
construction by the end of 2011.
16 Transmission 2010‐2019
For future IRP planning cycles, include on‐going financial analysis with regard to transmission, which
includes: a comparison with alternative supply side resources, deferred timing decision criteria, the
unique capital cost risk associated with transmission projects, the scenario analysis used to determine
the implications of this risk on customers, and all summaries of stochastic annual production cost with
and without the proposed transmission segments and base case segments.
17 Renewables 2010 By August 2, 2010, complete a wind integration study that has been vetted by stakeholders through a
public participation process.
18
Planning
Process
Improvements
2010 During the next planning cycle, work with parties to investigate carbon dioxide emission levels as a
Action
Item Category Timing Action(s)
19
Planning
Process
Improvements
2010 In the next IRP, provide information on total CO2 emissions on a year‐to year basis for all portfolios, and
specifically, how they compare with the preferred portfolio.
20
Planning
Process
Improvements
2010
For the next IRP planning cycle, work with parties to investigate a capacity expansion modeling
approach that reduces the influence of out‐year resource selection on resource decisions covered by the
IRP Action Plan, and for which the Company can sufficiently show that portfolio performance is not
unduly influenced by decisions that are not relevant to the IRP Action Plan.
21
Planning
Process
Improvements
2010 In the next IRP planning cycle, incorporate assessment of distribution efficiency potential resources for
planning purposes.
1
1
.
.
I
I
NNTTRROODDUUCCTTIIOONNThis 2008 Integrated Resource Plan (IRP) Update Report describes resource planning
activities that occurred subsequent to the filing of the 2008 Integrated Resource Plan in
May 2009, and presents the Company’s revised 10‐year resource portfolio and IRP
action plan. These activities centered on preparation of the Company’s 10‐year business
plan for the period 2010‐2019 (“2010 business plan”).
To support business plan development, PacifiCorp used its capacity expansion
optimization model, System Optimizer, to help refine the resource portfolio based on
updates to forecasted loads, resources, market prices, and other model inputs. The
updated resource portfolio also incorporates resource decisions made outside of an
optimization modeling context. These resource decisions reflect capital expenditure and
operating cost constraints developed by the corporate finance department with input
from the PacifiCorp business units (PacifiCorp Energy, Pacific Power, and Rocky
Mountain Power). The financial constraints ensure that the business plan is financially
supportable and affordable to customers, while at the same time complying with all
regulations and the MidAmerican Energy Holdings Company (MEHC) PacifiCorp
acquisition commitments.
This report first describes the planning environment for 2009, focusing on PacifiCorp’s
business planning development, resource procurement initiatives, emissions/climate
change regulatory outlook, and the Energy Gateway transmission planning (Chapter 2).
Next, Chapters 3 and 4 describe the changes to key inputs and assumptions relative to
those used for the 2008 IRP. The updated high‐level resource portfolio is then presented
along with associated changes to the 2008 IRP action plan and Energy Gateway
transmission strategy action plan (Chapters 5 and 6). Appendix A consists of additional
load forecast information and a more detailed resource portfolio table.
2
2
.
.
P
P
LLAANNNNIINNGGE
E
NNVVIIRROONNMMEENNTTBUSINESS PLAN DEVELOPMENT
PacifiCorp’s 2010 business planning process began in April 2009 with preparation of a
preliminary business plan scenario. Preparation of the formal business plan submission
to MEHC (“version 1”) and a revised plan submission (“version 2”) was conducted in
May‐August and August‐October of 2009, respectively. The 2010 business plan was
approved by the MEHC Board on December 9, 2009.
A main finding of the 2010 business planning process was that given the current load
forecast and the economic downturn, the operating and capital budgets supporting the
2009 business plan would not maintain a capital structure that is optimal for both
customers and the Company, and would increase rate pressure on customers. For
example, assessment of the initial projected capital budget with resource acquisitions
and resultant cash flows indicated difficulty in maintaining current debt ratings. As a
consequence, PacifiCorp reexamined the need and timing for capital investments and,
where appropriate and feasible, the business plan eliminates or defers investments. The
revised capital budget included expenditure reductions on the order of $3.5 billion in
the early years of the plan, relative to the budget established for the 2009 business plan.
Against this backdrop, allocating capital for transmission expansion is a precondition
for maintaining transmission system reliability, supporting future load obligations, and
accessing new and existing resource areas. PacifiCorp also assumed that making
investments in environmental controls for sulfur oxides (SOX) and nitrous oxides (NOX)
was needed unless the emission control requirements are modified.
Another key business planning consideration is the progress and challenges associated
with the Energy Gateway transmission expansion project. In an effort to maintain
schedule flexibility, in‐service dates have been updated to provide flexibility while
maintaining the urgency to complete the project. These date adjustments, combined
with the lack of additional transmission capacity on the existing system, prompted
deferral of planned wind resources dependent on the availability of new transmission.
PacifiCorp will continue its focus on maintaining system reliability and efficient use of
new and existing transmission as additional operational experience is gained with
At least two factors could change the Company’s decision to defer additional renewable
energy resources until 2017. First, as the particulars regarding federal emissions
reduction regulations become clearer, it may be prudent to resume adding renewable
energy sooner than 2017. Second, the Company remains open to acquiring renewable
energy projects that represent economically attractive and unique opportunities for its
customers. This aspect of the updated IRP action plan remains unchanged.
RESOURCE PROCUREMENT UPDATE
All Source Request for Proposals
PacifiCorp issued its latest all‐source Request for Proposals (RFP) on December 2, 2009.
This RFP represents the successor to the all‐source RFP (“2008 All‐Source RFP”) that
was suspended on April 6, 2009, and seeks up to 1,500 MW of base‐load, intermediate‐
load, and third‐quarter market purchases (front office transactions) on a system‐wide
basis for the 2014‐to‐2016 period. The minimum eligible fixed term is five years for the
proposals, with a minimum dependable capacity of 100 MW. Exceptions to these term
and capacity limitations include (1) a power purchase agreement (“PPA”) or tolling
service agreement (“TSA”) not backed by an asset, (2) load curtailment, (3) PURPA
Qualifying Facilities, and (4) dispatchable/schedulable renewable resources. Proposals
were due March 1, 2010. Procurement decisions for this RFP are expected in January
2011.
Renewables Requests for Proposals
PacifiCorp decided to not issue a RFP for renewable resources during 2010 after
assessing the capital budget and the conditions impacting renewable energy
development such as transmission availability. The Company’s revised renewables
resource strategy is summarized in Chapter 6.
Demand-side Management Requests for Proposals
The Company released a comprehensive demand‐side management RFP (2008 DSM
RFP) in November 2008. The initial 2008 DSM RFP work schedule proved to be too
ambitious given the number of bidder proposals, Utah DSM program recovery filings,
American Reinvestment and Recovery coordination efforts, compliance reporting for
Washington Initiative 937, and other regional activities. In 2009 PacifiCorp evaluated all
proposals received and developed a short list of proposals. Those vendors having
proposals on the short‐list were asked to provide an additional year for the company to
fully evaluate and process the short‐listed proposals. The revised timeline for the
remaining short‐listed proposals is fourth quarter 2010.
The Company completed an RFP for program evaluations of legacy products in 2009,
and selected Cadmus, Inc. to perform the work. Draft evaluations are scheduled for
mid‐year 2010, and at that time, will be provided to interested parties for review and
comment. Current agreements for engineering resources in support of commercial,
industrial and agricultural program delivery expires in June 2010. The RFP to re‐
procure these services, as well as for general program evaluation services, is scheduled
to be released during the first quarter of 2010. The RFP for continuation of Utah and
Idaho load management program services is also scheduled to be released in the first
quarter of 2010 as are RFPs for the delivery of the company’s refrigeration recycling and
Home Energy Savings programs.
EMISSIONS AND CLIMATE CHANGE POLICY
Currently Regulated Emissions
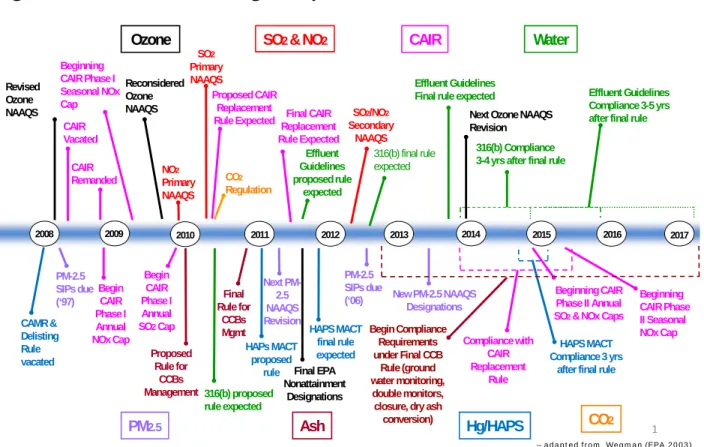
There are currently a multitude of environmental regulations which are in various
stages of being promulgated, as outlined on the timeline below (Figure 2.1). Each of
these regulations will have an impact on the utility industry and could affect
environmental control requirements, limit operations, change dispatch, and could
ultimately determine the economic viability of PacifiCorp’s generation assets. The U.S.
Environmental Protection Agency has undertaken a multi‐pronged approach to
minimize air, land, and water‐based environmental impacts. Aside from potential
greenhouse gas regulation, no single regulation is likely to materially impact the
industry; however, in concert they are expected to have a significant impact – especially
on the coal‐fueled generating units that supply approximately 50% of the nation’s
electricity.
Figure 2.1 – Environmental Regulatory Timeline at the Federal Level
Climate Change
On June 26, 2009, the U.S. House of Representatives passed The American Clean Energy
and Security Act of 2009 (H.R. 2454) authored by Congressmen Henry Waxman of
California and Edward Markey of Massachusetts. The Bill seeks to reduce greenhouse
gas emissions via a complex cap and trade system affecting the vast majority of the
United States economy. Although the cap and trade requirements would generally
apply only to sources responsible for greenhouse gas emissions of at least 25,000 metric
tons per year, the Bill sets no emissions threshold for power plants and certain other
industries.
The cap consists of a series of annually decreasing limits on overall United States
greenhouse gas emissions, beginning with a 3 percent reduction in 2012 (compared to
2005 levels), reaching a 17 percent reduction by 2020, and ultimately an 83 percent
reduction by 2050. The Bill would initially apply to electric utilities, fuel refineries, and
certain industries (representing 66 percent of total United States emissions), with
additional industrial sources covered in 2014, and natural gas distributors added in
2016, ultimately bringing about 85 percent of the United States greenhouse gas
emissions within the cap and trade system. The U.S. Environmental Protection Agency
would distribute emission allowances (collectively equal to the annual overall emissions
cap) among affected emitters, who must annually hold a sufficient number of
1 Ozone PM2.5 2008 2009 2010 2011 2012 2013 2014 2015 2016 2017 Beginning CAIR Phase I Seasonal NOx Cap HAPs MACT proposed rule Beginning CAIR Phase II Seasonal NOx Cap Revised Ozone NAAQS Begin CAIR Phase I Annual SO2Cap
-- adapted from Wegman (EPA 2003) Beginning CAIR
Phase II Annual SO2& NOx Caps Next
PM-2.5 NAAQS Revision
Next Ozone NAAQS Revision SO2 Primary NAAQS SO2/NO2 Secondary NAAQS NO2 Primary NAAQS SO2 & NO2 New PM-2.5 NAAQS Designations CAMR & Delisting Rule vacated Hg/HAPS Final EPA Nonattainment Designations PM-2.5 SIPs due (‘06) Proposed CAIR Replacement Rule Expected HAPS MACT final rule expected CAIR Vacated HAPS MACT Compliance 3 yrs
after final rule CAIR Remanded CAIR Begin CAIR Phase I Annual NOx Cap PM-2.5 SIPs due (‘97) 316(b) proposed rule expected 316(b) final rule expected 316(b) Compliance 3-4 yrs after final rule Effluent Guidelines proposed rule expected Water Effluent Guidelines
Final rule expected Effluent Guidelines
Compliance 3-5 yrs after final rule
Begin Compliance Requirements under Final CCB Rule (ground water monitoring, double monitors, closure, dry ash conversion) Ash Proposed Rule for CCBs Management Final Rule for CCBs Mgmt Final CAIR Replacement Rule Expected Compliance with CAIR Replacement Rule CO2 CO2 Regulation Reconsidered Ozone NAAQS
allowances and offset credits to equal their actual emissions. Electric utilities would
initially receive 35 percent of the available allowances for free; however, the free
allocation for this sector is completely phased out between 2026 and 2030, with a
transition to a full auction.
The bill also allows capped sources to use up to two billion metric tons of domestic and
international offset credits to meet a portion of their annual compliance obligations.
Offsets are generated by projects that reduce, avoid, or sequester emissions that would
otherwise not be subject to the emissions cap.
On November 5, 2009, a substantially similar bill, the Clean Energy Jobs and American
Power Act (S. 1733) authored by Senators Boxer of California and Kerry of
Massachusetts, passed the Senate Environment and Public Works Committee. Some of
the key differences between the Senate bill and the House bill are listed in Table 2.1.
Table 2.1 – Comparison of Waxman-Markey and Kerry-Boxer bills
Waxman – Markey (H.R. 2454) Kerry – Boxer (S. 1733)
17% reduction by 2020 (from 2005) 20% reduction by 2020 (from 2005) Small deficit reduction pool in early years Deficit reduction pool of 10% ‐ 25%
2012 Electric Sector allocation: 2.0 billion 2012 Electric Sector allocation: 1.7 billion Standard auction price floor: $10 (2009$)
Strategic auction price floor: $28 (2009$)
Standard auction price floor: $10 (2005$)
Strategic auction price floor: $28 (2005$) Domestic offsets: 1.0 billion metric tons/year
International offsets: 1.0 billion metric tons/year
Domestic offsets: 1.5 billion metric tons/year
International offsets: 0.5 billion metric tons/year
Environmental Protection Agency’s Advance Notice of Public Rulemaking
On an independent, yet parallel path, the U.S. Environmental Protection Agency (EPA)
is also pursuing the potential regulation of greenhouse gas emissions. On April 2, 2007,
the U.S. Supreme Court held that greenhouse gas emissions, including carbon dioxide,
are air pollutants covered by the Clean Air Act. (Massachusetts v. Environmental
Protection Agency). The Supreme Court held that the Environmental Protection
Agency was required to determine whether or not emissions of greenhouse gases from
new motor vehicles cause or contribute to air pollution which may reasonably be
anticipated to endanger public health or welfare.
may endanger public health or welfare. The Environmental Protection Agency finalized
its Endangerment Finding on December 7, 2009. The agency also expects to issue final
regulations under the Clean Air Act to control greenhouse gas emissions from light
duty vehicles at the end of March 2010. The EPA has taken the position that such an
action will trigger Clean Air Act permitting requirements for stationary sources under
the New Source Review/Prevention of Significant Deterioration, and Title V Operating
Permit programs for greenhouse gas emissions.
To address the significant number of stationary sources that will become subject to
regulation under the New Source Review/Prevention of Significant Deterioration and
Title V operating permit program in March 2010, the Environmental Protection Agency
on October 27, 2009 issued a proposed Prevention of Significant Deterioration and Title
V greenhouse gas emissions tailoring rule to “tailor” the major source applicability
thresholds for greenhouse gas emissions under the Prevention of Significant
Deterioration and Title V programs of the Clean Air Act and to set a Prevention of
Significant Deterioration significance level for greenhouse gas emissions. If the New
Source Review/Prevention of Significant Deterioration programs were applied literally
under the Clean Air Act, the thresholds would be set at extremely low levels—up to 250
tons—for greenhouse gas emissions. To avoid the situation in which very small sources
of greenhouse gas emissions are required to obtain permits, based on the legal doctrines
of “absurd results” and “administrative necessity”, this proposed rule would phase in
the applicability thresholds for both the Prevention of Significant Deterioration and
Title V programs for sources of greenhouse gas emissions. The first phase, which
would last six years, would establish a temporary level for the Prevention of Significant
Deterioration and Title V applicability thresholds at 25,000 tons per year carbon dioxide
equivalent, and a temporary Prevention of Significant Deterioration significance level
for greenhouse gas emissions of between 10,000 and 25,000 tons per year carbon dioxide
equivalent. After the first six years, the Environmental Protection Agency would
conduct a study to assess this program and potentially revise the applicability and
significance level thresholds.
The Environmental Protection Agency plans to finalize its “Tailoring Rule” prior to or
at the same time it finalizes its light‐duty vehicle greenhouse gas emissions standards in
March 2010. Sources with the potential to emit greenhouse gas emissions above the
established thresholds will be required to obtain permits if they construct a new source
or modify an existing source. Likewise, existing sources will be required to incorporate
greenhouse gas emissions in their Title V operating permits. Sources cannot currently
determine what constitutes the required Best Available Control Technology for new or
modified sources, nor can they anticipate how the Title V permit requirements may
Impacts and Sources
Relatively speaking, the potential requirements to reduce greenhouse gas emissions
could have a profound impact on PacifiCorp’s generation fleet. In the near term (e.g.,
through at least 2020), to reach the emissions caps proposed in the federal bills,
PacifiCorp would need to consider converting coal units to burn natural gas and
retiring other coal units and replacing them with lower carbon emitting resources and
expanded DSM. In the longer term, replacement of baseload fossil‐fueled plants with
non‐emitting baseload resources currently in development (e.g., carbon‐sequestered
thermal units, new generation nuclear units, and renewable generation supplemented
with battery storage) will be necessary to achieve reduction targets such as those in the
federal bills, assuming continuation of the energy policy that requires electric utilities
provide service on demand in the quantity demanded.4
While federal legislation requiring reduction in greenhouse gas emissions coupled with
a mandatory allowance trading market would be expected to have the greatest financial
impact on PacifiCorp, the potential for impacts resulting from the changes in New
Source Review/Prevention of Significant Deterioration provisions from the greenhouse
gas tailoring rule are also likely to have an influence on capital/construction projects,
even when installing emissions controls. The requirement to conduct a Best Available
Control Technology review and implement additional efficiency measures or otherwise
reduce greenhouse gas emissions is likely to have a chilling effect on future projects.
EPRI analysis of Waxman-Markey
In 2009, the Electric Power Research Institute (EPRI) conducted a broad‐brush study to
identify and analyze the likely effects of H.R. 2454 for U.S. generators and customers.
The study relied upon the NEMS (National Energy Modeling System) used by the U.S.
Department of Energy’s Energy Information Agency (EIA) and their Annual Energy
Outlooks and policy analyses. NEMS and detailed EIA results are publicly available.
4 In addition to the costs of replacing and retrofitting coal and natural gas generation, bills such as
Waxman‐Markey and Boxer‐Kerry would impose an additional cost that ultimately will be borne by
customers. This added cost is the cost of purchasing emissions allowances, even for emissions that are
below the cap. Although the bills provide for some allocation of “free” allowances, PacifiCorp is expected
to receive less than 50% of the allowances it needs even if the Company is able to reduce emissions to the
level of the cap, and the expected shortfall increases each year. Beginning in 2012, the financial impact of
EPRI has worked extensively with NEMS for over a decade. For the study, EPRI applied
the model to represent Waxman‐Markey on behalf of PacifiCorp, using PacifiCorp’s
assumptions on power plant costs (vintage 2008). The PacifiCorp/EPRI team then
established set scenarios with a goal to better understand the role of modeling
assumptions in assessing climate policy impacts on energy sector. A reference case was
defined as having a full 2 billion tons of offsets availability, plus three offsets sensitivity
cases that phase‐in offsets from zero:
• Case 1 “Plentiful” 2 Billion Tons by 2030 • Case 2 “Scarce” 1 Billion Tons by 2030
• Case 3 “Very Scarce” half Billion Tons by 2030
Waxman‐Markey allows up to 2 billion tons/year of offset use (50%‐50% split between
domestic and international sources with some opportunity for substitution). Offset
quantities allowed in legislation far exceed experiences in Europe’s CO2 trading system.
If low‐cost offsets are unavailable in quantities approved by the program, much higher
allowance prices will be required to meet cap. The study also concluded that market
and regulatory uncertainty in offset supply dominates all other uncertainties in
impacting the price of carbon. Abundant offsets allow the economy to meet the
emissions cap with only limited abatement from the regulated entities covered by the
cap‐and‐trade program. If offsets are limited, most of the abatement is done by the
electric sector through the increased use of natural gas and the increased installation of
wind generation.
A PowerPoint presentation summarizing study results and entitled “Preliminary
Analysis of Waxman‐Markey (H.R.2454) Using NEMS for PacifiCorp” is available for
downloading from PacifiCorp’s IRP website.5
ENERGY GATEWAY TRANSMISSION PROGRAM PLANNING
The Energy Gateway transmission project remains a critical component of the short and
long‐term resource acquisition plans, representing a precondition for maintaining
transmission system reliability, supporting future load obligations, and accessing new
and existing resource areas.
5
The link to the document is:
http://www.pacificorp.com/content/dam/pacificorp/doc/Energy_Sources/Integrated_Resource_Plan/Environment/W M-NEMS-Roadshow-draft-9-11-09.pdf.
Construction of the first segment (Populus to Terminal) is underway and remains on
schedule for completion in 2010. Populus to Terminal is a new double‐circuit 345
kilovolt (“kV”) transmission line from the Populus substation near Downey, Idaho to
the Terminal substation in Salt Lake City, Utah. The Populus to Terminal line will be
placed in service in two phases. The first phase from the Ben Lomond substation (near
Ogden, Utah) to the Terminal substation will be in service by June 2010, and the second
phase from the Populus substation to the Ben Lomond substation will be in service by
December 31, 2010.
As an extension of ongoing transmission planning efforts, Idaho Power and PacifiCorp
also recently signed a Memorandum of Understanding (“MOU”) that outlines a process
to fully define and develop joint ownership of extensive transmission facilities,
including the Boardman to Hemingway transmission project and the Gateway West
Project. The two companies already share a partnership on Gateway West. Joint
ownership of the Hemingway to Boardman project is a new development and is
expected to replace further near‐term review and consideration of the Hemingway to
Captain Jack project listed as “under review” in the 2008 IRP.
Despite this progress, permitting and other related factors require that in‐services dates
on other segments of Energy Gateway continue to remain flexible. In an effort to
maintain schedule flexibility, in‐service dates have been updated to allow flexibility
while maintaining the urgency to complete the project. The 2010 business plan and
associated resource acquisition decisions account for these date adjustments. As issues
are addressed and uncertainties eliminated, the Company will continue to adjust its
project planning accordingly.
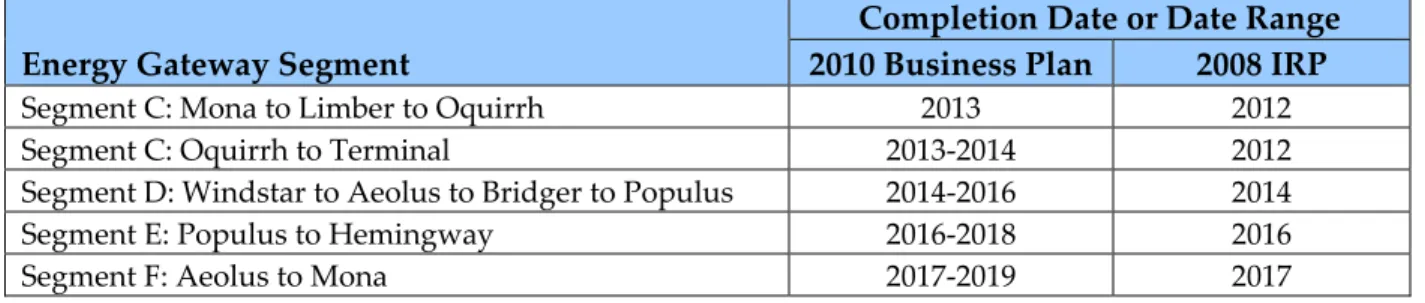
Table 2.2 summarizes the Energy Gateway target in‐service date ranges with respect to
the dates cited in the 2008 IRP. These date changes are also reflected in the revised
transmission action items cited in Chapter 6.
Table 2.2 – Energy Gateway Project Completion Date Changes
Energy Gateway Segment
Completion Date or Date Range
2010 Business Plan 2008 IRP
Segment C: Mona to Limber to Oquirrh 2013 2012
Segment C: Oquirrh to Terminal 2013‐2014 2012
Segment D: Windstar to Aeolus to Bridger to Populus 2014‐2016 2014
Segment E: Populus to Hemingway 2016‐2018 2016
In regard to the Walla Walla to McNary project (Segment A), during 2009 PacifiCorp
received requests for transmission service, requiring that the Company proceed with
the Wallula, Washington to Umatilla, Oregon portion of the Walla Walla to McNary
Project transmission line. This section of the Walla Walla to McNary Project is
approximately 30 miles in length and will be built on a 125‐foot‐wide right of way
connecting the existing Wallula substation and the McNary substation at Umatilla.
Constructing this portion of the line will provide the capacity to add new renewable
energy to the system, improve service to customers and improve the reliability of the
regional transmission system.
PacifiCorp will work with property owners to obtain rights of way for the Wallula‐
McNary transmission line segment by the end of 2010. Construction is expected to
begin soon thereafter, with plans to bring the new line into service in late 2011. At this
point, the Company has not determined when it will construct the Walla Walla to
Wallula portion of the McNary Project.
3
3
.
.
R
R
EESSOOUURRCCEEN
N
EEEEDDSSA
A
SSSSEESSSSMMEENNTTU
U
PPDDAATTEELOAD FORECAST
For the final 2010 business plan, PacifiCorp updated its load forecast in October 2009.
Relative to the load forecast prepared in February 2009, PacifiCorp system sales and
coincident peak dropped for the planning period, with the largest declines occurring in
the early years. The main driver for the residential, commercial and industrial class
declines is the effect of the economic downturn.
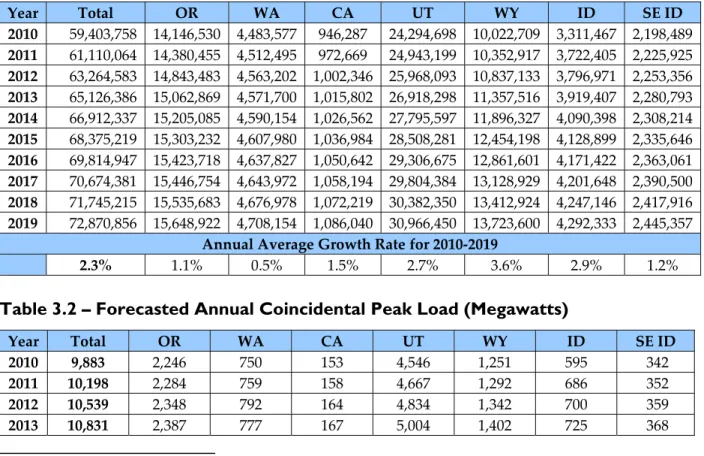
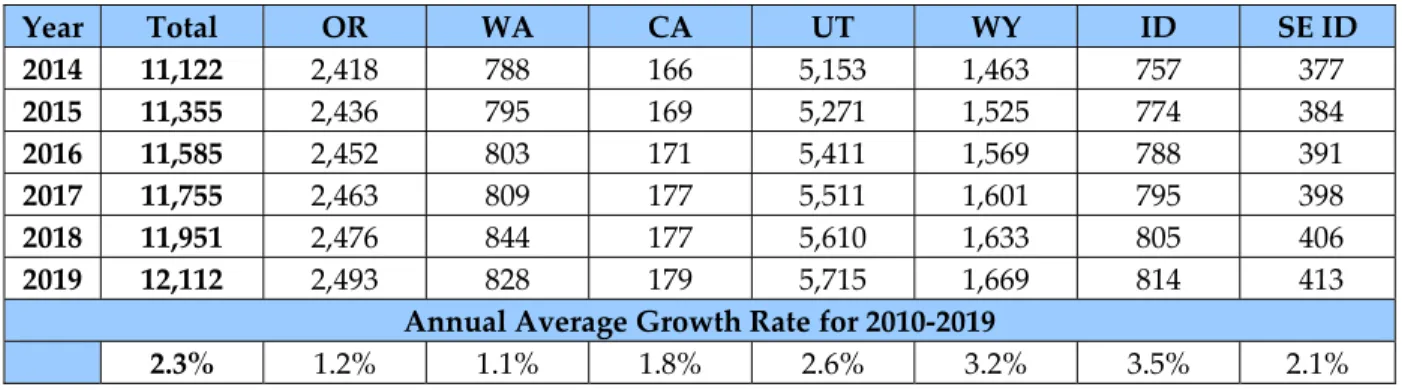
Tables 3.1 and 3.2 report the October 2009 annual load and coincidental peak load
forecasts, respectively. Note that this forecast data excludes load reduction projections
from new energy efficiency measures (Class 2 DSM), since such load reductions are
included as resources in the System Optimizer model. Tables 3.3 and 3.4 show the
forecast changes relative to the February 2009 load forecast for loads and coincident
system peaks, respectively. 6
Table 3.1 – Forecasted Annual Load Growth, 2010 through 2019 (Megawatt-hours)
Year Total OR WA CA UT WY ID SE ID 2010 59,403,758 14,146,530 4,483,577 946,287 24,294,698 10,022,709 3,311,467 2,198,489 2011 61,110,064 14,380,455 4,512,495 972,669 24,943,199 10,352,917 3,722,405 2,225,925 2012 63,264,583 14,843,483 4,563,202 1,002,346 25,968,093 10,837,133 3,796,971 2,253,356 2013 65,126,386 15,062,869 4,571,700 1,015,802 26,918,298 11,357,516 3,919,407 2,280,793 2014 66,912,337 15,205,085 4,590,154 1,026,562 27,795,597 11,896,327 4,090,398 2,308,214 2015 68,375,219 15,303,232 4,607,980 1,036,984 28,508,281 12,454,198 4,128,899 2,335,646 2016 69,814,947 15,423,718 4,637,827 1,050,642 29,306,675 12,861,601 4,171,422 2,363,061 2017 70,674,381 15,446,754 4,643,972 1,058,194 29,804,384 13,128,929 4,201,648 2,390,500 2018 71,745,215 15,535,683 4,676,978 1,072,219 30,382,350 13,412,924 4,247,146 2,417,916 2019 72,870,856 15,648,922 4,708,154 1,086,040 30,966,450 13,723,600 4,292,333 2,445,357
Annual Average Growth Rate for 2010‐2019
2.3% 1.1% 0.5% 1.5% 2.7% 3.6% 2.9% 1.2%
Table 3.2 – Forecasted Annual Coincidental Peak Load (Megawatts)
Year Total OR WA CA UT WY ID SE ID
2010 9,883 2,246 750 153 4,546 1,251 595 342
2011 10,198 2,284 759 158 4,667 1,292 686 352
2012 10,539 2,348 792 164 4,834 1,342 700 359
Year Total OR WA CA UT WY ID SE ID 2014 11,122 2,418 788 166 5,153 1,463 757 377 2015 11,355 2,436 795 169 5,271 1,525 774 384 2016 11,585 2,452 803 171 5,411 1,569 788 391 2017 11,755 2,463 809 177 5,511 1,601 795 398 2018 11,951 2,476 844 177 5,610 1,633 805 406 2019 12,112 2,493 828 179 5,715 1,669 814 413
Annual Average Growth Rate for 2010‐2019
2.3% 1.2% 1.1% 1.8% 2.6% 3.2% 3.5% 2.1%
Table 3.3 – Annual Load Growth Change: October 2009 Forecast Less February 2009 Forecast (Megawatt‐hours) Year Total OR WA CA UT WY ID SE ID 2010 (2,200,076) (664,299) 138,664 (19,931) (227,614) (624,102) (439,352) (363,441) 2011 (2,153,866) (541,054) 141,092 (32,284) (461,378) (835,960) (63,552) (360,729) 2012 (1,765,360) (272,213) 145,934 (34,935) (200,550) (1,008,781) (32,492) (362,322) 2013 (1,339,859) (96,750) 147,601 (39,840) 33,851 (896,380) (55,402) (432,939) 2014 (1,066,760) (18,382) 146,837 (44,542) 113,376 (777,969) 1,412 (487,493) 2015 (971,432) 19,747 144,145 (47,191) 15,897 (634,574) 10,807 (480,264) 2016 (897,247) 41,307 141,185 (49,626) 118,509 (688,358) 17,252 (477,516) 2017 (884,964) 44,754 137,258 (51,686) 207,723 (779,177) 23,357 (467,194) 2018 (972,390) 22,531 134,696 (54,426) 240,362 (880,891) 31,164 (465,826) 2019 (596,393) 57,999 137,249 (55,975) 373,664 (687,219) 41,108 (463,219)
Annual Average Change for 2010‐2019
(1,284,835) (140,636) 141,466 (43,044) 21,384 (781,341) (46,570) (436,094)
Table 3.4 – Annual Coincidental Peak Growth Change: October 2009 Forecast Less February 2009 Forecast (Megawatts) Year Total OR WA CA UT WY ID SE ID 2010 (271) (149) 13 (5) 7 (56) (54) (27) 2011 (276) (135) 13 (8) (35) (80) 12 (43) 2012 (258) (98) 10 (9) 4 (97) (5) (64) 2013 (192) (75) 14 (9) 38 (87) (12) (60) 2014 (43) (67) 13 (11) 41 (74) 74 (18) 2015 (60) (65) 13 (11) 20 (60) 66 (23) 2016 (98) (65) 12 (12) 36 (66) 43 (45) 2017 (109) (68) 11 (12) 45 (77) 37 (45) 2018 (143) (75) 7 (12) 46 (89) 35 (56) 2019 (86) (74) 11 (12) 62 (68) 35 (40)
Annual Average Change for 2010‐2019