Toward an integrated User Requirements Notation framework and tool for
Business Process Management
Alireza Pourshahid
Daniel Amyot
Liam Peyton
Sepideh Ghanavati
SITE, University of Ottawa
{apour024 | damyot | lpeyton,
sghanava}@site.uottawa.ca
Pengfei Chen
Michael Weiss
SCS, Carleton University
[email protected]
[email protected]
Alan J. Forster
Department of Medicine,
University of Ottawa
and OHRI
[email protected]
Abstract
A number of recent initiatives in both academia and industry have sought to achieve improvements in e-businesses through the utilization of Business Process Management (BPM) methodologies and tools. How-ever there are still some inadequacies that need to be addressed when it comes to achieving alignment be-tween business goals and business processes. The User Requirements Notation (URN) has some unique fea-tures and capabilities beyond what is available in other notations that can help address alignment issues. In this paper, a URN-based framework and its support-ing toolset are introduced which provide business process monitoring and performance management capabilities integrated across the BPM lifecycle. The framework extends the URN notation with Key Per-formance Indicators (KPI) and other concepts to measure, and align processes and goals. A healthcare case study is used to illustrate and evaluate the frame-work. Early results indicate the feasibility of the ap-proach.
1.
Introduction
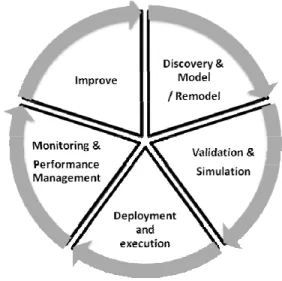
A Business Process Management (BPM) lifecycle consists of several iterative steps that improve the qual-ity of business processes and overall organization in an incremental approach [6] [18] [37]. Figure 1 gives an overview of a typical model-driven lifecycle, starting with the discovery and modeling of business processes. Using superficial and outdated process models ob-scures the understanding of the organization and pre-vents the next steps of the BPM project from providing optimal results and value [21]. An integrated and tool-supported methodology supporting users who are mod-elling business processes accurately is considered es-sential for BPM projects. In addition, allowing the in-tegration of business goals and performance models, in
a traceable way to and from business models, greatly contributes to ensuring goal satisfaction and process adaptation [31] [34] [39]. The integration of goals, proc-esses, and performance in a BPM framework enables many useful capabilities, some of which are explored in this paper. As an example, the traceability between business process models and business goal models plays a significant role in the successful and practical definition of process-oriented Key Performance Indica-tors (KPI), a common way of evaluating different as-pects of a business by qualitative measurement [20].
Figure 1: BPM lifecycle
Often, the focus of the deployment phase of a BPM project is to automate the modeled processes [18]. However, we believe this phase also offers opportuni-ties for improving the subsequent phases. There are information systems across organizations that produce data useful for the monitoring and performance man-agement phase that can provide deeper insight about processes. Deploying a data warehouse (DW) that
sup-ports performance models related to the business mod-els represents a useful design alternative. The DW can be used as a data source for a Business Intelligence (BI) tool integrated to the BPM environment, allowing one to investigate business processes in their associated context along different dimensions [31].
The improvement phase can use performance meas-urement results from the monitoring phase as well as a repository of process redesign patterns like those de-fined in [32]. In other words, redesign patterns aiming to help the organization improve the target process can be suggested based on a problem observed during the monitoring phase and/or goals defined in the modeling phase. This is one of the main reasons to bring in a performance measurement framework [24].
In this paper, we propose many elements of a BPM framework that supports this vision. Our modelling approach is based on the User Requirements Notation (URN), which integrates complementary goal and sce-nario views. The notation is extended to support KPI and performance modeling, process portfolio monitor-ing, and scenario-based performance and impact analy-sis. Our URN-based approach also provides confor-mance and compliance capabilities [9] [34], which sup-port traceability from goals and scenarios to require-ments and policies from the organization or external legislation. Such traceability enables impact analysis as goals, processes, and external requirements evolve.
In addition, we elaborate on the required extensions to the current URN meta-model as well as develop-ment and integration efforts done to prototype such enhancements (using tools like the jUCMNav URN editor, Cognos’ Business Intelligence tools [5], and Telelogic’s requirements management system DOORS). Our framework will be discussed and illus-trated in the context of a case study in the healthcare sector related to a hospital’s DW approval process.
2.
Background
2.1 Business Process Management (BPM)
A business process is a “coordinated chain of activi-ties intended to produce a business result” [3] or a “re-peating cycle that reaches a business goal” [6]. People from different units and organization are usually in-volved to complete an end-to-end process. Business Process Modeling is a structural method that helps stakeholders graphically analyze processes and find possible points of improvements. In the course of modeling a process, one usually specifies the defined activities which are performed by different parties. A business process model should be able to answer the famous W5 questions. Why, What, Who, Where and When.
Processes can be simple and restricted to a func-tional unit of an organization or complex and cutting across several business partners. Today’s customer-focused business environment requires much business-to-business cooperation to complete a process and of-ten massive integration between different information systems [26]. However, legacy software applications are usually built based on different functional units of businesses, hindering integration [3].
Business Process Management (BPM) is the man-agement of diverse and cross-organizational processes that integrate methods and tools to support the design, execution, management, and analysis of business proc-esses. Business Process Management Systems (BPMS) are integrated tools that enable businesses to perform the required steps in a BPM project.
A BPMS is one of the most recommended invest-ments for process improvement [35]. It adds value to the business, enables the reuse of IT investments and addresses the aforementioned integration issues. In addition, a BPMS helps businesses automate and man-age business rules and processes. As a key component of BPMS, business activity monitoring (BAM) is “the real-time reporting, analysis and alerting of significant business events, accomplished by gathering data, key performance indicators and business events from mul-tiple applications” [8]. According to Kronz [20], the principal outcomes of continuous monitoring, control-ling and analysis of processes are improved decision making and process optimization.
A new term that has been recently introduced in the industry is Business Process Intelligence (BPI). BPI integrates BPMS and Business Intelligence (BI) sys-tems. BPI usually includes DW and BI and is used by both business and IT users [12]. BPI tools reduce the traditional gap between process execution and per-formance monitoring [25] and enable continuous proc-ess improvement. “BI 2.0” is the name given to this new generation of BI tools. In [27], BI 2.0 and its abil-ity to track ongoing business behaviour are elaborated. There has also been movement towards integration of BPMS and Corporate Performance Management (CPM) to align corporate goals with business processes [10]. However, neither BPI, nor integration with CPM pro-vides sufficient support in dealing with the business goal models and business process models in an inte-grated manner.
2.2 User Requirements Notation
The User Requirements Notation (URN) was de-signed for modeling and analyzing requirements in the form of goals and scenarios prior to design [15] [39]. It can be used to model most kinds of reactive and dis-tributed systems, as well as business processes.
The URN combines two complementary notations: the Goal-oriented Requirement Language (GRL) and Use Case Maps (UCM) which are used for modeling goals and processes respectively. Figure 2 and Figure 3 show a brief summary of these two notations.
More complex business process modeling lan-guages exist, but a combined view of goals and proc-esses and traceability features between them are unique capabilities of URN. URN provides the ability to align business goals and business processes by adopting de-sign experts’ business knowledge and experience [22].
Break Break Hurt
Hurt Make
Make HelpHelp
Softgoal Softgoal
Actor Actor
Goal
Goal Task Task
Figure 2: Subset of GRL notation
GRL supports an evaluation mechanism that lets users define sets of initial satisfaction values on chosen intentional elements in GRL model (called strategies). Those values are propagated to the other intentional elements in the model via their contribution, decompo-sition, and dependency links, up to the highest level goals [1] [33] [34]. This capability can be used for evaluating the effect of different tasks and processes on goal models, enabling global evaluations of alterna-tives and trade-off analysis [31]. Finding realistic con-tribution weights and initial satisfaction values to de-fine a GRL strategy can however be difficult, but our framework proposes novel solutions to this issue.
Start Point End Point Path … … … …Responsibility Direction Arrow Start Point End Point Path … … … … … … … … … …Responsibility Direction Arrow
…IN1 OUT1…Static Stub & Segments ID Dynamic Stub IN1 OUT1 … … S{IN1} E{OUT1} Plug-in Map …IN1 OUT1… … …
…IN1 OUT1…Static Stub & Segments ID Dynamic Stub IN1 OUT1 …IN1 OUT1… … … … … S{IN1} E{OUT1} S{IN1} E{OUT1}
Plug-in Map ComponentComponent
… … … … [C1] [C2] [C3] OR-Fork … … … … OR-Join … … … … … … … … AND-Join AND-Fork [Guard] … … … … [C1] [C2] [C3] … … … … [C1] [C2] [C3] OR-Fork … … … … … … … … OR-Join … … … … … … … … AND-Join AND-Fork … … … … … … … … … … … … … … … … AND-Join AND-Fork [Guard]
Figure 3: Subset of UCM notation
The UCM process view specifies the responsibili-ties to be performed (the what aspects) by whom,
when, and where. The GRL goal view provides a ra-tionale (why) for the business process elements, to-gether with an explanation of why alternative solutions were chosen or not. More details on URN are provided in [1] [15]. A detailed analysis of the capabilities of URN in comparison with other well-known business process modeling languages is given in [28].
Work on the framework described in this paper was initiated in [38] [39], which introduces business process
modeling using URN. The framework’s core tool is
jUCMNav, an open URN modeling, analysis and trans-formation tool based on the Eclipse platform [33]. The data exchange layer and integration with external tools was formalised in [17]. Integration of goals/scenarios with a Requirement Management System (Telelogic DOORS) [34] was used as a basis for process valida-tion and compliance verificavalida-tion against requirements, goals, and policies, as elaborated in [9]. Business proc-ess monitoring and performance management was in-troduced in [31]. This paper builds on top of this work to help answer a new how well question with BPM.
3.
An integrated framework for BPM
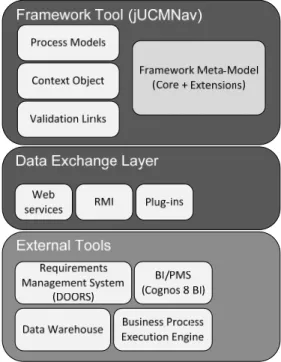
Our proposed framework consists of different layers of components in an open, extensible architecture. As illustrated in Figure 4 the core component is the framework meta-model, which describes the semantic concepts for creating process, goal, and performance models. A subset of this meta-model is shown in Fig-ure 8 and FigFig-ure 9. The jUCMNav tool is built on top of this meta-model.
Figure 4: Framework components
The framework allows one to model processes, goals, and context objects (e.g. KPIs and compliance constraints). Validation links allow one to connect models to external tools through the data exchange layer. Although the framework is generic enough to support different type of technologies (e.g. eclipse plug-in, RMI, etc.), we adopted a Service Oriented
Architecture (SOA) solution in the current implemen-tation. SOA provides flexibility, scalability, and small development and deployment cycle times and cost [4].
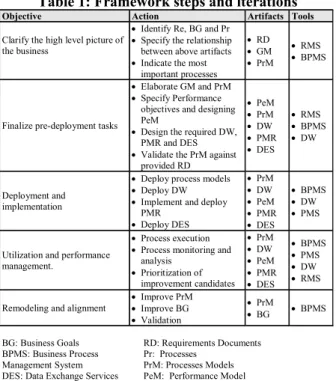
A common multi-phase and iterative approach to implementation of the framework is shown in Table 1. The final goal is to include all processes in the frame-work, execute them, monitor their performance con-tinuously and improve them incrementally. Monitoring and performance management is an ongoing task as there is always room for improvement in both proc-esses and business goals. In addition, changes in busi-ness environments lead to changes in processes that require validation and changes in performance models.
Table 1: Framework steps and iterations
Objective Action Artifacts Tools
Clarify the high level picture of the business
•Identify Re, BG and Pr •Specify the relationship
between above artifacts •Indicate the most
important processes •RD •GM •PrM •RMS •BPMS
Finalize pre-deployment tasks
•Elaborate GM and PrM •Specify Performance
objectives and designing PeM
•Design the required DW, PMR and DES •Validate the PrM against
provided RD •PeM •PrM •DW •PMR •DES •RMS •BPMS •DW Deployment and implementation
•Deploy process models •Deploy DW •Implement and deploy
PMR •Deploy DES •PrM •DW •PeM •PMR •DES •BPMS •DW •PMS
Utilization and performance management.
•Process execution •Process monitoring and
analysis •Prioritization of improvement candidates •PrM •DW •PeM •PMR •DES •BPMS •PMS •DW •RMS
Remodeling and alignment ••Improve PrM Improve BG •Validation •PrM •BG •BPMS BG: Business Goals BPMS: Business Process Management System DES: Data Exchange Services DW: Data Warehouse GM: Business Goals Models Re: Requirements
RD: Requirements Documents Pr: Processes
PrM: Processes Models PeM: Performance Model
PMR: Performance Management Reports PMS: Performance Management System RMS: Requirement Management System
The first step is to specify business goals and proc-esses. An RMS is used to trace requirements between the process and goal models through the data exchange layer. The most important processes are selected for the first iteration based on goals and requirements us-ing a web-based requirement prioritization tool con-nected to jUCMNav through the data exchange layer.
In the next stage, the selected process and goals are explained in more detail. After specifying the perform-ance objectives, Key Performperform-ance Indicators (KPIs) and dimensions of the performance analysis are added. This refined model is used for designing data ware-house schema and performance reports runnable using a BI tool. Finally, the detailed process model is
vali-dated against the requirements to make sure deployed processes perform as expected.
In the deployment and implementation phase, the required infrastructure is provided and the processes are deployed to a process execution engine. In addi-tion, the designed DW schema is implemented and the performance reports are created in the BI tool.
In the fourth step, the processes are executed and performance management is performed (see sec-tion 3.2). The last step relates to process improvement based on results generated from performance analysis. In the next iteration, new processes and revised goals and objectives can be used in addition to the improved processes. In a fast-pace application domain, one could even think of using this framework to provide adaptive processes with dynamic optimizations.
3.1 Framework core models
The three core artefacts of the framework are mod-els for goals, processes, and performance. Figure 5 and Figure 6 describe their associations and mutual effects.
Figure 5: Framework models organization
Figure 5 shows that all three main artefacts are modeled in a hierarchical manner. The hierarchy in the goal model is based on the decomposition of high-level goals into operational goals that can be used to decide about the atomic components of the process models (i.e. tasks, responsibilities, and even architectures). The goal hierarchy can also reflect the process hierarchy. After defining the processes at different levels of ab-stractions, one can create a goal model for each level. Goal hierarchies are demonstrated using GRL contri-bution links and diagrams. On the other hand, process hierarchies can be motivated by the organizational structure of a business or by abstraction layers defined by process authors. The process hierarchies are mod-eled using UCM stubs and plug-ins (sub-maps).
In the performance model, both hierarchical KPI and direct KPI are defined. While hierarchical KPI at higher levels of the hierarchy are the aggregation of the same type of KPI at lower levels, direct KPI only
evaluate one particular process or sub-process and do not affect other layers.
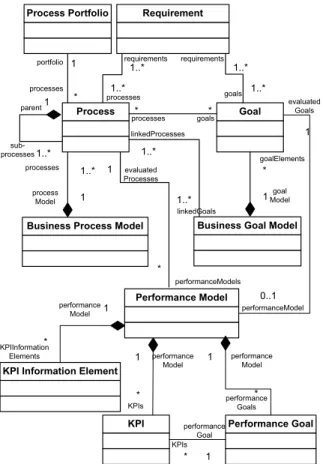
Figure 6 defines these artefacts and the relationships between them. Goals and processes are defined to ful-fill the specified requirements. Each process model is a use case map constructed by one or multiple processes. Business goal models can be defined only for one process or depict the objectives behind multiple proc-esses. In addition, each process can have one goal model or multiple goal models to distinguish the (often conflicting) objectives of different stakeholders. Per-formance models are derived from goal models which have been demonstrated as an association link. Each process can have multiple performance models that evaluate the processes from different aspects of the business or from the perspectives of multiple stake-holders. Performance models are created using per-formance goals, information elements and KPI.
Business Goal Model Business Process Model
Performance Model Requirement
KPI Information Element
Performance Goal 1 1..* 1 * KPI 1 * 1 * 1 * Goal 1 * Process * 1 1..* 1..* 1 0..1 Process Portfolio 1..* 1..* 1 * 1..* 1..* * * 1 1..* portfolio processes sub-processes parent requirements processes requirements goals processes goals processes process Model goal Model goalElements linkedProcesses linkedGoals evaluated Processes performanceModels performanceModel evaluated Goals performance Model KPIInformation Elements KPIs performance Model performance Model performance Goals KPIs performance Goal
Figure 6: Framework modeling components
3.2 Performance monitoring
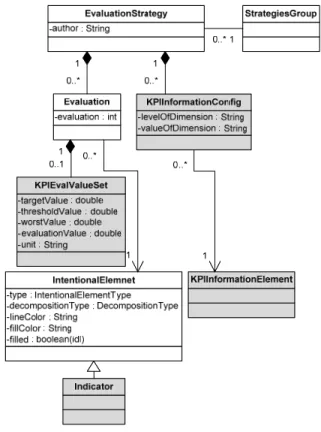
Business process performance modeling is a new application area for URN. As a result, the original URN meta-model needed to be extended to support the required functionalities, which are shown as shaded classes in Figure 8 and Figure 9.
KPI evaluation and mapping to GRL initial evalua-tion levels is done through four value sets associated to each KPI: Target Value, Threshold Value, Worst Value and Evaluation Value. Target Value is the expected performance of the process under evaluation. Thresh-old Value is used to separate acceptable from unac-ceptable values, while Worst Value is used to specify the most serious condition from a users’ perspective. These three values are adjustable as required. The Evaluation Value is the KPI’s actual value retrieved from back-end business data sources at run-time or defined by users for test purposes at design time. Figure 7 illustrates how these four values are mapped to GRL evaluation levels. These concepts are elabo-rated in more detail in [31].
Threshold Value Target Value Worst Value 100 0 -100
KPI (Evaluation Level)GRL Strategy > 100
< -100
Figure 7: GRL initial evaluation level mapping
As demonstrated in Figure 8, Indicator inherits all features of GRL intentional elements. Thus, a KPI can be used for evaluatation in a way similar to tasks and goals in a GRL model. Indicators also have some specific features such as groups that can be used to categorize KPIs for redesigning, filtering and other user-defined purposes. In addition, performance model links are used to link indicators to KPI information elements. These elements allow users to add detailed information (e.g. dimensions) to performance models. Dimensions can specify data categories and hierarchies used for aggregating and summarizing data [11] [19].
Figure 9 illustrates the extensions to GRL evalua-tion strategies. Unlike the initial design for indicators in [31], the KPI value sets in the new meta-model are defined as values of KPI strategies. This new design allows users to define multiple strategies and, conse-quently, evaluation value sets for a KPI. This feature also helps users define and compare different possibili-ties. KPIInformationConfig contains a set of specific dimension information that will be used for retrieving KPI values under each strategy. Those dimension in-formation include the level of dimension and the value
of dimension. The dimension settings define a specific context for KPI evaluation and the setting information will be used to build data models and KPI reports on the BI server. For example, for the KPI “number of complains” on the time dimension in Figure 17, in dif-ferent evaluation strategies, users may want to evaluate in both monthly and daily basis, so the level of dimen-sion could be month and day. When building the data model, the smallest or lowest level will be chosen to be the granularity of the data model. On the other hand, when creating KPI reports, the value of dimensions in different evaluation strategies can be used to select ranges of values from the data model, such as the year 2006 or February 2007.
Figure 8: Meta-model for performance models
3.2.1 Performance and impact analysis
Since business processes usually span organiza-tional structures, their monitoring and analysis intro-duce specific requirements that cannot be fulfilled by ordinary BI tools [27]. Combining business process monitoring with UCM scenarios [17] enables business users to achieve performance analysis and impact analysis on specific parts of the processes of interest.
As shown in Figure 10, scenarios are used to high-light parts of processes which include tasks and re-sponsibilities that go through different organizational units. The process models are connected to perform-ance models from one side and goal models from the other side. After a scenario definition is enabled by the
user, our tool activates all the KPIs that have been de-fined in that path. Thereafter, the performance of that part of process is shown. This displays the impact of the highlighted part of the process on the related goals of the organization.
Figure 9: Meta-model of KPI strategies
Based on work for integrating scenarios and goals in [34], monitoring and performance analysis of proc-esses in an automated and integrated manner is a new concept that demonstrates the real value of URN in the context of BPM. Figure 11 shows the workflow of sce-nario-based impact analysis among several modules of the tool. Scenario & Strategy View Scenario Manager Strategy Manager KPI Manager GRL Model Editor 1 2 User 8 6 Performance / Goal Model Component 5 7 4 3
Figure 11: Scenario-based performance and impact analysis – run-time sequence model
First, the user chooses a scenario and a performance evaluation strategy to give the evaluation a context (1), the scenario & strategy view sends a request to the scenario manager (2), which triggers the scenario and finds relevant performance models. The responsibili-ties and sub-processes in the scenario get mapped to their counterpart in the performance models (3). Sub-sequently, by scenario manager’s request (5), the KPI manager retrieves KPI values from the monitoring ser-vices (via the data exchange layer) and maps them to evaluation levels (6), as seen in Figure 7. The strategy is then triggered by scenario manger (7) and the evaluation results are presented to the users on the new jUCMNav KPI View, with their impact simultaneously shown on the goal model.
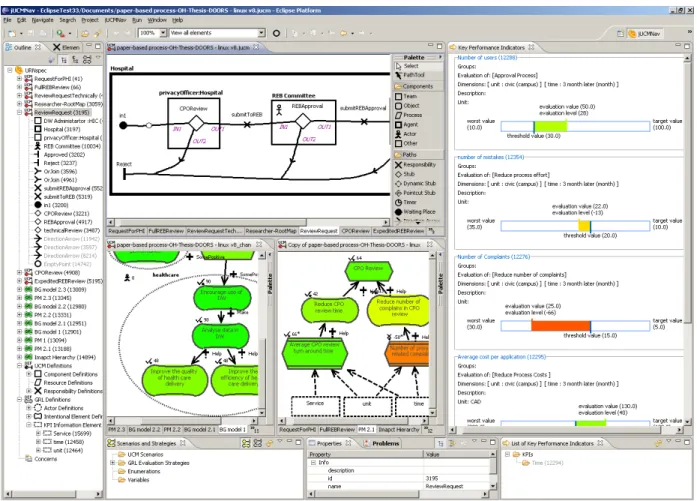
Figure 12 highlights the extensions made to jUCMNav’s user interface to support the new frame-work. jUCMNav extends standard Eclipse views (Out-line, Properties, and Problems) with graphical editors for UCM (process model) and GRL (goal model). In our framework, the GRL editor was further extended to support the definition of KPI and dimensions. The Scenarios and Strategies view is used to define and execute GRL strategies and UCM scenarios, which result in colour feedback in the models.
This view was extended to support KPI strategies and evaluation. Another view was added to list KPIs. Last but not least, the new Key Performance Indicators view (on the right side) is where the KPI results are visualized in terms of the four value sets discussed in the previous section.
3.2.2 Process portfolio analysis
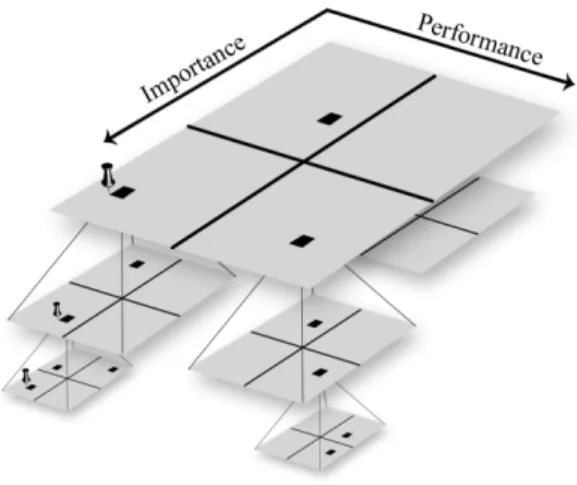
A process portfolio consists of multiple processes modeled in an organization. This view is a representa-tion of all processes in a hierarchical quadrant with drill-down and drill-up capabilities. It gives users an overall understanding of the current status of existing processes and helps them decide the next step in a BPM project (e.g., prioritization of the next targets for improvement or the next candidate process for out-sourcing [13]). In addition, it provides the capability for users to pinpoint a malfunctioning process and drill-down to the next levels of abstraction to find out the sources of problems (Figure 14).
Although using quadrants for analysing process portfolios has been already introduced in [13], using process models (UCM), goal models (GRL), and per-formance models (GRL+KPI) to provide this capability in a hierarchical structure is a novel concept. Goal and performance models are used respectively to calculate the importance and performance values of the proc-esses that are the two axes of the quadrant (Figure 14) and process models are used to specify the hierarchical structure.
In our definition, the importance value is the aver-age satisfaction level of the top-level business goals when a process performs at its 100% capacity. In other words, importance is the impact of the business proc-ess on the businproc-ess goal model. The performance value is computed from the performance model as described in section 3.2.
Figure 14: Process portfolio – drill down scenario
Each layer of a process portfolio view includes all the responsibilities and sub-processes (stubs) of a UCM map. This view is synchronized with the process view and the KPI view. Hence, while users browse the processes (i.e. individual UCM maps) this view and the KPI view are changed based on the current process being observed.
The workflow among the relevant modules of the framework to support the process portfolio view is very similar to the one in Figure 11. First, the user chooses a process from the outline view or drills-down (using stubs) to a sub-process in the UCM view (1). A request is then sent to the process portfolio manager (2). Subsequently, the process portfolio manager finds all the performance and goal models that are related to the selected map/process (3). Next, an importance strategy is created, initialized, and triggered dynami-cally to calculate the importance value for each process (4). The process portfolio manager then creates a per-formance strategy and retrieves KPI values through the KPI manager to initialize the evaluation levels of KPIs (5 and 6). Finally, importance values and performance values for each sub-process or responsibility in the selected process are used by the portfolio manager to calculate their locations on the quadrant.
4.
Case study
To improve its quality of care, a large research hos-pital in Ontario aims to facilitate the access to its data warehouse (DW) to researchers and administration staff. However, granting access to a large DW can cause many issues, including compliance with personal health information protection regulations in Ontario (PHIPA) [30]. As these issues need to be addressed by the hospital, the latter has defined a business process called DW Approval Process. Figure 15 illustrates the top-level view of this process, whereas Figure 16 and Figure 17 describe the business goals and performance models respectively.
The most important part of this process is the re-view request sub-process, shown in Figure 18, which is the focus of this case study. In a nutshell, the CPORe-view responsibility is performed by the chief privacy officer (CPO) to ensure that the requested data will not violate the relevant privacy laws. For REBApproval, the research ethics board (REB) of the hospital evalu-ates the intended usage of the data. The data warehouse administrator reviews the request (technicalReview) to make sure the requested data can technically be ob-tained from the warehouse and that the users’ access rights are defined properly. However, this process takes time to be completed, and therefore it needs some improvement.
Figure 15: DW approval process
Figure 16: Approval process goals
Figure 17: Approval process performance model
As illustrated in Figure 16, several KPIs have been defined which can improve this process. In the initial step, the business goals and performance models of these three sub-processes are created using jUCMNav. For example, Figure 19 and Figure 20 define the mod-els for the technical review sub-process.
Figure 19: Technical review goal model
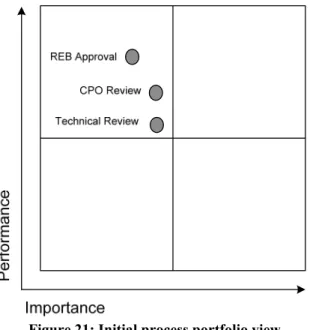
Based on these models and KPI values defined in Table 2, we obtained the result reported in Table 2 Table 3. We replicated the hospital’s DW schema and infrastructure in our lab for this experiment, but we used a fake data set for privacy reasons. Figure 21 shows the corresponding process portfolio view. So far, all sub-processes have almost similar levels of im-portance, but the REB review has the highest perform-ance.
Figure 20: Technical review performance model
Table 2: KPI value sets
KPIs T Th W EV EL
Average CPO review
turn-around time (days) 3 15 30 7 66
Number of privacy related
complains 2 7 15 4 60
Average time lag between CPO review and REB
review (days)
1 5 15 3 50
Average turnaround time of
viewing REB (days) 2 8 15 6 33
Number of review mistakes 5 12 20 8 57 Average time lag between
REB review and DW review (days)
2 6 16 3 75
Average technical review
turnaround time (days) 2 7 15 5 40
Number of technical review
mistakes 5 8 15 6 66
Number of complaints 5 15 30 9 60
Number of users 100 30 10 35 7
Average approve
turn-around time (days) 7 30 60 18 52
number of mistakes 10 20 35 12 80
Average cost per
application 100 150 200 130 40
T: Target Value; Th: Threshold Value; W: Worst Value EV: Evaluation Value; EL: Evaluation Level (GRL)
Table 3: Initial results
CPO Review REB Review DW Review Approval Process Importance 37.6 36.7 37.6 32.67 Performance 71 78 60 89
To further showcase the properties of our BPM framework’s methods and tool, we considered the fol-lowing scenario. After a three-month period, the hospi-tal substantially increased the number of DW users. Presumably, the results observed in this new context would be updated as shown in Table 4 and Table 5.
Table 4: Modified results after changing KPI values
CPO Review REB Review DW Review Approval Process Importance 28.25 27.5 57.75 40 Performance 50 76 49 50
Table 5: Modified KPI value sets
KPIs T Th W EV EL
Number of privacy related
complains 2 7 15 6 20
Number of review
mis-takes 5 12 20 10 28 Average number of DW performance complains 3 8 15 10 -28 Number of complaints 5 15 30 16 -6 Number of users 100 30 10 50 28 number of mistakes 10 20 35 15 50
T: Target Value; Th: Threshold Value; W: Worst Value EV: Evaluation Value; EL: Evaluation Level (GRL)
Figure 21: Initial process portfolio view
DW stakeholders start to send in various types of complaints. The type dimension defined for complaints KPI allows one to categorize the complaints based on their type. The number of complaints about DW effi-ciency is the highest, but we also have some privacy complaints.
Figure 22: Revised technical review goal model
After having experienced inefficiencies in the DW, the number of users starts decreasing once more and the hospital realizes that efficiency contributes signifi-cantly in encouraging users to use the DW.
As a result, Figure 19 is updated to Figure 22, and Figure 20 to Figure 23. The process portfolio view changes to Figure 24. Such modifications to the goals inevitably lead to changes in the business processes in order to bring the process portfolio back to a sweet spot performance-wise and satisfy stakeholders and the organization.
Figure 23: Revised technical review performance model
Perf
orm
ance
Figure 24: Updated process portfolio view
5.
Discussion and future work
In this paper, we have introduced a business process management framework based on the URN modeling notation with integrated tool support through jUCM-Nav. The semantics of the framework is provided by an extensible meta-model designed to support more capabilities as requirements arise.
The focus of this paper was on the business process monitoring and performance management aspects of the framework.
First, we introduced the concept of performance models, derived from business goal models, which
help organizations improve both their processes and goals. Second, a scenario-based technique for perform-ance and impact analysis has been elaborated. This new feature of the framework allows users to filter out the rest of the performance models and only analyze the part of the processes covered according to UCM scenario definitions. Finally, we talked about process portfolio analysis. In this case, we elaborated how a quadrant view of the modeled processes allows one to see the performance of processes and their level of importance for the business. In addition, it allows users to drill down into process hierarchy and find out the roots of the problems.
The framework and its supporting tool can be com-pared with other similar methods from three perspec-tives: modeling notation, methodology and integration with tools. One of the most important competitive ad-vantages of the suggested framework is its modeling notation – URN. Using the original URN, we are able to model goals and processes. With the proposed ex-tension, we can also illustrate performance models.
In terms of methodology steps, the proposed ap-proach uses common steps of process improvement methods but also provides some enhancements. First, unlike BPR, it does not suggest radical and revolution-ary improvements in all processes. However, at the same time, the methodology does not suggest to focus on small-grained details that cause the big picture to be lost, which is often the case for statistical-oriented im-provement methods like six sigma [36]. Instead, the methodology suggests a spiral approach of improve-ment. After creating the global model, each subsequent iteration deals with the most important processes. Fi-nally, unlike classical improvement methods that have trouble gathering information about processes scattered across an organization [40], our framework provides a data exchange layer capable of obtaining data from different sources including data warehouses and busi-ness intelligence systems.
Table 6 briefly compares our URN-based BPMS with other major BPMS in the industry. Relevant crite-ria include support for process modeling, KPI model-ing and evaluation, and goal modelmodel-ing and evaluation. The table shows that by providing an integrated system based on URN, our solution can provide stronger sup-port for modeling and evaluation across processes, KPIs and goals. Note however that many of the other tools provide more detailed descriptions of business processes and many support process automation.
For future work, we plan to enrich the framework in different ways including: integration with a business process execution engine, automated deployment of the process models, simulation of the processes in real scenarios before deployment, improvement of the processes using business process redesign patterns, and
pattern recognition in business processes using some of the techniques that has been used in Aspect-oriented URN [29]. Integration between jUCMNav and other BPMS will be explored. In addition, during this study, we encountered some limitations of the current GRL propagation algorithm that require contribution links to become completely quantitative. Better handling of negative contributions is also required.
Table 6: Comparison between BPMM tools
Process modeling KPI modeling and evaluation Goal mod-eling and evaluation Our URN-based BPMS IBM WebSphere Process Integration [16] Intalio BPMS [14] Appian Enterprise BPM Suite [2] Tibco iProcess Suite [7] G360 Enterprise BPM Suite [10] Lombardi Team-works BPMS [23]
: Supported via integration : Partial supported
: Not supported
Acknowledgement—This research was supported
by the Ontario Research Network on e-Commerce. We are grateful to Telelogic and Cognos for providing us with their tools, and to J. Kealey, G. Mussbacher, B. Zhan and J. Sincennes for their help with the vari-ous tools used in this framework.
References
[1] Amyot, D., “Introduction to the User Requirements Notation: Learning by Example”. Computer Networks, 42(3), 285–301, 21 June 2003
[2] Appian. 2007. http://www.appian.com/
[3] Bruce Silver Associates, The 2006 BPMS Report:
Un-derstanding and Evaluating BPM Suite. Published in
collaboration with BPMInstitute.org, 2006
[4] Enix Consulting, Issues and Best Practices for the BPM
and SOA Journey, white paper, 2006
[5] Cognos, Cognos 8 Business Intelligence, 2006. http://www.cognos.com/businessintelligence/ [6] Debevoise, T., Business Process Management with a
Business Rules Approach. Business Knowledge
Archi-tects, 2005
[7] DiToro, Lou, and Dian Schaffhauser. BPM Software
Report: Tibco iProcess Suite 10.5. BPMEnterprise.com,
CTQ Media LLC., 2006.
[8] Dresner, H., “Business Activity Monitoring”. Gartner
Symposium, Cannes, France, 4–7 November 2003
[9] Ghanavati, S., A Compliance Framework for Business
Processes Based on URN, M.Sc. thesis, University of
[10]Global 360. 2007. http://www.global360.com [11]Gong, L. et al., Deliver an effective and flexible data
warehouse solution, Part 2: Develop a warehouse data
model, IBM, Jul 2005
[12]Grigori, D. et al., “Business Process Intelligence”.
Computers in Industry, 53(3), April 2004
[13]Heß, H., “From Corporate Strategy to Process Perform-ance – What Comes after Business Intelligence?”.
Cor-porate Performance Management, Springer, 7–29, 2006
[14]Intalio. 2007. http://www.intalio.com/
[15]ITU-T, Recommendation Z.150 (02/03): User
Require-ments Notation (URN) – Language requirements and
framework, Geneva, Switzerland, 2003
[16]Wahli, Ueli, Vedavyas Avula, Hannah Macleod, Mohamed Saeed, and Anders Vinther. Business Process Management: Modeling through Monitoring Using
WebSphere V6.0.2 Products. IBM Redbooks, 2007.
[17]Kealey, J., Enhanced Use Case Map Analysis and
Transformation Tooling. M.Sc. thesis, University of
Ot-tawa, Canada, October 2007.
[18]Keen, M. et al. Patterns: SOA Foundation - Business
Process Management Scenario. IBM Redbooks, 2006.
[19]Kimball, R. and Ross, M., The Data Warehouse Toolkit:
The Complete Guide to Dimensional Modeling, John
Wiley, April 2002
[20]Kronz, A., “Managing of Process Key Performance Indicators as Part of the ARIS Methodology”.
Corpo-rate Performance Management, Springer, 31–44, 2006
[21]Küng, P., Hagen, C., Rodel, M., and Seifert, S., “Busi-ness Process Monitoring & Measurement in a Large Bank: Challenges and Selected Approaches”. Proc. 16th Int. Workshop on Database and Expert Systems
Appli-cations (DEXA’05), 955–961, August 2005
[22]Liu, L. and Yu, E., “Designing Information Systems in Social Context: A Goal and Scenario Modelling Ap-proach”. Info. Systems, Elsevier, 29(2), 187–203, 2004 [23]Lombardi Software. 2007.
http://www.lombardisoftware.com/
[24]Longo, A. and Motta, G., “Design Processes for Sus-tainable Performances: A Model and a Method”. BPM
2005 Workshops, LNCS 3812, Springer, 399–407, 2006
[25]Marketos, G. and Theodoridis, Y., “Measuring Perform-ance in the Retail Industry”. BPM 2006 Workshops, LNCS 4103, Springer, 129–140, 2006
[26]Mili, H. et al., Business Process Modeling Languages: Sorting Through the Alphabet Soup, TR LATECE, No-vember, 55 pages, 2003
[27]Nicholls, C., In Search of Insight. SeeWhy Software Limited, August 2006
[28]Mussbacher, G., “Evolving Use Case Maps as a Sce-nario and Workflow Description Language”. 10th
Workshop of Requirement Engineering (WER’07),
To-ronto, Canada, 56–67, May 2007.
[29]Mussbacher, G., Amyot, D., and Weiss, M., “Visualiz-ing Early Aspects with Use Case Maps”. To appear in:
LNCS Journal on Transactions on Aspect-Oriented
Software Development, Springer, 2007
[30]PHIPA, Personal Health Information Protection Act, Government of Ontario, Canada, 2004. http://www. region.peel.on.ca /corpserv/phipa/index.htm [31]Pourshahid, A., Chen, P., Amyot, D., Weiss, M., and
Forster, A. J., “Business Process Monitoring and Alignment: An Approach Based on the User Require-ments Notation and Business Intelligence Tools”. 10th
Workshop of Requirement Engineering. (WER’07),
To-ronto, Canada, 80–91, May 2007
[32]Reijers, H.A., Process-Aware Information Systems. John Wiley & Sons. Inc., 2005
[33]Roy, J.-F., Kealey, J., and Amyot, D., “Towards Inte-grated Tool Support for the User Requirements Nota-tion”. SAM 2006: Fifth Workshop on System Analysis
and Modelling, LNCS 4320, Springer, 198–215, 2006
http://jucmnav.softwareengineering.ca/
[34]Roy, J.-F., Requirement Engineering with URN:
Inte-grating Goals and Scenarios, M.Sc. thesis, University
of Ottawa, Canada, March 2007
[35]Rudden, J., “Making the Case for BPM - A Benefits Checklist”. BPTrends, January 2007
[36]Touch Point, “Why Six sigma is not complete without BPM”. Business Process Management: Practical
Guidelines to Successful Implementations, John Jeston
and Johan Nelis, 2006
[37]Vonderheide-Liem, D.N. and Pate, B., Applying Quality Methodologies to Improve Healthcare: Six Sigma, Lean
Thinking, Balanced Scorecard, and More. HCPro, Inc.
November 2004
[38]Weiss, M. and Amyot, D., “Designing and Evolving Business Models with URN”. Montreal Conf. on
eTech-nologies (MCeTech), Montreal, Canada, 149–162, Jan.
2005
[39]Weiss, M. and Amyot, D., “Business Process Modeling with URN”, International Journal of E-Business
Re-search, Vol. 1, No. 3, 63–90, July-September 2006
[40]Williams, B. BPM: The Next stage for Continuous Process Improvement . Software AG, webMethods, 2007