DigitalCommons@USU
DigitalCommons@USU
All Graduate Theses and Dissertations Graduate Studies
5-2012
Exploring the Effects of 1:1 Laptop Implementation on
Exploring the Effects of 1:1 Laptop Implementation on
Quantifiable Student Outcomes in Junior High School Science
Quantifiable Student Outcomes in Junior High School Science
Classes Between Demographic Subpopulations of Students
Classes Between Demographic Subpopulations of Students
Ryan C. Hansen Utah State University
Follow this and additional works at: https://digitalcommons.usu.edu/etd
Part of the Education Commons
Recommended Citation Recommended Citation
Hansen, Ryan C., "Exploring the Effects of 1:1 Laptop Implementation on Quantifiable Student Outcomes in Junior High School Science Classes Between Demographic Subpopulations of Students" (2012). All Graduate Theses and Dissertations. 1355.
https://digitalcommons.usu.edu/etd/1355
This Dissertation is brought to you for free and open access by the Graduate Studies at
DigitalCommons@USU. It has been accepted for inclusion in All Graduate Theses and Dissertations by an authorized administrator of DigitalCommons@USU. For more information, please contact
STUDENT OUTCOMES IN JUNIOR HIGH SCHOOL SCIENCE CLASSES BETWEEN DEMOGRAPHIC SUBPOPULATIONS OF STUDENTS
by Ryan C. Hansen
A dissertation submitted in partial fulfillment of the requirements for the degree
of
DOCTOR OF PHILOSOPHY in
Education
(Curriculum and Instruction) Approved:
Dr. Michael Freeman Dr. James Dorward
Major Professor Committee Member
Dr. Barry Franklin Dr. Steve Laing
Committee Member Committee Member
Dr. Brett Shelton Dr. Mark R. McLellan
Committee Member Vice President for Research and
Dean of the School of Graduate Studies
UTAH STATE UNIVERSITY Logan, Utah
2012
Copyright © Ryan C. Hansen 2012 All Rights Reserved
ABSTRACT
Exploring the Effects of 1:1 Laptop Implementation on Quantifiable Student Outcomes in Junior High School Science Classes Between Demographic Subpopulations of Students
by
Ryan C. Hansen, Doctor of Philosophy Utah State University, 2012 Major Professor: Dr. Michael Freeman
Department: Education
Digital technology is becoming increasingly affordable and schools are engaging in 1:1 implementations faster than research can support. Laptop implementations in a 1:1 ratio promise personalized instruction and more access to enriched curriculums and information. As schools transition, it is imperative they know and can predict what the impact on measures of student achievement will be. This is especially so for more “at‐risk” student populations.
During the 2010‐2011 school year, a Utah junior high school implemented a 1:1 laptop program to investigate the demands of 1:1 implementation prior to other area schools making similar transitions. Exploratory research was conducted on science classes to investigate the initial reaction of different demographic groups to a 1:1 laptop implementation. Four measures of student outcomes were evaluated (academic credits gained, class grades, attendance, and incidents of discipline referral). After 5 months of 1:1 implementation in science, it was found that:
Most demographic groups experienced little or no change in measured outcomes after the laptop was introduced 1:1. There were no demographic groups that performed significantly better with laptops than they did previously without them.
Low‐income White students performed relatively worse on academic measures than did all other demographic groups after laptops were introduced.
Low‐income ethnic minority students measured slight improvement on class grades after laptops were introduced, and this reaction appeared to be different from the low‐ income White students.
Students who participated in a laptop computer class that was in addition to their science class achieved slightly better grades in science than did students who only used the laptop in science.
The introduction of laptops appeared to have little or no consistent influence on student attendance or discipline referral although teachers did state classroom management required adjustments after laptop introduction.
Because of the different responses by the more “at‐risk” student populations to 1:1 implementation, it is important that additional research be conducted on the different reactions of demographic subpopulations in the 1:1 setting. This exploratory study helped provide a referential foundation and questions from which additional research and more effective laptop implementations can begin.
PUBLIC ABSTRACT
Exploring the Effects of 1:1 Laptop Implementation on Quantifiable Student Outcomes in Junior High School Science Classes Between Demographic Subpopulations of Students
by
Ryan C. Hansen, Doctor of Philosophy Utah State University, 2012
The use of internet‐based information and digitalized resources is becoming increasingly common in public schools. Laptops or tablets are being provided to students in a 1:1 ratio to be used in accessing instructional information and also as a medium of interaction between the student and the teacher. As schools transition to digital systems of instruction, it is imperative that administrators can predict what the impact on measures of student achievement will be and especially for the more “at‐risk” student populations.
To investigate the initial reaction of different demographic student groups to a 1:1 implementation, exploratory research was conducted at a school piloting such a program in science classes. Four measures of student outcomes were used in evaluation: academic credits gained, class grades, attendance, and incidents of discipline referral. After 5 months of implementation, most demographic groups experienced little or no change in measured outcomes after the laptop was introduced 1:1. There were no demographic groups that performed significantly better with laptops than they did previously without them. Low‐income White students performed relatively worse on academic measures than did all other demographic groups after laptops were introduced and this was in contrast to the more neutral responses experienced by all other demographic groups. The
introduction of laptops appeared to have little or no consistent influence on student attendance or discipline referral to administration.
Because of the different responses by the different demographic groups to 1:1 implementation on academic measures, it is important that additional research be conducted. In addition to providing a referential foundation and questions for future research, helpful information and insight is also available to the school administrator who may be considering similar digital transformations for their schools.
DEDICATION
To my wife, Rachelle Hibbard Hansen,
with gratitude and love for her unselfish support in all that I do, and
To our children, Mason, Tyson, Allyson, and Logan, with gratitude for their unconditional acceptance and love for me.
ACKNOWLEDGMENTS
Special thanks go to my committee chair, Dr. Michael Freeman, who has been outstanding in his encouragement, enthusiasm, and support. I would also like to thank the other members of my committee, Dr. James Dorward, Dr. Barry Franklin, Dr. Steve Laing, and Dr. Brett Shelton, for their efforts in my behalf. I also acknowledge and thank Dr. Anne Hunt and Brooke Robertshaw for their attention and guidance. The time you all have spent to teach me, assist me through this process, and help me is deeply appreciated.
I would like to include a heartfelt “shout out” to Utah State University and to those who make it the wonderful institution it is. The “top 25” ranking for the College of Education and Human
Services is well deserved and it has been a privilege to be a small part of it.
Thank you to my colleagues who have supported me socially and professionally through this process. They are: Dr. Jim Schmidt, Robert Ito, Dick Close, Steven Davis, Christopher Keime, Neisha Rutledge, Brian Hunt, Steven Poll, Shelly Wright, Rick Call, Dr. Rulon Homer, Dr. Logan Toone, Dr. Bryan Bowles, Dr. Paul Waite, Pam Park, Craig Poll, and Jodi Lunt.
My wife, Rachelle, is really the one who made this achievement possible. We accomplished this together. A simple “thank you” for her would not be sufficient. Hopefully, you will continue to love me now that I am home more often. Thank you to our four children, Mason, Tyson, Allyson, and Logan. I apologize for the many hours this has taken me away from you. Although it is an important accomplishment for our family, it is not more important than the time we spend together. It is my wish that the lessons learned from this experience will serve us well so the benefits will someday outweigh the costs. The four of you and your mother are what matter most to me.
Thanks to my mom and dad for always believing in me and to my mother‐ and father‐in‐law for their continued support.
Best wishes and warm regards to you the reader. From here on out, you might find the reading a little less entertaining.
CONTENTS Page ABSTRACT ... iii PUBLIC ABSTRACT ... v DEDICATION ... vi ACKNOWLEDGMENTS ... vii LIST OF TABLES ... xi
LIST OF FIGURES ... xii
CHAPTER 1. INTRODUCTION ... 1
Background ... 1
Problem Statement ... 4
Purpose and Objectives for Research ... 6
Research Question ... 7
Potential or Expected Outcomes as Described in the Literature ... 7
Description of the 1:1 Implementation and the Study ... 9
Delimitations of the Research ... 18
Context of This Study ... 22
2. LITERATURE REVIEW ... 24
Global 1:1 Implementations ... 24
1:1 Initiatives in America ... 25
Internet Capable Laptop as a Tool to Establish Social Equity ... 26
The Digital Divide as a Reflection of Social Inequity and Inequity in Academic Achievement ... 28
The Achievement Gap as It Exists in the Local Student Population Examined in This Study 30 Researching 1:1 Implementation Using a Structural Frame ... 31
Five Structural Reasons of Support for 1:1 Initiatives ... 32
Laptop Initiative Influence on Education: A Review of Scientific Data ... 36
3. METHODS ... 46
General Description ... 46
Research Design: Comparing Student Outcomes After 1:1 Implementation Using Exploratory Data Analysis or EDA ... 47
Teacher and Class Selection... 49
Student or Subject Selection ... 51
Student Groups Being Compared ... 53
Student Privacy and Data Storage ... 56
Student Outcomes and the Measures Used to Quantify Them ... 56
Page
Importance of Change Scores (Gain Score) for Comparison ... 61
Treatment ... 62
Comparisons Used to Identify the Different Reactions of Demographic Groups to 1:1 Implementation ... 62
Comparisons and Tests Used to Identify Mean Difference ... 70
Summary of Steps Used for Establishing Change Scores and Making Comparisons ... 78
4. FINDINGS AND ANALYSIS ... 83
Introduction ... 83
Demographic Mean Bar Graph Comparisons for Student Outcome Measures ... 85
Reporting of Statistics of Difference as Determined by Effect Size Measures and the pValues Associated with Comparisons ... 85
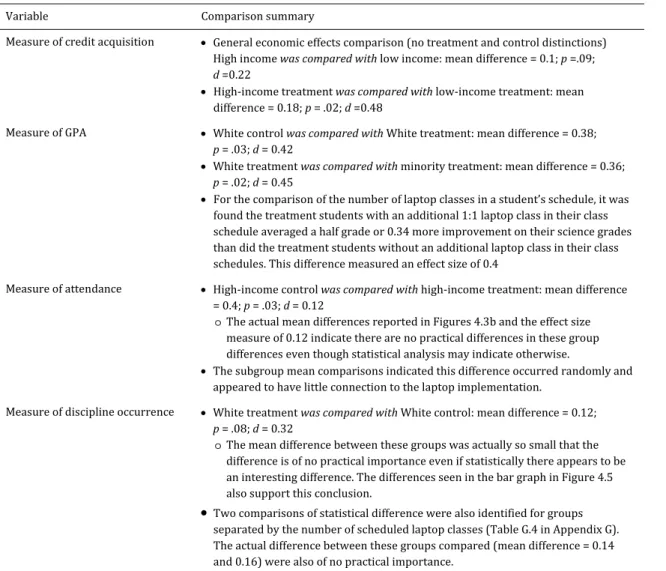
Findings for Measures Used to Compare Acquisition of Credit (Pass/Fail Rates) ... 91
Findings for Measures Used to Compare Student Grades or GPA ... 94
Findings for Measures Used to Compare Student Attendance ... 98
Findings for Measures Used to Compare Rates of Negative Discipline Occurrence ... 99
5. DISCUSSION OF FINDINGS ... 101
Introduction ... 101
Review of the Research Question and Context of the Study ... 101
Answering the Primary Research Question... 103
Answering the Secondary Research Questions ... 104
A Comparison of the Outcome Measures of this 1:1 Laptop Study to the Related Scientific Literature ... 109
Extending the Findings and Results of this Local Study to the Larger Theoretical 1:1 Implementation Discussion ... 116
Suggested Applications of the Results for Educational Administrators for Each of the Outcome Measures ... 120
Suggestions for Future Research ... 123
Summary of Important Findings ... 126
Essential Questions: Summary of Areas for Future Research ... 127
REFERENCES ... 129
APPENDICES ... 137
Appendix A: Letters of Permission to Conduct Research from Utah State University and Davis School District ... 138
Appendix B: Professional, Student, and Parental Responsibility Documents for Participation in the 1:1 Laptop Pilot ... 141
Appendix C: Teacher Development Curriculum Outline and Training Meeting Schedules and Agendas ... 150
Appendix D: Davis School District Plan for School 1:1 Implementation ... 162
Appendix E: Summary Tables for Treatment and Control and Demographic Group Comparisons ... 166
Appendix F: SPSS Outputs for Tests of Statistical Analysis for Treatment and Control and Demographic Group Comparisons ... 172
Appendix G: Summary Tables for Treatment and Control and Laptop Classes Scheduled Group Comparisons ... 201
Page Appendix H: SPSS Outputs for Tests of Statistical Analysis for Treatment and Control
and Number of Laptop Classes Scheduled Group Comparisons ... 204 VITA ... 222
LIST OF TABLES
Table Page
2.1 Graduation and End of Level Criterion Referenced Test Proficiency Rates for the
Selected Junior High School and the 2009‐10 School Year ... 30
2.2 Summary of Common and Impactful Literature about Findings Related to 1:1 Implementation ... 39
2.3 Summary of Common and Impactful Literature about Other Findings Related to 1:1 Implementation ... 39
3.1 A Summary of the Chain of Evidence ... 82
4.1 Summary of All Findings of Statistical Difference for Groups Compared ... 89
4.2 Subgroup Mean Change Scores for Academic Outcome Measures ... 90
4.3 Specific Pairwise Comparisons of Statistical Difference Between Demographic Subgroups for Credit Acquisition ... 92
4.4 Specific Pairwise Comparisons of Statistical Difference between Demographic Subgroups for GPA ... 94
E.1 Credit Acquisition Comparisons by Ethnic Groups ... 168
E.2 Credit Acquisition Comparisons by Economic Groups ... 168
E.3 Grade Point Average Comparison by Ethnic Groups ... 169
E.4 Grade Point Average Comparisons by Economic Groups ... 169
E.5 Attendance Rate (Z score) Comparisons by Ethnic Groups ... 170
E.6 Attendance Rate (Z Score) Comparisons by Economic Groups ... 170
E.7 Negative Discipline Occurrence Comparisons by Ethnic Groups ... 171
E.8 Negative Discipline Occurrence Comparisons by Economic Groups ... 171
G.1 Credit Acquisition Comparison by Number of Assigned Laptop Classes ... 202
G.2 Grade Point Average Comparison by Number of Assigned Laptop Classes ... 202
G.3 Attendance Rate (Z Score) Comparison by Number of Assigned Laptop Classes ... 203
G.4 Rate of Negative Discipline Occurrence Comparison by Number of Assigned Laptop Classes ... 203
LIST OF FIGURES
Figure Page
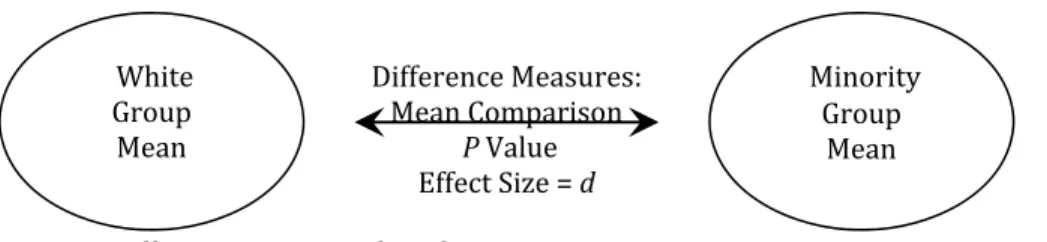
3.1 Main effects comparison for control and treatment groups ... 64
3.2 Effects comparison for ethnic groups ... 65
3.3 Effects comparison for economic groups ... 66
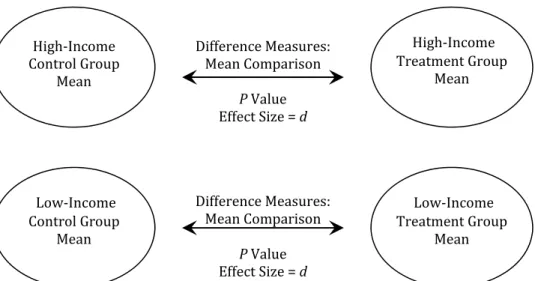
3.4 Comparison of ethnic groups (White and minority) after division into treatment and control groups ... 66
3.5 Comparison between ethnic groups for differences in treatment change scores ... 67
3.7 Comparison between economic groups for differences in treatment change scores ... 68
4.1 Demographic group means for the change score measure of credit acquisition ... 86
4.2 Demographic group means for the change score measure of term grades (GPA) ... 86
4.3 Demographic group means for the change score measure of average attendance using Zscores (a) and actual means (b) ... 87
4.4 Demographic group means for the change score measure of discipline referral to administration ... 88
CHAPTER 1 INTRODUCTION
Background
It is estimated by the National Center for Education Statistics (NCES, 2005) that the average annual difference in earnings between the high school graduate and the average American aged 18‐ 65 who did not graduate from high school is $9,600 annually. In addition to fiscal opportunity, scholars dating back to the times of Greek philosophy believe mastery of a liberal arts curriculum will empower the graduate and give them access to societal privilege (Hirsch, 1988; Strauss, 1959). The United States Department of Education reported that, “in terms of health, dropouts…report being in worse health than adults who are not dropouts, regardless of income” (NCES, 2005). Clearly, the successful completion and mastery of a formalized education system allows graduating students increased social power and opportunity (Freire, 1970) while improving their access to a higher quality of life and, as is purported to be the belief of Thomas Jefferson of TheDeclarationof
Independence fame, the pursuit of happiness. It is the primary purpose of public schools to empower students in this way (Dewey, 1916).
In the modern educational arena, the most common forms of assessment used to determine the effectiveness of a school are graduation rates and standardized test scores (United States
Department of Education [USDE,], 1983, 2001). It is believed that by raising graduation rates and test scores, a public school is giving more students access to higher standards of living than would otherwise be the case (USDE, 2001).
While course completion assessments and graduation rates determine the ratio of successful students within a class or system, standardized test scores help to insure the quality, rigor, and integrity of the graduation experience (USDE, 2001). Local and national attention to these statistical evidences of academic progress is prevalent (Utah State Office of Education [USOE], 2010). For example, it was boasted in a statewide newspaper that Utah is proud of having one of our country’s highest graduation rates (Stewart, 2006). In slight contrast to reports by the USOE’s, the National
Center of Higher Education reported that between 7,000 and 8,000 students (nearly one in five students) are annually failing in Utah’s public school systems (National Center of Higher Education Management Systems [NCHEMS] Information Center, 2005).
Also problematic, more academic failure occurs amongst the demographics of Utah’s economically disadvantaged and ethnic minority subpopulations (USOE, 2010). Within the 12% of students who did not graduate that were reported by the USOE for the 2009 school year (accounting for graduation rate changes from year‐to‐year and from study to study), the following societal subpopulation nongraduation or failure rates were identified:
The Caucasian population is at 9% failure to graduate. The Hispanic population is at 29% failure to graduate.
The African American population is at 23% failure to graduate.
The economically disadvantaged population is at 22% failure to graduate (USOE, 2010). In addition to the discrepancy seen in Utah graduation rates, standardized test scores mirror these trends. The 2009 Utah State Criterion Referenced Test percent proficiency rates show:
All students were 79.3% proficient in language arts, 66.3% proficient in math, and 65.8% proficient in science.
Caucasian students were 84% proficient in language arts, 72% proficient in math, and 72.6% proficient in science.
Hispanic students were 58.3% proficient in language arts, 42.9% proficient in math, and 37.3% proficient in science.
African American students were 62.1% proficient in language arts, 43.8% proficient in math, and 41.6% proficient in science.
Economically disadvantaged students were 66.8% proficient in language arts, 53.7% proficient in math, and 50.2% proficient in science (USOE, 2010).
This discrepancy that exists across the nation and between ethnic and socioeconomic subpopulations (Coleman et al., 1966; USDE, 1983, 2001) is commonly referred to as an achievement gap and is often used as evidence of existing societal repression (Lareau, 1987).
Some believe (Negroponte, 2010), as evidenced by the One Laptop Per Child website
(http:laptop.org), by giving internet capable laptops to students, a vast world of information becomes available to them regardless of societal circumstances (Anytime Anywhere Learning Foundation [AALF], 2012; Negroponte, 2010; One Laptop Per Child [OLPC], 2010).
The common term in today’s culture used to describe initiatives where laptops or other digital devices are provided to students in a one‐to‐one ratio is a one‐to‐one [1:1] initiative (Penuel & SRI International, 2006). A belief held by one of the founders of the OLPC movement, Nicholas Negroponte, which helps to drive this movement is that nearly all human interactions will someday be conducted through personalized digital devices in a 1:1 setting (Negroponte, 1995). As evidenced by the OLPC website and others similar to it (AALF, 2012), it is believed that internet access in a 1:1 ratio will have a transforming effect on teaching and learning and create a more equitable
educational environment (AALF, 2012; Apple Classrooms of Tomorrow—Today, 2008; OLPC, 2010). In the early 1990s, the term 1:1 was often used when laptops were provided to students. In today’s schools, the term 1:1 could refer to a variety of devices distributed to students such as tablets, iPods, or smart phones that can provide digital connections to the internet or other sources of information or communication helpful to students (Penuel & SRI, 2006).
There are also many ways a 1:1 initiative could be structured within the school setting. For example, a digital device could be assigned to students for use 24 hours a day and 7 days a week, or the device could be retained in a classroom, only to be used at school. In the past, not all 1:1 laptop implementations featured or implied internet connectivity for the device. Today, however, it is almost widely understood or implied that 1:1 implementations of all devices are intended to provide an internet connection to students (Penuel & SRI, 2006).
In hope of reducing the effects of socioeconomic status and (SES) making public schools more effective (Steinberg, 2010), 1:1 initiatives are springing up all over the world (Linn, 2009) and without conclusive research upon which to ground the action (Penuel & SRI, 2006). To date, a study of the literature reveals that most of these initiatives have been laptop initiatives rather than other digital devices. This research focused on laptop initiatives as opposed to the other products that are now becoming available.
Because this technology has only recently become affordable on a grand scale (Penuel & SRI, 2006), no one knows exactly how 1:1 laptop initiatives will impact the different ethnic and
been relatively few reports of quantitative studies specifically investigating whether 1:1 initiatives reduce or widen the achievement gaps identified in student performance and academic success within the American public school system (USDE, 1983, 2001).
After 9 years of use in some large areas of implementation (Maine and Virginia), it appears the laptop has done little to consistently impact graduation rates or end‐of‐level exams (Abell Foundation, 2008; Penuel & SRI, 2006). From that fact, one could assume the initiatives are having a neutral or an equal effect on all subpopulations of students consistent with the effects of traditional instruction (Hu, 2007). One could conclude that achievement gaps in 1:1 settings reflect trends similar to traditional settings, but it is believed by the researcher that much investigation is yet required before the impact if 1:1 implementation on demographic groups should be concluded.
In many smaller and more localized studies a variety of outcomes have been obtained either supporting or not supporting the laptop’s positive effect on measures of student achievement (Bethel, Bernard, Abrami, & Wade, 2007). The random nature and diversity in findings occurring in these studies on the measures used to define achievement gaps (USDE, 1983, 2001) causes some to make broad and generalized statements about 1:1’s lack of influence on frequently used measures of academic achievement (Banks, 2007; Hu, 2007). Interpretation of this sort is non‐indicative of the variation identified in the many different findings that occur in the localized 1:1 studies (Bethel et al., 2007). Due to the inconsistencies, more information about the differences in implementations is believed to be essential in understanding the total impact of 1:1 introduction (Abell Foundation, 2008; Penuel & SRI, 2006). Possibly, understanding demographic student groups’ responses to 1:1 implementation could be an essential insight for helping schools to equitably make 1:1
transformations and it could help to explain the inconsistencies found from one study in a geographic area to the next (Bethel et al., 2007).
Problem Statement
The differences found in the results of the smaller and localized 1:1 laptop implementation studies would support the idea that relationships between learners, teachers, and laptops are
complex and susceptible to differences existing between individuals, classrooms, and communities (Windschitl & Sahl, 2002). Clearly, the introduction of the laptop in a 1:1 ratio as the primary instructional classroom resource has the potential to impact all aspects of the schooling experience for the student (Warschauer, 2006a).
Due to the many ways a laptop could be used by a teacher (Pitler, Hubbel, Kuhn, &
Malenoski, 2010), which is multiplied again by the many ways the tool could be used by the student (Warschauer, 2006a), there is much that needs to be studied before it can be determined even what the general effects of 1:1 initiatives really are or could be on student achievement (Penuel & SRI, 2006). By adding the laptop to the teaching and learning relationship, teachers and students not only change their medium of communication but also change how they cooperatively learn and think (B. Shelton, personal communication, December 3, 2010).
A deeper understanding of these intricacies could begin or continue by identifying the general effects of a laptop implementation on specific demographic subpopulations of students. Perhaps the differences in the response of students from different demographic subpopulations to 1:1 laptop implementation could explain the diversity and the high rate of variation seen in local studies, while these differences remain inconsistent across all studies (Abell Foundation, 2008; Bethel et al., 2007).
Exploratory comparisons can be made between demographically separated subpopulations of students on a variety of student outcomes. To date, 1:1 implementation has not yet been
investigated quantitatively or thoroughly at this level of focus. From such an introductory
investigation, a second generation of scientifically conclusive studies could arise from the analyzed data (Tukey, 1969). These follow‐up investigations could be used to specifically identify why outcomes do or do not occur and lead to scientifically confirmative conclusions. Statistician and social researcher John Tukey (1969) said this about research for the purpose of exploration:
Both exploratory and confirmatory data analysis deserve our attention. Both detection and adjudication play crucial roles in the progress of science…. To concentrate on confirmation, to the exclusion or submergence of exploration, is an obvious mistake. Where does new knowledge come from? (p. 84)
A foundational and introductory study such as this exploration into the effects of 1:1 implementation on demographic subpopulations of students would be helpful to provide a base for future research and this is why exploratory data analysis or EDA (Tukey, 1969) has been selected as a lens of investigation for this data. EDA will be further described later in this document.
In addition to, and of equal importance, educational administrators are currently in need of immediate and practical information on which to base critical decisions about proposed or pending 1:1 implementations. The professional field of education requires accurate information on this issue (Penuel & SRI, 2006) and this study is intended to help in provide useful information and suggestions to these professionals.
Purpose and Objectives for Research
It is the purpose for this research to initially explore using EDA (Tukey, 1969) whether or not 1:1 laptop implementation could have an influence on achievement gaps between demographic groups and subgroups of students on measured student outcomes. It is believed that this information would be particularly helpful to administrators (Penuel & SRI, 2006) considering 1:1 implementation at schools with high numbers of at‐risk students and whose schools may already be facing challenges with measures of school accountability (USDE, 2001). When examining comprehensive reviews of quantitative literature on 1:1 implementations, very few findings are consistent across all studies (Bethel et al., 2007; Penuel & SRI, 2006). Without acknowledging the inconsistent variations found in localized studies (Bethel et al., 2007), one could conclude that 1:1 implementation was generally having no effect on common measures of student achievement (Banks, 2007; Hu, 2007). Was this the case or did the differences that already exist between demographic subpopulations of students, as evidenced by the achievement and socioeconomic divides, influence different groups to react differently to 1:1 implementation? This study explores this issue.
Research Question Major Research Question
In a public junior high school’s science classes, what were the initial differences in student outcomes which occurred between demographic populations of students when laptops were introduced in a 1:1 laptop implementation?
Additional Questions
To explore the major research question, the following questions were investigated using post hoc analysis of a data set acquired from a control group (no laptops) and a treatment group (assigned laptops) for comparison.
a. How did student grades and credit acquisition vary across differing demographic groups with 1:1 implementation in science classes?
b. How did student scores on common summative assessments vary between demographic
groups when students engaged in a 1:1 curriculum in science classes?
c. What was the difference in attendance and student discipline occurrence related to behaviors associated with feelings of efficacy and motivation between demographic subgroups after 1:1 implementation?
Potential or Expected Outcomes as Described in the Literature
To date, the single most influential predictor for student academic success has been the ethnic SES of the student’s family (Colemen et al., 1966; Lareau, 1987; USDE, 1983, 2001). Since the persistent strength of this predictor in almost all current and historic educational research, some would expect (Warschauer, 2006b) that students who participated in the 1:1 laptop pilot would not perform any differently in comparison to other socioeconomic or ethnic subpopulations than they had previously done without laptops. In this circumstance, the demographic influence of the student’s home (Lareau, 1987) would be too strong for the instructional tool to positively influence the student’s academic outcomes (Warschauer, 2006b). The time the students used the laptop in a
1:1 ratio was only half of a school year. Perhaps this was not enough time for the participating students and teachers to adjust to using the new tool and for more time‐sensitive measures of student achievement to reflect change. This was believed by the researcher to be a sufficient amount of time to study and explore the initial reaction of different student groups to a 1:1 implementation.
Understanding the initial reaction of the student to 1:1 implementation could help
administrators to adjust the structure and design of implementations in the future, but knowing this information would also provide insight into what the long‐term trends for student outcomes may be so schools can better serve students of all demographic backgrounds in the 1:1 setting.
Another potential outcome suggested by some in the media and literature (AALF, 2012; Negroponte, 2010; OLPC, 2010) is students in a 1:1 implementation may show signs of closing the achievement gaps by influencing traditionally low achieving groups (USDE, 1983, 2001; USOE, 2010) to improve on measures at rates higher than traditionally high achieving groups (USDE, 1983, 2001; USOE 2010). In this case, the internet‐capable laptop would act as the equalizer for outcomes (AALF, 2012; Negroponte, 2010; OLPC, 2010) and reduce the differences academically in student grades and course completion rates, and the differences in measures of student motivation and efficacy which are attendance (Coutts, 1998; Gottfried, 2010) and behavior (Lemov, 2010).
Another outcome could occur with 1:1 implementation influencing the differences in measured outcomes to widen (Celano & Neuman, 2010; van Dijk, 2005) between demographic groups where gaps in achievement have previously been found (USDE, 1983, 2001; USOE, 2010). The potential outcome associated with this occurs when the more culturally literate family (Hirsch, 1988), or the family with more access to technological or instructional resources (van Dijk, 2005), may disproportionately help their students to achieve more with a technologically based tool than the family who is less familiar with the medium (Celano & Neuman, 2010; van Dijk, 2005). Possibly, the student without access to these resources or previous experience with the laptop or internet might experience challenges with this resource in the classroom relative to other students (van Dijk, 2005). In these cases, the preexisting digital divide (National Telecommunications and Information Administration [NTIA], 1999) would cause the achievement gap to widen (Celano & Neuman, 2010)
or deepen (van Dijk, 2005) with the introduction of the tool to the school experience.
Description of the 1:1 Implementation and the Study Introduction
Locally, the Davis School District implemented a 1:1 laptop initiative in one junior high school (a pilot) and four additional junior high science classes as preparation for a change to a paperless system of operation. This pilot began in January of 2011 and included 680 selected
students as members of participating classes from a total student population of approximately 1,200. The 1:1 host junior high school provided 420 students with Dell Mini 10 netbook computers across 12 core academic classes (math, English, science, and social studies). Twelve teachers were selected to participate at this junior high school. Each teacher taught one laptop class in their six‐ period teaching day. In each of the four curricular departments, one class was selected from each grade level and grades seven through nine were represented in the study in all four core‐curriculum areas.
All student participants were assigned a laptop in a manner similar to checking out a textbook. All netbooks were made available to students 24 hours a day and 7 days a week. It was left up to the parent and student to decide whether or not the netbook traveled home at the conclusion of school with the student. Docking stations were available in the back of their laptop classrooms if students chose not to take the device home.
Since the device was new to the school, it did take between 2 to 4 weeks (depending on the science class) to complete organizational and managerial requirements before students could begin to take the netbook home, but they were available for classroom use in a 1:1 ratio at the beginning of the second semester, January of 2011. Although no records were kept, it is estimated at least 75 % of all netbooks were taken home at one time or another, but generally half remained in the classrooms and at school each night (B. Hunt, personal communication, December 10, 2011).
The Davis School District’s plan was to use lessons learned from this pilot to help open a new junior high school in August of 2011. This new junior high school was to be a completely 1:1 school.
The new school was to house 1,200 students and provide each of these students with a new laptop. These 1,200 students would join the other 680 students from the 2010‐11 school year and the pilot junior high school in a continuous and growing 1:1 initiative in the Davis School District. It is intended by the school district to refine a method of implementation that can successfully and eventually be repeated in all schools (Lunt, 2011).
In a collaborative effort, the Davis School District has made available a comprehensive project review of their 1:1 pilot online. In addition to meeting agendas, professional development guides, and instructional resources, other practical documents such as student disclosures and student guidelines for computer care can also be accessed. These resources are available at the following web address, but most of the documents will also be included in Appendices B, C, and D of this document. The web address is https://sites.google.com/site/11computingproject (Lunt, 2011).
The Laptop
Beginning February 2010, a 1:1 Executive Committee was formed consisting of public and professional stakeholders within the Davis School District. Their purpose was to investigate products that could be provided to students for use in obtaining information applicable to their education and to enhance the student’s access and communication with the school system and instructional resources (Lunt, 2011). The rationale stated for the school district pursuing the use of a digital learning device was:
In response to increased student and public interest in technology, a need to revitalize classroom instruction, and recent economic pressures, the Davis School District initiated an interdepartmental effort to change the way curriculum and instruction is delivered in schools. (Lunt, 2011, p. 4)
It is believed that the needs of the school district regarding this device could be considered typical and generally applicable to the current needs of other schools and school districts in similar circumstances. The needs identified by this school district for a digital computing device for the 1:1 project were defined in their 1:1 computing project manual as:
a. The device needed to be low in cost.
students in a classroom and home environment. c. The product needed to be highly flexible and portable. d. Software requirements for this product included:
1. The ability to handle the International Digital Publishing Forum or “idpf” file format for eReader and eBook content delivery.
2. Management and multimedia capability that included Microsoft, PowerPoint, Adobe Captivate, and iTunes U.
3. Document requirements also included the ability to view, create, and share PDF documents. (Lunt, 2011, p. 5)
It was determined the Dell Mini 10, a netbook manufactured by Dell Incorporated, best met all the school district’s requirements. This laptop was selected and 680 were purchased for student use beginning January 2011. Teachers participating in the pilot received their personal netbooks in September of 2010 to allow sufficient time to enable and expedite teacher training and teacher familiarity with the device.
Each laptop had a network wireless card that could be connected to any open wireless network. Access to the internet was available to all students in the school until 6:00 p.m. and the city library (one‐half of a mile from the school) until 8:00 p.m. Various businesses in the area also offered free wireless connection and students were generally aware of these locations. It was intended the laptops were to be checked out to the participating students until the end of the school year.
Teacher Development and Expectations
Planning for the 1:1 pilot began in the spring of 2010 with the 1:1 Executive Committee. The first staff development training for the participating junior high school teachers was held on August 13, 2010. Trainings were held monthly and generally lasted an entire school day with the first half of the day designated as instruction and the second half of the day designated for guided
practice. The agendas for all monthly trainings and an “Implementation Overview” that teachers were provided can be found in Appendix C of this document. These documents also can be accessed online at the Davis School District 1:1 site which is: https://sites.google.com/site/
teachers also informally met approximately once a month for a morning bagel and beverage in the faculty room. This time was used to collaborate and support the project through open discussion of problems or concerns the teachers may have been experiencing.
At the beginning of the project, teachers signed the “Project Professional Agreement” which specified what was required of each participating teacher (Lunt, 2011). This document can be found in Appendix B. The following is a summary of the expectations and teacher responsibilities
participating teachers accepted both initially and as assignments from the trainings that occurred throughout the school year.
Provide Dell Mini 10 netbook computers for each student in their classroom.
Use the netbooks daily in class, although they do not need to be in use for the entire 45 minute period.
Provide students with technical assistance and training so students can use the laptop. Actively participate in all training opportunities and meetings.
Find, implement, and share digital curriculum resources to support instruction.
Develop a digital map for the course they are instructing and participate in its revision at year’s end.
Write and implement at least ten lesson plans that can be posted to a school district online collaborative resource bank.
Understand and apply the National Educational Technology Standards (International Society for Technology Education [ISTE], 2000) in curriculum mapping and lesson development.
Find and post at least 30 instructional tools and web resources on a collaborative work site.
Log weekly netbook lessons on a collaborative online blog about successes and failures. Read and discuss the book Rewired:UnderstandingtheiGenerationandtheWayThey
Read and discuss the book UsingTechnologywithClassroomInstructionThatWorks, by Howard Pitler and colleagues (2010).
Show competency in use and management of Windows 7, Internet Explorer 8, and
School Wires.
Create and use a website using School Wires.
Complete and demonstrate understanding of copyright training. Build a lesson plan featuring Google Docs and use it.
Use NetSupport as a digital management tool in the classroom.
Complete online textbook training with McGraw‐Hill and introduce the digital text(s) to students.
Establish a Dropbox account and introduce this to students. Have students turn in assignments using this resource.
Complete training on Fillable Forms. Use the resource with students.
Complete training on Instructional Architect (National Science Foundation [NSF] and Utah State University [USU], 2012) provided by Utah State University. Use the resource with students.
At year’s end all participating teachers successfully upheld the expectations they agreed to in their 1:1 professional agreement and received a compensatory stipend for their work. This stipend helped to provide incentive for the additional work required of the 1:1 teacher who was required to teach one class (laptop class) in their schedule differently than their five other traditional classes.
At the beginning of the pilot, 90% of the teachers surveyed reported to be “excited about participating in this experience” (J. Lunt, personal communication, August 17, 2010). Although minor adjustments were made through the school year, all listed requirements were successfully completed with a high rate of fidelity especially in the science classes that were further selected for additional research and examination in this study. The basic differences from the teacher’s perspective between a 1:1 class and a traditional class was the daily expectation of laptop use along with the expectation
digital resources (i.e., Dropbox, Fillable Forms, or Instructional Architect) would be implemented in their instruction (Lunt, 2011).
Distinguishing Characteristics of Laptop Classes for Participating Students
Students participating in laptop classes (treatment group) were provided with a different class experience than students in traditional classes (control group). Teachers of laptop classes committed to use the laptops each day in a teaching and learning activity and this expectation was met in the semester of implementation.
Although students were free to either take their assigned laptops home each night or leave them in their laptop class, it was required that the student have the laptop in class each day with the battery charged. Due to the novelty of the experience, classes had very few, possibly one or two, problems per month with students not having their netbooks in class with the batteries charged. Student training for the use of the netbook was done in a hands‐on manner with the teacher explaining the process of accessing the digital information as the need arose. Through repeated use, the students’ proficiency increased with the use of the netbook.
Examples of the different types of daily laptop teacher directed activities the students were engaged in during this 1:1 implementation are listed here.
Students were taught how to use OneNote note‐taking software and encouraged to use it at appropriate times during class.
Students both received assignments and turned them in through email or internet shared storage sites such as Dropbox.
Students worked collaboratively and independently to build presentations using PowerPoint.
Students completed Fillable Forms as listening guides.
Students searched the internet and participated in online lessons.
activities.
Students completed writing assignments using the online Utah Write Formative Writing Assessment online software program (Measurement Incorporated, 2010).
Students were instructed in the use of accessing their online subject specific textbooks, practice activities, and summative assessments that were related to the textbook. A variety of activities can be engaged in, but the constant among laptop classes was that the teacher directed some form of instructional student laptop use in class each day.
Even though the teacher directed activities occurred each day, it was anticipated students would engage in uncontrolled and unstructured activities with their laptops (Warschauer 2006a). For example, in the research synthesis conducted by the Abell Foundation (2008), it was reported that in several large (over 1,000 participants) 1:1 laptop implementations, the classroom teachers reported increased classroom management problems with the laptops present. Although some 1:1 implementations reported a decrease in student misbehavior (Texas Center for Educational Research [TCER], 2009), the students were reported by the teachers to be harder to manage in the 1:1
classroom in the studies reviewed (Abell Foundation, 2008).
It is helpful to provide examples of the many activities students could be engaged in as directed by the teacher and to know how different students responded to those lessons, but it is equally important to explore the influence of “unauthorized” responses by students of different demographic backgrounds to the presence of the internet and having their own computing device in the classroom. Placing an internet capable laptop in the hands of each juvenile in a science class makes the experience in the 1:1 setting different from the traditional classroom experience (Warschauer, 2006a). During a personal conversation with one of the teachers participating in the 1:1 pilot, this observation was made.
It used to be that I only had to watch what students were doing with their pencils and paper to know whether or not they were paying attention. It was hard to tell the difference between the writing of a note to a friend or whether they were taking notes on my lecture. Now students that daydream can venture of into the virtual world. They can play games, they can Facebook, and they can even watch movies. Now, when I lecture from the front of the room and I can’t see their screens, they can do just about what they want – including writing a note and sending it by email to their girlfriend. (Teacher at the 1:1 school, personal
communication, May 23, 2011)
This observation summarizes more fully what the full extent of this 1:1 laptop
implementation study investigated. Possibly, students of different demographic groups would react differently in measurable ways to teacher directed classroom activities and also in their own unstructured behavior when the internet capable laptop is present 1:1 in the classroom setting. If there are differences, perhaps they would show up as noticeably different measures of student outcomes.
Introduction to This Study
This study examined student outcomes associated with the initial stages of 1:1 laptop implementation occurring between demographic subpopulations of students on important measures of student outcomes used in school evaluations for NoChildLeftBehind(NCLB; USDE, 2001) and the USOE (2010). These measures are also commonly found in school improvement plans created and approved by local school community councils as evidenced by the many plans publicly accessible for Utah Schools at www.schoollandtrust.org (School Land Trust, 2012). More specifically, this study examined the potential demographic differences in course credit acquisition, term grades, student attendance, and rates of student discipline occurrence when 1:1 implementation took place in a Utah junior high school on these commonly used measures of school success (USDE, 2001; USOE, 2010; School Land Trust, 2012).
In order to make valid and useful observations about the impacts of 1:1 implementation, a manageable set of data was acquired specifically from the Science Department of the pilot junior high school where laptops were introduced on January 17, 2011, at the beginning of the second semester in the Davis School District. The data about these students was analyzed after implementation through post hoc analysis at the end of the 2010‐11 school year.
It is important to establish that this study was exploratory by design and not confirmatory (Gall, Gall, & Borg, 2003) and this does affect the context in which statistical conclusions should be drawn or applied from this set of data. Since the specific responses of demographic student groups to
1:1 implementation has not yet been thoroughly investigated, exploratory data analysis [EDA] (Tukey, 1969) was used as the method of and approach to investigate the primary research question. It was the intention of the researcher to explore important trends in the data, in addition to
answering the primary research question for exploratory purposes. Thus, the research design selected for study was sufficient to answer the question selected for research within the context of exploration in which it was asked.
Discussions in the analysis were also based on obtained outcomes as they relate to one another and the discussion was not limited to only those measures that were of statistically significant difference (statistical significance referring to alpha levels and not the importance of a finding). For example, an additional comparison was made that examined whether or not the number of laptop classes scheduled in a student’s school day influenced a measurable change in outcomes in their science class. When the pilot was established, classes other than the control or treatment classrooms selected for this study were also 1:1 classes. It was important to control for this in the findings for the science classes. This additional analysis helped to insure that more accurate statements were made about findings in the data. This additional comparison will be further explained later in this document. The EDA research design selected for this study provided
opportunity to make additional comparisons when needed and methodologically the design provided freedom to deviate from more traditional methods and a strict adherence to statistical models (Tukey, 1969).
It was important to remember at the inception of this study that any differences found between the experimental and control groups should not be attributed to the laptop computer alone. It was the purpose of this research to explore the laptop’s interaction with the student’s demographic status as reflected by quantifiable measures of student outcomes associated with academic
achievement. This was essentially an investigation of the student’s overall reaction to the
introduction of the device. To investigate, three different methods of analysis were used to identify different reactions by different demographic groups. Means were compared using charts and graphs, effect sizes were calculated and compared between groups measuring the magnitude of mean
difference, and statistical tests of mean difference were conducted using an appropriate and general model of statistical analysis for the set of data obtained. It was proposed that the laptop as a tool could either be used by the instructor to improve teaching or by the student to improve learning and this was investigated using change scores for the measured student outcomes.
Just as any tool in a hardware store has the potential to speed up a task or help to complete it more effectively and efficiently (Bolman & Deal, 2008), it is hoped by some (AALF, 2012; Negroponte, 2010; OLPC, 2010) that the laptop will equitably do the same for all demographic groups in the learning and teaching relationship. As better tools change how tasks are completed, the introduction of the new tools also change the philosophical consideration of the work itself (Bolman & Deal, 2008). The intent of this study was to explore the effects of the laptop as a tool used to improve measures of student achievement.
Delimitations of the Research
In answering the primary research question, there were initially many threats to the internal validity of the statements and observations that could be drawn from this study. First, there were, as there always are, contaminating elements unrelated to the laptop implementation that did occur during the school year and that did influence some subpopulations or measures of student outcomes during the laptop pilot (treatment). Methods used for controlling against these elements will later be discussed as needed in association with the outcome measures they influenced, but largely the use of change scores were used to mitigate the influence of external contaminants.
This was a post hoc examination of the 1:1 implementation which had already taken place and it was not an experiment. Therefore, many variables could not be experimentally accounted for. This means that findings from analysis based on the three methods of investigation used (mean comparison, effect size measures, and pvalues) must be interpreted somewhat cautiously and all three methods of analysis should be used together in interpretation for practical and accurate statements to be made about the findings. Due to the relatively loose conditions that established and divided treatment and control groups, scientific conclusions about the impact of 1:1 on different
demographic groups should not be made.
Also, a relatively small number of participants were included as subjects and that increased the chances of error in the findings for the statistical analysis and especially for the treatment and control, and demographic subgroup pairwise comparisons with much smaller nsizes. In addition to small nsizes, the number of pairwise comparisons used leads to an increased chance of error in conclusions because of the multiple comparisons made. Again, it is the intent for this research and the conclusions drawn to be exploratory in nature (Tukey, 1969) and proliferate what is known about this phenomenon rather than reduce or make confirmation of the hypothesis (Stake, 1978). For this reason, the nsizes used in comparison and the multiple comparisons made were unadjusted for due to the exploratory nature (Gall et al., 2003; Tukey, 1969) and purposes for this study.
In addition, caution is to be taken by the researcher and the reader not to overstate the importance of statistically significant (based on alpha levels) findings from the statistical analysis when the mean differences are not of practical importance. Since this is a post hoc examination of a data set, a tendency could exist to “dredge the data” (Experiment‐Resources.com, 2012) and build a model of statistical analysis which identifies significant pvalues that should not be categorized as such. To control for this, a simple, full factorial (Fisher, 1926), and easily comparable (uniform across the different measures) model of analysis was selected for statistical analysis and this will be
interpreted along with mean difference and effect size measures (Cohen, 1988) so that the most accurate and applicable statements can be made based on the findings.
There was no way to insure all teachers would use the laptop in identical ways in their classrooms. Although the teacher development and professional expectations within the project were standard, teachers still had significant academic freedom to personalize their own classroom
implementation. Some teachers were going to be better at teaching with laptops than other teachers. It was also impossible to insure training provided for laptop classes would not influence or change teacher behavior in their traditional nonlaptop classes (control setting). Setting up a control and treatment group for each teacher was intended to control for teacher differences that could have occurred in the outcomes.
In this study, change scores were used to measure the difference between demographic groups of students. Using change scores allowed for school activities unrelated to 1:1 implementation that could influence measured outcomes to effect both treatment and control groups. There is an assumption made in the design, because of random sampling or placement of students in control classes, the students of different demographic groups started the second semester at relatively comparable levels of measured student outcomes. It is assumed the potential for change in the laptop (treatment) group is comparable to the potential for change in the nonlaptop (control) group. Due to the fact this was an exploratory study, the assumption of relatively equal starting points and that both groups would be affected comparably by unrelated school activities was not accounted for in the statistical analysis. Adjustment in the selection of control and treatment groups and in the interpretations made about the study should take these into consideration.
Another limitation in this study occurred because of the structure created in the school district pilot. This structure was that one class from each of the core content areas (math, science, English, and social studies) on each grade level participated in the pilot with a total of 12 teachers. This meant the science students participating in this study came from three different science classes spanning three grade levels and three curriculums. Although this created variation in the classroom setting and grading, the question for research focused on the demographic responses of students as a group (mean). Therefore, it was still possible to compare the demographic responses between demographic groups even though this happened across different scientific subject matter and different grade levels. This also needed to be accounted for in summaries and conclusions.
As was previously stated, some students included in both the treatment and control groups were also assigned to an additional laptop class (math, English, or social studies). Participating in an additional laptop class could potentially influence student outcomes in the science class. For
example, if a control group student had increased access to their own personal internet capable laptop at home and during the school day due to the pilot, perhaps their grade in science would go up from the increased access to information and electronic resources. Conversely, this same student may spend more time at home pursuing entertainment on the internet and spend less time studying
causing their science grade to go down. In order to control for this circumstance, a separate statistical analysis defined by specifying the number of laptop classes assigned to an individual student was included in comparison and analysis.
Not only does this additional comparison help to control against the making of inaccurate inferences about 1:1’s effect on student outcome measures, but it also provides an opportunity to explore another important issue associated with 1:1 implementation. Possibly, students would perform better or worse with increased exposure to the laptop and this could be investigated relatively easily within the scope of this study. Even though this line of questioning is not directly related to the primary research question, it potentially could be related to the different responses of students in the 1:1 implementation. Investigating potentially important clues or data that present themselves within a study is well within the purview of EDA where it is even encouraged (Tukey, 1969).
It was believed students in both the control and treatment settings might react in unpredictable ways with the general introduction of the laptops into the school environment. For example, both treatment and control groups were subject to the Hawthorne Effect whereby, with increased supervision and attention to the 1:1 initiative and the newness of the digital tool, measured student behavior might change because of inclusion in the study and not because of the laptop and this would affect the statements made about the demographic comparisons (Hawthorne effect, 2008).
To some degree, it was anticipated the potential contaminants would also eventually
become part of the entire experience that was being studied. They did. Teachers will assess student learning differently and they will not be consistent with one another, as a collegial group, in grading student performance. Student assessments and their teacher’s evaluation from one teacher to the next are subjective and might vary. This fact must be conceded and then accounted for, in research design, methods of analysis, and interpretation. The primary comparison used to answer the research question will be student comparisons by demographic groups.
conclusions drawn from this data to be more trustworthy and sound.
Context of This Study
Due to the fact 1:1 implementation’s initial effects on different subpopulations of students were the only outcomes available for measurement, it was inappropriate at the study’s end to draw firm conclusions about the long‐lasting effects of ubiquitous computing on preexisting achievement gaps. The research design used in this study was not intended to generate conclusive findings, but was intended to explore relationship between demographic groups and 1:1 implementation (Gall et al., 2003; Tukey, 1969). The findings of this study will help others to understand the demographic responses of students to implementation. This study will also provide foundational information and questions upon which more conclusive experimental design can be based. It is through the repetition of findings that scientific conclusions are to be drawn (Tukey, 1969) and this was intended to be an introductory and exploratory investigation.
Equally as important as identifying the right answers to the research question will be the opportunity to ask the right questions concerning what should be studied next. As has been stated before, Exploratory Data Analysis, or EDA, is a method for identifying the right questions for future research, as well as it is a method used to answer basic but important questions (Tukey, 1969).
Given the size and longevity of the differences in academic performance evidenced in the achievement gaps across the nation (Coleman et al., 1966; USDE, 1983, 2001) and at this 1:1 pilot host school (USOE, 2010), the 5 months of treatment with a laptop was considered by the researcher to be an unrealistic amount of time needed to significantly reverse demographically repressive effects and allow positive change to manifest itself in the academic outcomes measured. Five months was also believed not long enough for the study habits of students to significantly change and their academic performance to noticeably improve. That said, 5 months was ample time for initial
differences in student reactions to be measured and to be identified, if they were to happen simply by introducing the laptop to the school environment.
students were, future implementations or transitions can be more successful in making the same type of transition to paperless systems of instruction or to 1:1 implementation. In addition, another statistical point of reference was established to which future 1:1 launches can be compared. As has been stated, this study helped to define more specific questions to be addressed by additional confirmatory measures in the coming years of implementation.
The acquired data may be used as a beginning or as a foundation for similar analysis to be repeated in the future on a more longitudinal basis. The methods used in analysis can be repeated and improved over time and will do more to answer questions about the overall effect of 1:1
implementation on achievement gaps in long‐term studies and analyses. It is most certainly intended that other studies outside of this geographic area may use this data and design to continue to
CHAPTER 2 LITERATURE REVIEW
Global 1:1 Implementations
Some consider the next influential global educational reform movement to be 1:1 initiatives (AALF, 2012; Apple Classrooms of Tomorrow, 2008; Negroponte, 2010; OLPC, 2010). Rapid
technological advancement, coupled with the ease and speed of accessing information through electronic databases (Penuel & SRI, 2006), has enhanced interest in using digital mediums for purposes of educational reform (AALF, 2012; Negroponte, 2010; OLPC, 2010). Some believe that 1:1 laptop initiatives coupled with internet access to educational materials could be a viable solution to the achievement gaps currently existing in worldwide education systems (AALF, 2012; Linn, 2009; Negroponte, 2010; OLPC, 2010).
To investigate, this researcher found theoretical information about the philosophy surrounding 1:1 global laptop initiatives at the OLPC (2010) and the AALF (2012) websites. For example, in 2010 the Uruguayan government purchased 380,000 OLPC XO laptop computers for every primary public school student and teacher in their country. The OLPC XO computer was designed at the Massachusetts Institute of Technology by Nicholas Negroponte (OLPC, 2010). The initiative is called Plan Ceibal and it was considered the most aggressive 1:1 implementation in the world at the time (Linn, 2009). Although Plan Ceibal is still a new idea and the findings about the implementation have not thoroughly been published, it has been stated that the entire system of public education in Uruguay is changing and adapting to the use of this new instructional tool in “progressive ways” (Brechner, 2010) even though these “ways” have not yet clearly been reported.
Even though Uruguay was the first country to implement a 1:1 laptop initiative, significant XO computer initiatives are also beginning in Peru, the Middle East, across Africa, and on islands in the South Pacific and Caribbean (OLPC, 2010). In October of 2010, Venezuela signed a deal with Intel that will bring one million “Classmate” machines into their country for every student ages 6 to 10 years old (BBC News, 2010). As evidenced by the number and size of these implementations,
motivation to adopt 1:1 systems is a worldwide movement.
Even now, global 1:1 transformation continues and Negroponte (2010) was most recently in the news when he sent an open letter to the Indian Government published on the front page of the
TimesofIndia pledging his free and complete support to helping them develop a $35 internet capable laptop or tablet. In the letter Negroponte said, “Education is the primary solution to eliminating poverty, saving the environment and creating world peace. Access to a connected laptop or tablet is the fastest way to enable universal learning” (Negroponte, 2010).
1:1 Initiatives in America
In addition to these foreign countries, our own country is playing host to 1:1 initiatives. The first system‐wide (meaning states or large school districts) 1:1 implementations in America began in 2001 at the same time the NCLB goal “to improve academic achievement through the use of
technology in elementary and secondary schools” (USDE, 2001) was passed into law. Perhaps the most famous of these early implementations began when the state of Maine passed the Maine Learning Technology Initiative [MLTI], which allocated funding for the purchase of over 17,000 Apple iBook laptop computers for all of its seventh grade students (Maine Public Laws, 2001). Also that same year, Henrico County, Virginia purchased around 23,000 Apple iBooks (Lappas, 2011) for their school district (Henrico County Public Schools, 2012).
Even though conclusive evidence about the laptop’s effect on student learning is still being generated (Bethel et al., 2007; Penuel & SRI, 2006) and laptop implementations are still more expensive than traditional instruction (B. Hunt, personal communication, 2011) largely because of the indirect costs associated with implementation (Hu, 2007; O’Donovan, 2009; Penuel & SRI, 2006), new initiatives are beginning all the time (Bebell & O’Dwyer, 2010; Penuel & SRI, 2006; Steinberg, 2010). This researcher found helpful information about the 1:1 initiative movement in America in the articles: “Implementation and Effects of One‐to‐One Computing Initiatives” (Penuel & SRI, 2006); “Educational Outcomes and Research from 1:1 Computer Settings” (Bebell & O’Dwyer, 2010); “One‐ to‐One Computing in Public Schools: Lesson from ‘Laptops for All’ Programs” (Abell Foundation,
2008) and “More Students Need Laptops for the Classroom” (Steinberg, 2010).
Additionally, a simple Google search revealed 1:1 initiatives of various scales and sizes can now be found in schools and school districts all over the country. The number of students
participating in 1:1 initiatives is increasing annually at an amazing rate (Abell Foundation, 2008; Bebel & O’Dwyer, 2010; Penuel & SRI, 2006). As has been previously stated, local, initiatives have begun in Utah and specifically in the Davis School District (Lunt, 2011).
Internet Capable Laptop as a Tool to Establish Social Equity
Some proponents of laptops in education, like Negroponte (2010), believe the internet‐ capable laptop will have an equalizing effect on economically or socially challenged students by making access to information equitable (AALF, 2012; Negroponte, 2010; OLPC, 2010). Since the philosophical beginnings of the public education system in America, many have looked to this institution to provide equal access to the opportunity and pursuits of happiness guaranteed by the United States Constitution (Dewey, 1916; Hirsch, 1988). Inequity exists i