PAPER NO. 13
z
NOVEMBER 2007
Published by Education Policy and Research Division Office for Education Policy and Innovation
Department of Education and Early Childhood Development Melbourne
November 2007
© Copyright State of Victoria 2007
The copyright in this document is owned by the State of Victoria or in the case of some materials, by third parties (third party materials). No part may be reproduced by any process except in accordance with the provisions of the Copyright Act 1968, NEALS (see below) or with permission.
An educational institution situated in Australia which is not conducted for profit, or a body responsible for administering such an institution, may copy and communicate the materials, other than third party materials, for the educational purposes of the institution.
Authorised by the Department of Educationand Early Childhood Development, 2 Treasury Place, East Melbourne, Victoria 3002
ISBN: 978-0-7594-0477-9
Also published on
http://www.education.vic.gov.au/studentlearning/research/researchpublications.htm
Authors David Downes
Oanh Vindurampulle (Education Policy and Research Division) Acknowledgements
Sara Glover and Simon Blyth (Data and Evaluation Division) For more information contact:
Sandra Mahar Research Manager
Foreword
In recent years there has been an increase in the quality of performance-related data available to schools to inform school improvement. Yet there remains scope for more refined and intelligent measures that will better indicate how schools are progressing in improving the learning outcomes of students.
Value-added approaches aim to provide a clearer indication of the contribution a school makes to the progress of its students by adjusting for the impact of non-school influences on student performance. There is a wide range of approaches to value-added
measurement, reflecting differing views on the intention of the measures, how they should be used and which student characteristics should be adjusted for.
Consideration of a value-added approach in Victoria requires active engagement with the education stakeholders who would be interpreting and using the resulting measures. This paper provides an overview of value-added approaches to inform what will be an ongoing consultation with stakeholders and other experts on the most appropriate uses of value-added measures and how these measures should be developed and presented.
I trust that this report assists your understanding of this complex subject. I look forward to future discussion within the education community on an approach that will better inform our schools of student progress, leading to improved learning outcomes for Victorian students.
Dr Dahle Suggett
Deputy Secretary
Office for Education Policy and Innovation
Contents
Executive summary
1
1.
Introduction 2
What is ‘value-added’? 2
Defining ‘value-added’ 3
Why use value-added measures? 4
2.
Use of value-added models nationally and internationally
6
United Kingdom 6
United States 8
Australia 9
3.
A value-added approach for Victoria
1
2
1 1 1
1
The context in Victoria 2
Stakeholder perspectives on ‘value-added’ 3
Considerations for developing a value-added model 4
4.
Conclusion 17
Appendix: Considerations in planning for a value-added approach
8
References 20
Executive summary
This report provides an overview of value-added approaches as a measure of school effectiveness. The report investigates value-added models applicable to education systems and explores how a value-added model might be developed and used in Victoria.
Value-added approaches seek to quantify the ‘value’ of gains in educational attainment by recognising that students have different levels of capability and come from different environments. The approach can lead to a more meaningful insight into how students are progressing and what influence their school is having on their progress. The ability to identify effective schools will inform school improvement and ultimately raise the learning outcomes of students.
Value-added measures have been used as a tool for school improvement as well as
informing policy development and parents. While value-added information is a powerful tool for analysing school performance, it is a relative measure. A value-added approach is only effective when seen in combination with other factors such as raw scores, teacher
assessments of student progress, school self-evaluation, reviewers’ judgements and the profile of the school.
There are several different models that can be used to calculate a value-added measure. Each model has a set of assumptions that need to be made explicit to reflect the intention of the measure. Many educationalists are supportive of the principles underlying value-added approaches and several jurisdictions have adopted these approaches to provide a more refined measure of a school’s contribution to the attainment of their students. The approaches taken in value-added models are determined by the data available and the intended use of the value-added measures. Consultations with Victorian education
stakeholders to inform the development of a value-added approach in Victoria emphasise that it is inappropriate to use value-added measures as a basis for league table style school rankings. In adopting a value-added approach, it is important to consider its primary intentions, how they should be presented and used and which factors should be included. The credibility of a Victorian value-added model will ultimately rest upon its intelligibility and useability.
1. Introduction
Since the seminal work of Coleman, Campbell, Hobson, McPartland, Mood, Weinfeld and York (1966) claiming that schools exert little influence on student learning, a voluminous body of research into school effectiveness has emerged seeking to identify the influence of schools and teachers upon student attainment (Thomas 2001). The primary focus of research into school effectiveness to date has been on key characteristics associated with schools that perform better than comparable schools, irrespective of the background of their student intakes. According to Hill (1995), these raw scores do not provide an accurate indication of the contribution of different schools. Meaningful assessment of school
effectiveness relies on a measure of achievement that has been adjusted to take account of the social composition of the student groups attending the schools. The need to consider external influences when making assessments of school performance has also been explicitly recognised in an Organisation for Education Co-operation and Development (OECD) international study on the quality in schooling, which defined an ‘effective’ school as ‘one that promotes the progress of its students in a broad range of intellectual, social and emotional outcomes, taking into account socio-economic status, family background and prior learning’ (cited in Wyatt 1996).
Value-added measures have emerged internationally as a means of assessing school performance. The value-added approach recognises that students have different levels of capability and come from different environments, and that these factors will influence a student’s rate of educational progress. As Sanders (2000) describes it, if education is seen not as stair steps but as a ramp – upon which students in the same grade will be at different points – school effectiveness can influence the speed at which students progress up that ‘ramp’. Value-added approaches seek to gain a clearer impression of a student’s progress by comparing their level of attainment to other students of similar ability and background. By adjusting student scores for external or ‘non-school’ influences, value-added measures aim to give a more accurate indication of the influence a school has had upon their students - in short, the value-added contribution at the school.
While many educationalists may be supportive of the principles underlying value-added approaches, there is less agreement on what exactly is meant by ‘value-added’. There is also less agreement about the way in which value-added measures should be used and what the most appropriate method of calculating ‘value-added’ is.
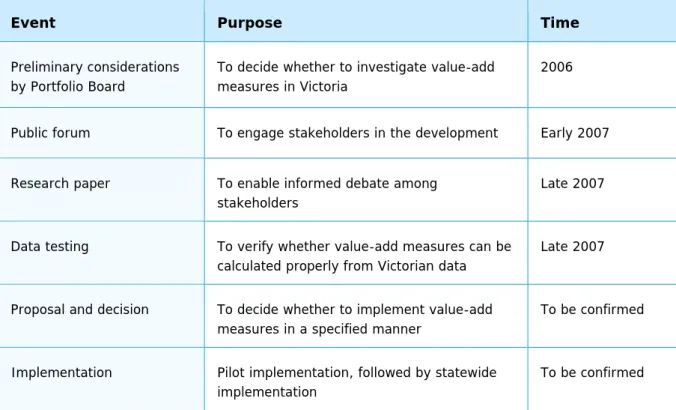
The aim of this report is to provide an overview of value-added approaches as a measure of school effectiveness. This report is one element of a larger process of considering, defining, testing and possibly implementing value-added measures in Victoria, as illustrated in table 1. The report investigates value-added models applicable to education systems and
explores how a value-added model might be developed and used in Victoria. The ability to identify effective schools will inform school improvement and ultimately raise the learning outcomes of Victorian students.
What is ‘value-added’?
While not using the term ‘value-added’, researchers since the late 1960s had been adjusting school outcomes for differences in school populations, with the intention of re-ranking them to illustrate ‘school effects’. The early use of the term ‘value-added’ as a measure of school effectiveness has been traced to Bryk and Weisberg (1976), who described ‘value-added’ as a more sophisticated analysis of school effectiveness than was available from raw performance measures (Schagen & Hutchison 2003).
Table 1: Value-added project milestones
Event Purpose Time
Preliminary considerations by Portfolio Board
To decide whether to investigate value-add measures in Victoria
2006
Public forum To engage stakeholders in the development Early 2007
Research paper To enable informed debate among
stakeholders
Late 2007
Data testing To verify whether value-add measures can be
calculated properly from Victorian data
Late 2007
Proposal and decision To decide whether to implement value-add measures in a specified manner
To be confirmed
Implementation Pilot implementation, followed by statewide
implementation
To be confirmed
From the 1980s an international trend towards accountability measures in schools saw the introduction of standardised performance measures against which schools were assessed. Whether intended or not, this often resulted in the rank ordering of schools in forms such as league tables. The United Kingdom was at the forefront of this trend. From 1988, schools were required to publish examination results, with school performance tables being
introduced in 1992 to inform parents on their choice of school and to encourage schools to raise their standards (Ray 2006). These school performance measures were widely
criticised for failing to recognise how differences in school intakes can impact upon school performance. They were thought to be more a reflection of the prior attainment of student intakes than the effectiveness of individual schools.
Research seeking to identify the influence of external factors on the effectiveness of individual schools emerged from the late 1980s (see, for example, Nuttall, Goldstein, Prosser & Rasbach 1989; McPherson 1992). In adjusting for external influences researchers developed more complex ‘multilevel’ models. These incorporated the hierarchical structure of the school system, acknowledging that students were nested within classes, classes within schools and schools within districts (OECD 2006).
Defining ‘value-added’
The term ‘value-added’ is derived from economics, where it is often used to describe the additional value a business generates or contributes to a product or service. In education it has most commonly been used to describe the additional value schools bring to the learning outcomes of their students – in other words, the contribution a school makes to the
learning of students. ‘Value-added’ has also been used more broadly to encapsulate all contributions schools make to student development.
A broad definition of ‘value-added’ is:
Value-added measures are those that attempt to indicate the educational value that the school adds over and above that which could be predicted given the backgrounds and prior attainments of the students within the school (Hill 1995).
Value-added measures seek to quantify the ‘value’ of gains in educational attainment, usually by comparing student test results in one year with those in a subsequent year or years. They provide summary longitudinal measures, at the school level, of ‘learning gains’ which have occurred as groups of students have moved from one year level to another. These summary measures are adjusted to cancel out non-school influences such as a student’s prior level of attainment and background.
Value-add measures retain the subject scope of the test data on which they are based. For example, a value-add measure which is based upon Year 9 reading results relative to Year 7 reading results for the same students (two years previously) is a measure of learning gain in that school for reading outcomes between Years 7 and 9. It measures the
effectiveness of the school in teaching reading to students between the Year 7 test and the Year 9 test; it does not provide a measure of the effectiveness of the school as a whole.
Why use value-added measures?
The introduction of value-added measures is often surrounded by debate concerning
whether they should be used primarily for school accountability or as a tool to inform school improvement, and whether the measures should be provided confidentially to schools or publicly released. There are also very different methodologies employed in value-added models, ranging from reasonably simple to the highly complex. Saunders (1999) doubts a consensus is possible since the term itself contains an evaluative function, so that ‘its meaning and therefore its definition (as well as its application and associated methods of measurement) depend on the purpose for which it is to be deployed in a given context’. Hence, interpretations of the term vary according to the purpose of value-added measures and the models used. A number of possible uses of value-added measurement include: 1. A tool for school improvement
Value-added measures take student characteristics into consideration and can therefore help indicate to schools how their students are performing against expectations based on the achievement of comparable students. Schartz, VonSecker and Alban (2005) argue that, as value-added analyses are not exact and reflect the combination of environment and teaching practice, schools are best placed to interpret what the results might mean in the school and class contexts.
As a guide to school improvement, value-added measures can indicate in which areas and with which students schools are performing well or performing below expectations. This can assist in directing effort and resources to improve the learning outcomes of their students. Value-added analysis has been used to inform the professional development of teachers, where class profiles are used to identify areas in which students require further skill development and this has in turn informed teacher development plans. A value-added approach also has potential to indicate where teachers are more effective with students. For example, a value-added analysis could identify those teachers who are more effective in raising the performance of disadvantaged students (Drury & Doran 2003).
Value-added information is a tool for analysing school performance. It is a relative measure in that it compares the impact of a school relative to other schools. It is only effective when seen in combination with other factors such as raw scores, teacher assessments of student progress, school self-evaluation, reviewers’ judgements and the profile of the school (Department for Education and Skills 2007).
2. A tool for accountability
While school performance indicators are an accepted part of school accountability, the limitations of value-added measures give caution to their use as a basis for determining overall school performance. Goldstein and Thomas (1995), observing the difficulty in gaining a precise indication of how well a school is performing, argue that ‘research into school effectiveness is a useful activity in our attempts to obtain knowledge about a process of education, but a very poor tool for holding schools to account’. The more recent OECD (2006) report on added approaches arrived at a similar conclusion: that a value-added model ‘could best be introduced as a tool to enhance school improvement efforts rather than as a basis for regulatory oversight’.
McDougall (2004), a Victorian primary school principal, argues for a two-phase accountability system that measures different kinds of progress:
The first is an absolute measure providing an assessment of progress against standards and meeting those standards. The second is a value-added measure
providing a fair assessment of those who do the best job of getting there. Value-added measures of assessment focus on student improvement not absolute scores and provide teachers with a raft of invaluable data with which to moderate their teaching practice.
3. Informing policy-making
Value-added measures can also be used to provide information on the effectiveness of policy initiatives. Value-added measures yield indicators for school effectiveness. These indicators can be most useful for education authorities in identifying those schools with significantly above average value-added performance and those with clearly below average performance (OECD 2006). High-performing schools can provide examples of best practice which others may emulate, while remedial efforts can be directed towards schools who are struggling in terms of their students’ learning gains. As the OECD (2006) report argues: ‘When resources are limited, as they always are, this type of triage can be very useful’. Value-added measures can also assist policy-makers to more closely align policies, resources and teaching strategies with the needs of individual schools (Drury & Doran 2003) or help select schools for particular initiatives.
4. Reporting to parents and community
A value-added measure could provide parents with a more accurate impression of how well a school is improving the learning outcomes of its students. By acknowledging the
performance of schools in the context of a student’s capabilities and their community environment, value-added measures could provide parents with information on the achievements of teachers in raising the achievement levels of their students, especially teachers in disadvantaged areas.
On the other hand, there are concerns that value-added measures could be interpreted as being more definitive than the data informing them makes possible. Reservations regarding the publication of value-added results often relate to their potential to be assembled into school league tables. Ranking schools in terms of measures subject to variation can provide a highly arbitrary and misleading impression of relative performance. Fitz-Gibbon (1997a) observed in the United Kingdom that while school results were not published by the Government in rank order, there was a tendency for the media to rank schools without acknowledging the size and importance of differences between schools. She suggests that presenting a wide range of indicators would better convey in which areas a school is more effective or less effective, as well as being less subject to use for rank ordering.
2. Use of value-added models nationally
and internationally
Value-added approaches have been adopted in several countries and jurisdictions to provide a more refined measure of a school’s contribution to the attainment of their
students (OECD 2006). As Saunders (1999) concludes, there is ‘considerable agreement in principle about why the value-added approach was found necessary in the first place’ but ‘a great deal less consensus on what information of the kind that might be called “value-added” would most help teachers in improving, and parents in choosing, a school and what it consequently means in terms of methodology’.
With a widening acceptance of value-added approaches there have been advances in developing specific measurement models. Robert Lissitz (2005) describes the development of ‘value-added’ as being in its ‘adolescence’, conveying both its stage of growth and the contentiousness around the concept. He observes a growing complexity as models improve in their generality and usefulness, and as expectations increase of what they can provide.
United Kingdom
The policy watershed in the United Kingdom came in 1994 with the release of the School Curriculum and Assessment Authority report Value-added performance indicators for schools (Saunders 1999). The report argued that a value-added model needed to be as simple, straightforward and accurate as possible, and so – contrary to the prevailing view among academics that a ‘multilevel’ model was superior – advocated a less complex model (Wyatt 1996). A study was then undertaken into the feasibility of a national value-added system. It argued that value-added information should be mainly used internally by schools to inform school improvements, rather than be made publicly available (unless voluntarily disclosed by schools) (Fitz-Gibbon 1997b).
In 2002 a simple value-added approach was introduced in England. To take into account students’ prior achievement, their results were adjusted according to their performance relative to students with similar scores in national tests. These adjusted scores were then aggregated for their school and standardised onto a scale where ‘100’ was the mean. School value-added results were published in school performance tables alongside the unadjusted attainment results. An example of how the value-added scores were used to indicate a school’s performance relative to other schools is illustrated in table 2.
Rowley (2006) argues that this measure did not really indicate ‘added value’ as it did not track and report the progress of the same students, but rather compared one cohort of students with another. As the estimated attainment was calculated on the results of students who had previously been through the system, the measure could not therefore account for any effect changes to the curriculum might have upon students (Griffin et al. 2005). Gorard (2006) found, from a re-analysis of the 2004 results, that the outcomes of the value-added score for schools were so similar to what the rankings would have been based on students’ prior achievement that it was questionable whether the approach measured a school’s value-added effect.
In 2003 the National Audit Office recommended that other contextual factors be included in addition to prior attainment, culminating in the adoption of a ‘contextualised valued-added’ model. The contextualised valued-added model is multilevel in that it can account for both a student’s prior achievement and a range of background factors. The model also takes into account that students are grouped into schools and adjusts for those schools with smaller populations which might otherwise produce quite extreme value-added scores.
Table 2: The ranking of value-added scores
Value-added score Percentile ranking102.1 and over Top 5% of schools nationally
100.9-102.0 Next 20% of schools nationally
100.3-100.8 Next 15% of schools nationally
99.8-100.2 Middle 20% of schools nationally
99.3-99.7 Next 15% of schools nationally
98.0-99.2 Next 20% of schools nationally
97.9 and below Lowest 5% of schools nationally
Source: Griffin, Woods & Nguyen (2005)
From 2006, schools were assigned value-added scores on a similar basis as before, except that the model included students’ prior attainment, gender, age, ethnic group, first
language, level of deprivation and that of their local area; whether they have special education needs, have been in care, or have recently joined their school (‘student mobility’); and a rating from the Income Deprivation Affecting Children Index (IDACI). The ‘value-added’ model measures are used in four main ways (Ray 2006).
1. Inclusion in school performance tables
Value-added results for some but not all of the key indicators are reported in school performance tables, with the contextualised value-added measures included in secondary school performance tables from 2006. New school profiles have also been developed to provide parents with an additional source of information on individual schools. These include value-added measures in performance tables.
2. Data to inform school improvement and inspections
In 2006 a new software system, RAISEonline, was introduced to schools to provide much more detailed value-added data than that available in the publicly released performance tables. Value-added information is given in relation to a wider range of outcome measures and for sub-groups of pupils within a school. Schools can use this data to compare
performance against national patterns as well as against high-performing schools. Schools will use this information as part of their self-evaluation and target-setting. The data is also used by school inspectors to assess school improvement.
3. Selection of schools for initiatives
Schools which are identified as high-performing from the value-added measures can be given additional responsibility in assisting weaker local schools. Schools can also be
identified for their potential to participate in initiatives like the Specialist Schools project or can be targeted for additional support available through national programs.
4. Monitoring policy initiatives
The value-added results are used for monitoring progress in groups of schools in relation to specific policies or administrative arrangements. Researchers also use the data to construct models to indicate the progress of students in certain types of schools, though as Ray (2006) notes, there are limitations in using this data to determine the impact of a particular policy.
United States
In the United States, a national standard of student attainment was set under the No Child Left Behind Act 2002. Schools are assessed against this standard based on their students’ standings at the end of the year, in what are termed ‘current status indicators’. The current status indicators compare students’ grade-level test scores to those of students in the same grade level from previous years, providing a ‘snapshot’ of the performance of a group of students at a single point in time (Drury & Doran 2003). This approach does not take into consideration the effect of prior knowledge or background.
Value-added measures for school and teacher effectiveness have been introduced in states and districts such as Tennessee, North Carolina, South Carolina, Ohio, Pennsylvania, Arkansas, Minnesota and Dallas (Texas) (Hershberg, Adams Simon & Lea-Kruger 2004; OECD 2006). McCaffrey, Lockwood, Koretz, Louis and Hamilton (2004) note that value-added approaches have not been more widely adopted in part because they require extensive computing resources and high-quality longitudinal data which many states and districts do not have.
Tennessee and Dallas use the results of value-added measures only to inform school and teacher improvement and not as an accountability mechanism related to rewards or sanctions (OECD 2006). Griffin et al. (2005) observe that states using value-added analyses still have technical difficulties in measuring progress and meeting accountability requirements. They note the conclusion of contributors to a special issue of the Journal of Educational and Behavioural Statistics (Raudenbush 2004; Rubin, Stuart & Zanutto 2004) that, given these technical difficulties, it is difficult to defend value-added models as accountability measures at present.
The most commonly cited of the US value-added models is the Tennessee Value-added Assessment System (TVAAS). The TVAAS is designed to measure the impact of schools and individual teachers on student achievement. It draws upon annual student test results in mathematics, science, reading, language and social studies from Year 3 to Year 8 (Sanders & Horn 1998). These results can be aggregated at the teacher, school and district levels. Using data on student progress in each year, the TVAAS identifies each student’s ‘normal gain’ and reports student progress in terms of percentages of this normal gain (Rowley 2006). The approach takes account of student prior achievement but does not separately adjust for other non-school influences. Sanders (2000), an architect of the model, argues that high-achieving students can come from any environment and that therefore
adjustments should not be made for socio-economic and ethnic background unless there is compelling evidence that these are influential. He considers that factoring in a student’s prior achievement takes account of other background influences upon their subsequent achievement.
The approach taken in the TVAAS is not without its critics. As the model is proprietary and undisclosed, there has been no independent review of its underlying methodology. The claims by the developers that analysing students’ previous test scores alone can control for all other external influences upon attainment have also been disputed as lacking evidence (Griffin et al. 2005). Bracey (2002) reports concerns about the reliability of the model, given its unstable assessments of teacher quality and very different assessments of the effectiveness of the same teachers in different years.
The results of the TVAAS are used for school and teacher improvement, with teachers being provided a (non-public) report card on the progress of their students (Griffin et al. 2005). Its measures have been credited with assisting schools in identifying areas for
improvement. Hershberg et al. (2004) illustrate how a middle school was able to identify that its lowest achieving students in mathematics were performing below expectations according to a statewide benchmark. Being able to then identify characteristics shared by these students, the school was able to respond to those factors within its influence, in this case raising money for student school supplies and creating an additional class to help these students complete their homework in a supportive environment. These students subsequently achieved value-added gains over 3.5 times that of the national norm.
There are signs that the US Department of Education is beginning to recognise the potential benefit of value-added analyses. In 2005 it invited states to submit proposals for inclusion of data on student gains in their reports to the federal government, and it is anticipated that this requirement will be incorporated into federal regulations in 2007 (Olson & Hoff 2005, cited in OECD 2006).
Australia
In Australia, by the mid-1990s specific learning outcome statements were reflected in government publications like the Victorian Curriculum and Standards Framework, which mapped out student progress across all school years in key learning areas (Rowe 2000). Statewide assessment and monitoring programs were also introduced in response to public demands for greater school accountability in maintaining and improving standards (Hill 1995).
Hill (1995) describes the approach to school assessment as the ‘Achilles heel’ of education policy:
Teachers and education policy-makers have been divided over appropriate ways to report to parents and the wider public on the outcomes of schooling, to the
bemusement and frustration of the general community who have become increasingly suspicious and intolerant of the lack of comparable and credible evidence regarding educational effectiveness.
The common concerns identified with assessment programs were that:
information from large testing programs typically related to only a small part of the curriculum and to a small proportion of students within schools, which raises questions about its validity as an indicator of educational standards and its relevance to classroom teaching
publication of results tended to be in aggregated form at a system level, whereas teaching and learning take place at the classroom and school level
results available at the class and school level were presented as ‘gross’ achievement levels, which do not take into account the background and prior attainment of students, thus limiting their usefulness in judging teaching programs (Hill 1995).In Victoria a value-added measure was applied to selected primary schools in the early 1990s for the Victorian Quality Schools Project. This project adjusted results from 51 schools for prior achievement and the socio-economic level of each student. Hill (1995)
observed from these findings that schools were by no means equally effective across
curriculum areas; and value-added measures raised questions as to which characteristics of an intake should be considered and what adjustments should be made to gross
achievement measures.
In December 1996 the then Victorian Board of Studies introduced an Achievement
Improvement Index which used student results from the General Achievement Test (GAT) to adjust for student ability. The results were published in newspapers, a move criticised by schools conscious they could be presented in a league table form and have a negative impact on student motivation (Rowley 2006). Rowley observes that school’s rankings based on the Achievement Improvement Index’s adjusted scores did not differ greatly from those of either the mean study score or mean GAT total, suggesting it was not effectively
identifying the value-added effect of schools. The publication of the Achievement Improvement Index was discontinued in 2002.
In 2002 the Victorian Curriculum Assessment Authority (VCAA) introduced the Victorian Certificate of Education (VCE) Data Service, which provides confidential value-added information to schools to inform school improvement. Value-added measures are confined to data from a particular school and relate to each study or class group. While the GAT forms the basis for predicted achievement, the VCE Data Service also takes account of student gender and the average ability of students undertaking that area of study in the school.
The VCAA also provides schools with confidential Achievement Improvement Monitor (AIM) reports on student achievement in Years 3, 5, 7, and 9. These reports take into account the impact of gender and, indirectly, student background through ‘like-school groups’. The AIM School Matched Group Comparison Report indicates the progress of students across
assessment periods, which could be seen as a basic form of ‘value-added’, although there is no measure of what students might have been expected to achieve. The approach also requires the visual matching of data to students, which is time consuming. Not all data are able to be matched, so the report may present an incomplete picture that could potentially be misleading.
The Australian Council for Educational Research (ACER) also provides a data interpretation service to schools on a fee-for-service basis. This comprises a value-added analysis of school data with a report to assist staff in interpreting the findings.
In Queensland, the Corporate Data Warehouse (CDW) is a repository of education
performance data that provides the basis for planning, reporting and improvement in the Queensland government education system.
In use since 1998, the CDW is an extensive and sophisticated data bank that ensures that all parts of the Department are provided with the same sets of up-to-date data that can then be cut and utilised in an enormous range of ways according to the needs of the particular user.
The aim of the CDW is to provide all users across the system with the power of analysis which they can then use alongside their contextual knowledge to enhance performance. Teachers can look at their students’ performance; principals can assess whole school and like performing school data; district, regional and central staff can examine data for particular cohorts or areas.
Its strengths were shown to be that it was:
a single source of all relevant data
wide-ranging
trusted
widely used by a variety of clients 10 Value-added measures for school improvement
able to present reports in accessible, transparent formats
able to be utilised in different ways by different users to meet their exact needs
able to match student data from year to year using the student’s identifier
able to be effectively used to support funding bids.The Department of Education, Training and the Arts in Queensland is interested in the value-add concept and saw the CDW as an integral tool for any further work in the area (Department of Education 2007).
In New South Wales, the commitment to improved educational outcomes for students has resulted in a focus on building a culture of high expectations based on a clear framework for school development and enhanced accountability coupled with targeted support. Schools effectively used value added data for strategic monitoring for school improvement
(Department of Education and Training 2007).
3. A value-added approach for Victoria
The context in Victoria
The Blueprint for Government Schools, now in its fourth year of implementation, seeks to improve learning outcomes for all students. This includes closing the gap between those students who are achieving satisfactory or better outcomes and those who are not progressing as well. The Blueprint has introduced several initiatives to strengthen the capacity of schools for self-improvement, notably a new Accountability and Improvement Framework and the Targeted School Improvement initiative.
The new Accountability and Improvement Framework enables schools to evaluate their current practice and inform improvement strategies. The Framework supports schools on their improvement journey by enabling them to:
plan for improvement via a four-year school strategic plan and an annual implementation plan
evaluate progress towards the improvement goals and targets via an internal school self-evaluation and an external school review
report on progress in core school performance indicators and other achievements via an annual report to the school community
manage risk and compliance with legislation and departmental policies via an on-line school compliance checklist (currently being piloted).These elements are not discrete and independent tasks but rather, in keeping with the intent and principles of good governance, are part of a coherent planning and reporting process for organising school improvement efforts. Moreover, there are strong linkages between school planning and principal performance and development planning.
In addition, the Targeted School Improvement initiative supports schools with student outcomes below expected levels to develop and resource improvement strategies. In recent years, a more flexible approach to school accountability and improvement has encouraged schools to identify and target areas in which further improvement can be made. The improvement agenda has been supported by data that informs assessments of student and school progress such that Victoria now has a comprehensive performance data system that includes student outcome data, opinion data and a range of demographic data. This data system provides schools with a broad range of ‘snapshot’ measures of the
performance of their students, as well as some longitudinal measures which track the performance trajectory of particular students (or groups of students) over time.
Furthermore, there has been an associated effort to improve the quality of student data with the redevelopment of the VCAA database currently underway and the impending introduction of the Victorian Academic Number (VAN), which will provide students with a unique identifier. These developments will extend the range of performance data which is available to schools by enabling further development of longitudinal measures of student performance. Value-added measures offer a school-level summary of longitudinal student performance, enabling comparisons between schools of the development (over time) for the groups of students in each school, given the student characteristics which the school cannot alter (e.g. their prior attainment and their socio-economic status). These developments provide an opportunity to reconsider the way in which student performance related information is interpreted and used to make informed judgements about the most appropriate actions to take to further school improvement (Fraser & Petch 2007). 12 Value-added measures for school improvement
Stakeholder perspectives on ‘value-added’
Consultations conducted with schools by the Department of Education and Early Childhood Development for the development of the Blueprint revealed considerable dissatisfaction with school performance measures based on student attainment in the General
Achievement Test. There was a view that schools were not all on a ‘level playing field’ as students in different schools vary in backgrounds and levels of prior knowledge and skills. Comparing a school’s performance to the state average or even a like-school average was seen as insufficient to account for these differences. It was argued that more sophisticated measures were needed that would better reflect the contribution made by schools to the learning gains of their students.
In March 2007 the Department convened a forum of education stakeholders as a first step in exploring how value-added measures might be developed and used. The forum
considered the strengths and limitations of value-added approaches, considerations around implementation, and areas requiring further investigation. It was attended by teachers and administrators from primary and secondary schools as well as representatives from the Association of Independent Schools of Victoria, the Catholic Education Office, the Victorian Curriculum and Assessment Authority, the Victorian Qualifications Authority and the Department of Education and Early Childhood Development.
A general consensus emerged at the forum that a value-added approach could support accountability and improvement at the school, regional and system level. Identifying the agreed purpose and intended audience for value-added measures was seen as an essential first step in any further work.
Value-added measures were thought to be consistent with the commitment of schools to continuous improvement, as well as being fairer to schools. They were considered to be more effective in identifying genuine underperformance, rather than just poor performance. They could potentially boost the morale of staff in lower-performing schools by recognising their accomplishment in increasing the ‘learning gains’ of their students. In those schools where student results are high but should be higher given their students’ backgrounds and prior achievement levels, a value-added approach would draw attention to areas requiring improvement. They would also encourage better performing schools to improve further. From the perspective of schools, a value-added approach was seen as being able to provide schools with more in-depth information with which they could:
analyse in-school differences
identify, investigate and act on areas of strength and weakness
support claims for extra or changed funding
support in-school staff appraisal processes.Used in conjunction with other relevant information, a ‘value-added’ approach could also assist the Department of Education and Early Childhood Development to:
better recognise and share good performance
analyse more deeply ‘what works’
target and act on poorer performance
ensure resources are targeted where they are most needed
better inform future policy directions
provide a clear, statewide picture of the effectiveness of the system overall.Opinion among participants was divided as to whether value-added measures should be used to inform parent choice. Many participants were concerned that, if publicly released,
value-added information could be misunderstood or misinterpreted. Others considered that value-added measures could be of use to parents in informing or confirming their choice of school. There was much closer agreement that value-added measures should not be used for the purpose of generating league tables.
On the whole, it was agreed that consideration of a value-added approach requires clarity as to its principal purpose and the intended audience or audiences. The three main
audiences for school performance-related measures are schools, education authorities and parents, each of which would have different uses for value-added measures.
Considerations for developing a value-added model
For a value-added approach to work effectively it must provide sufficiently credible
indicators of student progress and the influence of schools upon this progress. As has been highlighted in the previous discussion, there can be quite different views on the purpose of value-added measures and which methodology provides the most accurate or useful indication of ‘value-added’.
The following section explores some of the key considerations in developing a value-added model for Victoria. The recent OECD (2006) report on value-added measures also provides a useful list of questions for consideration when developing and implementing a value-added approach. The list can be found in the Appendix.
Managing complexity
To put it at an extreme, the value-added task began by appearing to promise better information for public consumption, but instead turned out to demonstrate that ‘better information’ and ‘public consumption’ are incompatible, if the latter depends on being able to access ‘simple and straightforward’ measures of progress (Saunders 1999).
There is a tension between the aims of developing as accurate a form of measurement as possible and producing a measurement outcome that is readily understood by schools and other audiences. Yet as researchers have sought to provide more useful measures of student progress, value-added models have become more complex and less straightforward (Saunders 1999; Lissitz 2005). Saunders (1999) emphasises that the credibility of value-added measures of effectiveness depends upon the judgements and assumptions behind the models being well conveyed to intended audiences.
Rowley (2006) in his analysis of value-added approaches in the Victorian context argues for a multilevel model, which is a more complex approach that can show the relative impact at each level of hierarchy from student, to class, to school, to region. He argues that a more simplistic approach that does not take account of clustering and its influences would be subject to statistical bias.
The drawback of more complex approaches is that they can be difficult to explain to layperson audiences. Feedback from participants at the Victorian forum emphasised the importance of providing clear information to stakeholders about the limitations, as well as the strengths of any value-added data; and the need to clearly set the data in the context of other indicators of school effectiveness. As with any measurement model, there remains a risk that a public audience could ignore any caveats with which results are reported. Sanders (2000) argues in defence of the Tennessee model that provided the concept behind the model is simple then its complexity can be relatively easily understood by users. Drury and Doran (2003), who also favour models that are more statistically complex and rigorous, point to measures such as the Consumer Price Index which people can interpret without understanding the complexity behind it.
Drury and Doran (2003) argue further that as the effectiveness of a value-added measurement model ultimately relies on the capacity of schools to use the information
emerging from it, the implementation of a new value-added system should include training for all stakeholders in data-driven decision-making. The OECD (2006) report similarly observes that the implementation of a value-added approach requires both training in schools and a public information campaign.
Level of analysis
Value-added measures can potentially be analysed and reported at the individual, class, school or regional levels, depending on the data available and intended purpose (Rowley 2006). If, for instance, value-added measures are intended to indicate how particular aspects of the school system are functioning (e.g. teaching and learning of literacy between Year 3 and Year 5), analysis is likely to be at the school or school region level and
specifically in that subject area.
If the measures are intended primarily for use by schools to assess how their students are progressing and their teachers performing, detailed breakdowns by class and student are likely to be more useful (though also subject to greater variability and questionable reliability).
Darmawan and Keeves (2006) in a value-added analysis of students in Canberra observed significant differences at the class level, leading them to conclude: ‘in examining value-added across schools, the class level cannot be ignored’. Drury and Doran (2003) consider that indicators which fail to capture student performance at the class level will be less useful in assessing teacher effectiveness or the impact of curriculum changes.
Adjustment for external influences
Prior achievement is the strongest predictor of a student’s future attainment. Fitz-Gibbon (1997a) reports that knowing prior achievement can enable the prediction of 50 per cent of the variation in later achievement. This is much stronger than say home background, which she considers will only predict around nine per cent of the variation. For this reason, she argues, prior achievement is the critical information that must be used to group ‘similar’ students. Gray, Jesson and Sime (1990) found in their analysis of several value-added studies a correlation between examination results and finely differentiated prior attainment of about 0.7, compared to 0.35 for a student's social background.
In developing the English contextualised value-added model the intent was to keep the model as simple and intelligible as possible. Ray (2006) explains that ‘in looking at the range of possible explanatory variables, some significant ones were not included if it was felt that they would add complexity without greatly enhancing the quality of the model’. The decision on which variables to include was also pragmatically determined by what national data were available. Variables used in the contextualised value-added model include prior attainment, gender, age, ethnic group, first language, and level of deprivation. There is debate concerning the inclusion of factors other than prior achievement in value-added models. Sanders (2000), for example, argues that prior attainment already acknowledges socio-economic influences. Including socio-economic factors and ethnic background in value-added analyses has also been opposed on the grounds that it may lower expectations for disadvantaged students (Sanders 2000; Tekwe, Carter, Ma et al. 2004). Drury and Doran (2003) respond that value-added approaches do not preclude the setting of high achievement standards and that schools in disadvantaged areas will more commonly have higher value-added achievement goals, given that their students generally start from a lower level of performance.
As suggested by participants at the Victorian value-added forum, careful trialling is required that uses historical data to test out the implications of a number of models or variants.
Data availability
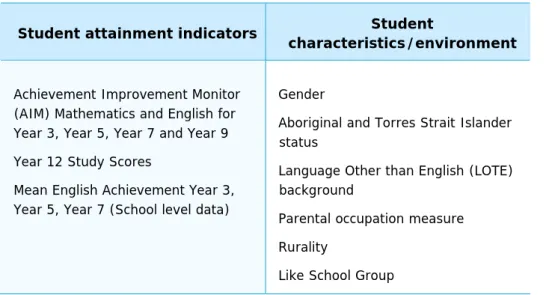
Rowley (2006) identifies the following types of assessment data currently available in Victoria that could inform a value-added analysis (table 3). For the purposes of this summary, these are presented in the categories of student attainment indicators and student characteristics/environment.
Table 3: Assessment data currently available
Student attainment indicators Student
characteristics/environment Achievement Improvement Monitor
(AIM) Mathematics and English for Year 3, Year 5, Year 7 and Year 9 Year 12 Study Scores
Mean English Achievement Year 3, Year 5, Year 7 (School level data)
Gender
Aboriginal and Torres Strait Islander status
Language Other than English (LOTE) background
Parental occupation measure Rurality
Like School Group
Rowley considers that sufficient data are currently available, although there is a need to better link this data for use in a value-added approach.
The current redevelopment of the VCAA database will allow for the linking of VCE results to AIM English and Mathematics scores from Years 3, 5, 7 and 9. The impending introduction of two further data sources will also enhance the capacity to identify student characteristics that might be integrated into a value-added approach. The Victorian Academic Number, scheduled for implementation in 2008, will provide all students up to age 24 with a unique identifier. With the Victorian Academic Number, visual matching of AIM student data will no longer be required. In combination with the redeveloped VCAA database, students could be tracked from Year 9 through to Year 12, enabling Year 9 achievement data to be used to calculate Year 12 residual scores. Student Family Occupation (SFO) data is planned for implementation from 2008, which could inform a ‘net progress’ based value-added model (Rowley 2006).
Statistical assumptions behind models require further exploration concerning issues such as the effects of sample sizes and how to deal with missing data (Lissitz 2005). Ways of accounting for the effects of student mobility between schools is another factor that needs to be considered in the development of a value-added model (Drury & Doran 2003).
4. Conclusion
Advocates of value-added approaches argue that they give a more accurate impression of student and school progress and therefore provide more effective measures to inform school improvement. Value-added measures can indicate in which areas and with which students schools are performing above or below expectations. This type of information can assist schools in directing their effort and resources and can inform teachers’ professional development. Value-added analyses can also identify high-performing schools whose practices other schools may then emulate, while remedial efforts can be directed towards those schools making less progress in their students’ learning gains.
While some jurisdictions have embraced value-added measures, their development is still at a comparatively early stage. The approaches taken in value-added models are very much determined by the data available and the intended use of the value-added measures – whether this be for school improvement or, more contentiously, as a measure for school accountability. Value-added information is a powerful tool for analysing school performance, but it is a relative measure. It is only effective when seen in combination with other factors such as raw scores, teacher assessments of student progress, school self-evaluation, reviewers’ judgements and the profile of the school.
Researchers in the field of value-added measures and Victorian education stakeholders consulted to date both emphasise that it is inappropriate to use value-added measures as a basis for league table style school rankings. Given the inherent variability within value-added measures there is a view that they are not sufficiently well-refined to be used as an authoritative accountability measure or as a basis for other ‘high stakes’ decisions. Value-added measures are just one among a number of potential indicators of how effectively a school is performing.
The adoption of a value-added model in Victoria would be evolutionary, requiring both well-considered and informed development, careful implementation and ongoing adjustment. Clearly, there are several issues to be considered in consultation with education
stakeholders. Foremost among these are the primary intentions of value-added measures and how they should be presented and used. Another aspect is which factors should be included in a value-added model, a judgement which is important because it will influence the outcomes of a value-added measurement. There are also challenges in conveying what might be a fairly sophisticated analysis in an understandable way.
The effectiveness of a value-added model will be assessed on how well its measures assist schools in identifying the progress of their students and areas requiring improvement. Its credibility will ultimately rest upon its intelligibility and useability as a guide to bringing about ongoing improvement in Victorian schools.
Appendix: Considerations in planning for a
value-added approach
The OECD in its recent background paper, The Use of Value-added Models for School Accountability (2006), outlined the following considerations in planning for value-added approach.
1. What are the policy objectives of introducing value-added models? If the objective is school accountability, then policy-makers should be clear on how school
accountability will articulate with other components of accountability system (present or contemplated) and how it will contribute to policy goals.
Will the primary focus be on directly informing school improvement efforts or on developing regulatory mechanisms?
Since accountability should be broadly defined, what are the different indicators that will comprise the school profile?
Will school accountability be coupled with teacher and/or district-level accountability?
What are the consequences of implementing some form of school accountability? Are there resources to support schools designated as needing improvement? If accountability is to result in rewards and sanctions, how will they be determined? 2. Review the advantages and disadvantages of different indicators. There are anumber of relevant school indicators that can be developed.
Process indicators can usually be compiled from administrative records but they do not address directly the goal of education quality. However, they can inform the evaluation of the efficiency and equity goals.
Some outcome indicators, such as failure rates or graduation rates, can also be obtained from administrative records. Other outcome indicators, such as those drawing on current test scores, can usually be obtained easily though there may be a substantial lag between test administration and test reporting.
Indicators based on longitudinal test records generally require greater infrastructure and, consequently, are more expensive to derive.
Indicators that require external visits are also expensive but can yieldinformation that is otherwise not available. At the same time, questions of reliability and validity can arise.
3. The role of value-added analyses
Value-added analysis yields (normative) indicators of school effectiveness. Such indicators are most useful in identifying schools that may be exemplary (i.e. significantly above average) or problematic (i.e. significantly below average). When resources are limited, as they always are, this type of triage can be very useful.
Currently, school inspections are often conducted on systematic random samples of schools. Such a scheme ensures that all schools are observed over a fixedperiod of time. Suppose, instead, that it is desired to identify and support the bottom decile of schools with respect to some measure of effectiveness. Then it is probably sufficient to collect auxiliary data and to conduct in-depth interviews with those schools that fall in the bottom quintile in a value-added analysis. 4. Setting standards
It may be desirable to set standards for school effects that trigger certain kinds of interventions. An example was given just above. Other interventions may involve observations focused on schools linked to large, positive estimates of value-added effects with a view to identifying common school-level strategies associated with exemplary student gains.
More commonly, though, standards are set as part of a regulatory program that categorises schools for official purposes. Standards can be set solely on the basis of policy considerations, on the basis of historical results, or a combination of the two. However they are determined, the consequences will depend on the degree of coherence of the standards with stated policy, the adequacy of the preparation and training, as well as perceptions of fairness.5. Infrastructure
Implementation of value-added measures requires substantial infrastructure. The infrastructure requirements include having an annual testing system in place, provision for centrally collecting student data, being able to track students through their school careers, the analytic capacity to analyse the data, and mechanisms for developing and disseminating useful reports.
Although not strictly part of infrastructure, training of central office staff, school personnel (principals, teachers), as well as a public information campaign, are all essential to the long-term success of the effort.References
Bracey, GW 2002, ‘Value added, value lost?’, Rethinking Schools, vol. 15, no. 1. Bryk, AS & Weisberg, HI 1976, ‘Value-added analysis: A dynamic approach to the
estimation of treatment effects’, Journal of Educational Statistics, vol. 1.
Coleman, JS, Campbell, E, Hobson, E, McPartland, J, Mood, A, Weinfield, F & York, R 1966, Equality of educational opportunity, National Center for Educational Statistics,
Washington DC.
Darmawan, IGN & Keeves, JP 2006, ‘Accountability of teachers and schools: a value-added approach’, International Education Journal, vol. 7, no. 2.
Department of Education 2007, ‘Value-added Forum: 30 March 2007’ Forum report prepared for the Department of Education, Melbourne.
Department of Education 2007, ‘Victorian Budget 2007/08: Summary Statistics for Victorian Schools’, Department of Education, Melbourne, viewed 22 October 2007,
<http://www.education.vic.gov.au/about/publications/budget/budget2007.htm>.
Department for Education and Skills 2007, Making Good Progress: How we can help every pupil to make good progress at school?, DfES, United Kingdom, viewed 22 October 2007, <http://www.ncer.org/docs/making-good-progress.pdf>
Department of Education and Training 2007, Annual Report 2006, DET, Sydney, viewed 22 October 2007, <https://www.det.nsw.edu.au/reports_stats/annual_reports/index.htm> Drury, D & Doran, H 2003, ‘The value of value-added analysis’, National School Boards
Association Policy Research Brief, vol. 3, no. 1.
Fitz-Gibbon, CT 1997a, ‘From value-added indicators to evidence-based education: the task for the next decade’, Incorporated Association of Registered Teachers of Victoria
Seminar Series, July, 65.
Fitz-Gibbon, CT 1997b, Feasibility Studies for a National System of Value-added Indicators, School Curriculum and Assessment Authority, London.
Fraser, D & Petch, J 2007, School improvement: A theory of action, Department of Education, Melbourne.
Goldstein, H, Rasbash, J, Yang, M, Woodhouse, G, Pan, K, Nuttall, D & Thomas, S 1993, ‘A multilevel analysis of school examination results’, Oxford Review of Education, vol 19, no. 4, pp. 425-433.
Goldstein, H & Thomas, S 1995, ‘School Effectiveness and ‘Value-added’ Analysis’, Forum, vol 37, no. 2.
Gorard, S 2006, ‘Value-added is of little value’, Journal of Educational Policy, vol. 21, no. 2. Gray, J, Jesson, D & Sime, N 1990, ‘Estimating differences in the examination performances
of secondary schools in six LEAs: A multi-level approach to school effectiveness’, Oxford Review of Education, vol. 16, no. 2.
Griffin, P, Woods, K & Nguyen, T 2005, An environmental scan of tools and strategies that measure progress in school reform, report to the Department of Education, Melbourne. Hershberg, T, Adams Simon, V, & Lea-Kruger, B 2004, ‘The revelations of value-added’,
The School Administrator, December.
Hill, PW 1995. ‘Value-added measures of achievement’, Incorporated Association of Registered Teachers of Victoria Seminar Series, May, 44.
Lissitz, R 2005, Value-added models in education: theory and applications, JAM Press, Minnesota.
McCaffrey, DF, Lockwood, JR, Koretz, D, Louis, TA, & Hamilton, L 2004, ‘Models for value-added modelling of teacher effects’, Journal of Educational and Behavioural Statistics, vol 29, no. 1.
McDougall, K 2004, ‘Real assessment issues for our schools: creating a positive school culture’, Teacher Learning Network, 3.
McPherson, A 1992, ‘Measuring added value in schools’, National Commission on Education Briefing, 1.
Nuttall, D, Goldstein, H Prosser R & Rasbach, J 1989, ‘Differential school effectiveness’, International Journal of Educational Research, 13.
OECD 2006, The use of value-added models for school accountability, OECD Background Paper, 14.
Raudenbush, SW 2004, ‘What are value-added models estimating and what does this imply for statistical practice?’, Journal of Educational and Behavioural Statistics, vol. 29, no. 1.
Ray, A 2006, ‘School value-added measures in England’, Paper for the OECD Project on the Development of Value-Added Models in Education Systems, Department for Education and Skills, UK.
Rowe, KJ 2000, ‘Assessment, league tables and school effectiveness: consider the issues and “Let’s get real!”’, Journal of Educational Enquiry, vol. 1, no. 1.
Rowley, G 2006, Value-added measures in education and training, report to the Department of Education, Melbourne.
Rubin, D, Stuart, E, & Zanutto, E 2004, ‘A potential outcomes view of value-added
assessment in education’, Journal of Educational and Behavioural Statistics, vol. 29, no. 1.
Sanders, WL & Horn, SP 1998, ‘Research findings from the Tennessee Value-Added Assessment System (TVAAS) database: implications for educational evaluation and research’, Journal of Personnel Evaluation in Education, vol. 12, no. 3.
Sanders, WL 2000, ‘Value-added assessment from student achievement data: opportunities and hurdles’, Journal of Personnel Evaluation in Education, vol. 14, no. 4.
Saunders, L 1999, ‘A brief history of educational “value-added”: how did we get to where we are?’, School Effectiveness and School Improvement, vol 10, no. 2.
Schagen, I & Hutchison, D 2003, ‘Adding value in educational research – the marriage of
data and analytical power’, British Educational Research Journal, vol. 29, no. 5.
Schartz, CJ, VonSecker, CE & Alban, TR 2005, ‘Balancing accountability and improvement: introducing value-added models to a large school system’, in Value-added models in education: theory and applications, JAM Press, Minnesota.
Tekwe, C, Carter, R, Ma, C, Algina, J, Lucas, M, Roth, J, Ariet, M, Fisher, T, & Resnick, M 2004, ‘An empirical comparison of statistical models for value-added assessment of school performance’, Journal of Educational and Behavioural Statistics, vol 29, no. 1. Thomas, S 2001, ‘Dimensions of secondary school effectiveness: comparative analyses
across regions’, School Effectiveness and School Improvement, vol. 12, no. 3. Wyatt, T 1996, ‘School effectiveness research: dead end, damp squib or smouldering
fuse?’, Issues in Educational Research, vol. 6, no. 1, viewed 22 October 2007,
<http://www.iier.org.au/iier6/wyatt.html>.