Market
Assessment
and
Analysis:
Learner’s
Notes
This document presents the “Learner’s Notes” that accompany a distance learning course on Market Assessment and Analysis. The course illustrates how markets operate and how they relate to and affect food security and vulnerable households. It describes market components and how they function and introduces some of the methods and indicators used to assess markets for improving food security analysis. Patricia Bonnard, the Senior Market and Trade Advisor for FEWS NET, developed this course for FAO. It is one component of a larger module on Food Security Information for Action.
The larger module includes the following courses:
‐ Food Security Information Systems and Networks ‐ Reporting Food Security Information
‐ Availability Assessment and Analysis ‐ Baseline Food Security Assessments ‐ Food Security Concepts and Frameworks ‐ Collaboration and Advocacy Techniques ‐ Livelihoods Assessment and Analysis ‐ Markets Assessment and Analysis
‐ Nutritional Status Assessment and Analysis
‐ Food Security Policies ‐ Formulation and Implementation ‐ Targeting
‐ Vulnerability Assessment and Analysis
FAO Distance Learning courses offer self‐paced e‐learning, developed by international experts to support capacity building and on‐the‐job Training and Workshops at national and local food security information systems and networks. The Market Assessment and Analysis course available on the internet at http://www.foodsec.org/DL/dlcourselist_en.asp takes approximately 2 hours to complete. It is also available free on CD‐ROM.
Food Security Information for Action
Markets Assessment and Analysis
Lesson 1
Markets and Food Security
Learners’ Notes
© FAO, 2008
This course is funded by the European Union and implemented by the Food and Agriculture Organization
Course – Markets Assessment and Analysis Lesson 1 – Markets and Food Security
Learners’ Notes 1
Table of contents
Learning objectives ...2
Introduction...3
What are markets? ...4
Supply and demand ...7
The market system...10
Market networks ...12
Changes in supply and demands...13
Summary ...15
If you want to learn more...16
Annex 1: Example of national supply (Food Balance Sheet)...18
Annex 2: Illustration of Supply and Demand Change ...19
Course – Markets Assessment and Analysis Lesson 1 – Markets and Food Security
Learning objectives
At the end of this lesson, you will be able to:
• understand basic market concepts and definitions relevant to food security analysis; and
• understand the basic principles of how markets function and how they are important for food security analysis.
Course – Markets Assessment and Analysis Lesson 1 – Markets and Food Security
Learners’ Notes 3
Introduction
Markets are a part of everyone’s lives.
Even in rural areas most people, and especially the poor, rely on markets to provide food, essential goods and services. Markets also provide access to paid work and mechanisms for selling produce.
Course – Markets Assessment and Analysis Lesson 1 – Markets and Food Security
What are markets?
Markets are where buyers and sellers come together to trade. They are social arrangements that allow buyers and sellers to obtain information and exchange
commodities.
A commodity is something tangible, that has value and can be exchanged. Commodities
can include food and cash crops, livestock, non-food consumer items and even labor. A market can be organized as a physical market place where products are exchanged (e.g. cereals and household items sold in supermarkets, kiosks, market stalls, etc.).
They can also be organized as stock markets, auctions or as informal arrangements, such as barter, between two people.
For the purpose of this lesson we will refer to traditional physical markets trading in commodities.
Markets make an important contribution to three (availability, access and stability) of the four pillars of food security:
• Availability
− Producers are able to purchase inputs for producing food.
− Countries can trade with each other to make sure enough food is available. • Access
− Households sell their products (e.g. crops, livestock, non-agricultural commodities) and their labor in the market and earn income.
− The price of food in the market determines whether a household’s income or resources are sufficient to obtain an adequate quantity and quality of food. • Stability
− The movement of food through markets from one location to another, from surplus to deficit areas and across borders, usually helps to ensure stable food supplies over time and space.
How market information and analysis contributes to food security analysis
Market information and analysis contributes to food security analysis by: • deepening the understanding and analysis of food security; • adding a dynamic aspect to food security analysis;
• linking households to local, national, regional and global economies; • yielding more precise estimates of needs;
• improving scenario development and monitoring;
• clarifying appropriate type, magnitude and timing of response; and
• shedding light on the constraints to food security caused by market irregularities and inefficiencies.
Course – Markets Assessment and Analysis Lesson 1 – Markets and Food Security
Learners’ Notes 5
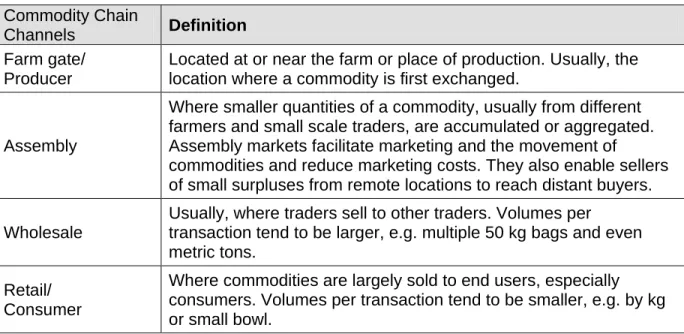
Each commodity follows a flow, starting with the primary producer and moving up to the final consumer (commodity chain).
A commodity chain includes all levels of the market and actors that have a role in the distribution and transformation of the commodity.
Table 1: Commodity Chain Channels
Commodity Chain
Channels Definition
Farm gate/ Producer
Located at or near the farm or place of production. Usually, the location where a commodity is first exchanged.
Assembly
Where smaller quantities of a commodity, usually from different farmers and small scale traders, are accumulated or aggregated. Assembly markets facilitate marketing and the movement of
commodities and reduce marketing costs. They also enable sellers of small surpluses from remote locations to reach distant buyers. Wholesale
Usually, where traders sell to other traders. Volumes per
transaction tend to be larger, e.g. multiple 50 kg bags and even metric tons.
Retail/ Consumer
Where commodities are largely sold to end users, especially consumers. Volumes per transaction tend to be smaller, e.g. by kg or small bowl.
These different commodity chain channels tend to be sequential.
Commodities usually flow from one level to the next, starting with the farm gate, where a commodity is first sold, and ending at the retail or consumer market where the final product is purchased by a consumer.
While we tend to talk about the types of market as though they were completely separate things and located in different places, wholesale and retail marketing can occur in the same place. Even in one large market place, there will often be different areas where wholesale and retail activities take place.
Example: Multiple types of markets
The following map of Haiti shows the distribution of different types of markets. Note that in some places there are multiple types of markets.
Course – Markets Assessment and Analysis Lesson 1 – Markets and Food Security
We usually look at the market for one commodity at a time, for example, the market for maize, the market for cattle or the market for labor.
However, it is important to consider how the market for one commodity influences the market for another commodity.
Examples
The following are some examples of how commodity markets are interrelated:
• When the price of millet rises, the demand for sorghum as a substitute for millet rises.
• When there is less maize available in the market, households can reduce their purchases of maize and eat more cassava.
• When coffee prices fall, the demand for casual farm labor on coffee farms decreases.
• When taxes or import duties on rice are reduced or ocean and inland freight costs fall, the price of rice falls.
Course – Markets Assessment and Analysis Lesson 1 – Markets and Food Security
Learners’ Notes 7
Supply and demand
Markets are driven by supply and demand.
MARKET SUPPLY
Market supply is the amount of a commodity being offered in the market. It can come from: • local production;
• private or public stocks;
• regional or international trade; and • food aid.
Suppliers include traders, agricultural producers, shops, government, humanitarian organizations, etc. – whoever is selling on the market.
Traders can sell commodities that are produced locally (within the country) or they can bring in commodities from across the border through official (legal and formal) trade, or unofficial (illegal and informal) trade.
Please note that market supply and total national supply are not equal. Production that is consumed on the farm is part of the national supply, but is not part of the market supply.
National and local supply
National food supply (generally including cereals but sometimes significant root crops) is called “food availability”.
The term supply can also refer to the provincial or district supply or even regional (West Africa) supply. If you are interested in food security in a certain district of a country, you would be most interested in the supply of food within the district. But you would need to also know about food supplies in other markets and areas that are closely linked to, and influence, the local district level markets.
See Annex 1: Example of national supply (Food Balance Sheet)
The importance of each source of supply varies from country to country.
For example, Tanzania produces most of the maize it needs while Lesotho imports much of its maize from South Africa.
Sources of supply can also vary within a country. Urban areas tend to have a larger share of imported food compared to rural markets. Areas that are vulnerable to food insecurity may have a lot of food aid available. Markets in border districts may have a significant amount of commodities from across the border, through both formal and informal trade.
Cross border trade
While cross border trade may not be large in comparison to the total national supply, it can be quite significant within a specific province or district.
For example, Mozambique and Malawi have very porous borders and there is a considerable flow of maize and other commodities across the borders.
In contrast, the flow of maize from Tanzania to Malawi is very limited and occurs only infrequently.
Course – Markets Assessment and Analysis Lesson 1 – Markets and Food Security
Example: Livestock Cross Border Trade in the Greater Horn of Africa (GHA)
Cross-border livestock trade takes place in the GHA for various reasons including excess supplies in source countries and the proximity to cross border markets relative to domestic markets.
For example, livestock from the pastoral areas of Ethiopia are squeezed out of the domestic markets that are dominated by large supplies of animals from the highlands. They are then marketed in Kenya and Somalia.
Cross border trade links are strong between neighboring countries, such as Kenya and Ethiopia, without significant international markets. Disruptions in overseas export trade as a result of bans on imports also increase the volume of intra-regional trade.
The economic impact of the ban on livestock imports from the GHA by Saudi Arabia between February 1998 and May 1999 and again in late 2000 and due to a Rift Valley Fever (RVF) outbreak in Kenya and Somalia was massive.
The volume and value of livestock exports from pastoralists in Somaliland, Somalia, Region V of Ethiopia, and Eritrea tumbled.
Exports through the port of Berbera in Somaliland dropped from nearly three million heads in 1997 to just over one million in 1998, and the value of lost export earnings was
estimated at around $100 million.
Prices of livestock fell by around 30 percent in Eritrea, Ethiopia, and Somalia as a result of the ban.
Other countries in the GHA included in the ban were only marginally affected, as the Gulf was not a significant importer from these countries.
Source: Awuor, Thomas (2007)
“A Review of Trade and Markets Relevant to Food Security in the Greater Horn of Africa.” FEWS NET
MARKET DEMAND
Market demand is the amount of a particular good or service that a consumer or group of consumers will want to purchase at a given price.
Only people who can pay for their food have effective demand.
There are households and people who have wants or needs, but cannot afford to pay for them. These households have insufficient access to food – they have demand, but not effective demand.
This difference is important to market and food security analysis because market supplies only reach those with effective demand.
The needs of those households with limited or no effective demand can only be met through their own agricultural production, social transfers and/or government or humanitarian interventions.
Course – Markets Assessment and Analysis Lesson 1 – Markets and Food Security
Learners’ Notes 9
In the case of food staples, demand comes from national and foreign consumers, industries that use a certain commodity as an input (e.g. maize for chicken feed), government grain reserve boards and international organizations that will use the purchased commodities for food distribution programs.
It is important to consider derived demand, which is the demand for a commodity as an input. For example, Nigerian chicken producers buy maize or millet because they use it to feed their chickens.
• Derived demand can be significant to food security analysis because when
businesses like poultry production buy a lot of grain for feed, they can push up the price of food for household consumers.
Example: External Factors That Determine Food Supply in Niger
The hike in food prices in Niger followed steep price rises in Nigeria, caused by lower agricultural production and buoyant demand stemming from high consumer purchasing power and demand from the poultry and food processing sectors.
Higher prices in Nigeria caused a drastic drop in exports to Niger, while cereal flows reversed: Niger was supplying Nigeria.
This trade-driven supply squeeze was compounded by lower domestic crop production because of locust attacks and some dry spells.
Source: excerpt from Humanitarian Practice Network Reports, http://www.odihpn.org/
Let’s answer some questions about supply and demand...
• Is market supply equal to the total supply available in the country?
No, market supply refers only to the supply that is exchanged. Production that is consumed on the farm and stocks that are held in storage are not included in market supply, although they are part the total supply.
• Are people who would like to consume more rice, but do not have sufficient money to purchase it, considered part of market demand for rice?
No, these are people who have no effective demand – they do not have sufficient money to purchase rice, even if they would like to consume more.
Course – Markets Assessment and Analysis Lesson 1 – Markets and Food Security
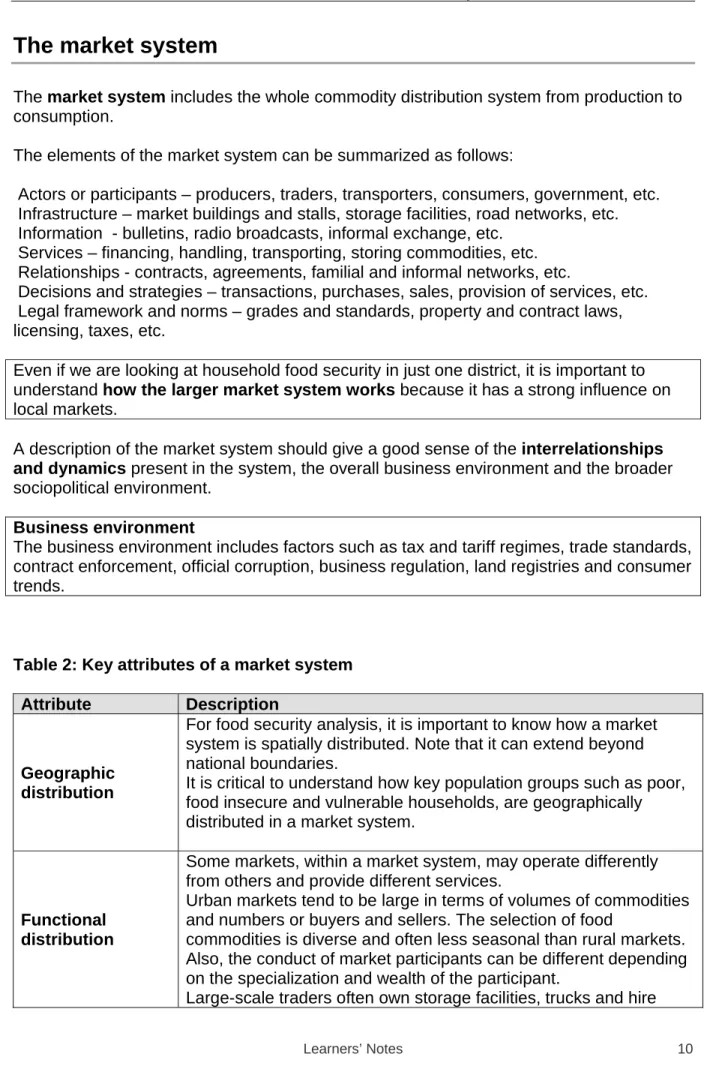
The market system
The market system includes the whole commodity distribution system from production to consumption.
The elements of the market system can be summarized as follows:
Actors or participants – producers, traders, transporters, consumers, government, etc. Infrastructure – market buildings and stalls, storage facilities, road networks, etc. Information - bulletins, radio broadcasts, informal exchange, etc.
Services – financing, handling, transporting, storing commodities, etc. Relationships - contracts, agreements, familial and informal networks, etc.
Decisions and strategies – transactions, purchases, sales, provision of services, etc. Legal framework and norms – grades and standards, property and contract laws, licensing, taxes, etc.
Even if we are looking at household food security in just one district, it is important to understand how the larger market system works because it has a strong influence on local markets.
A description of the market system should give a good sense of the interrelationships and dynamics present in the system, the overall business environment and the broader sociopolitical environment.
Business environment
The business environment includes factors such as tax and tariff regimes, trade standards, contract enforcement, official corruption, business regulation, land registries and consumer trends.
Table 2: Key attributes of a market system Attribute Description
Geographic distribution
For food security analysis, it is important to know how a market system is spatially distributed. Note that it can extend beyond national boundaries.
It is critical to understand how key population groups such as poor, food insecure and vulnerable households, are geographically distributed in a market system.
Functional distribution
Some markets, within a market system, may operate differently from others and provide different services.
Urban markets tend to be large in terms of volumes of commodities and numbers or buyers and sellers. The selection of food
commodities is diverse and often less seasonal than rural markets. Also, the conduct of market participants can be different depending on the specialization and wealth of the participant.
Course – Markets Assessment and Analysis Lesson 1 – Markets and Food Security
Learners’ Notes 11
people to purchase and assemble commodities. They may import goods from abroad, use cell phones, have many contacts in a wide range of markets and across borders and have access to more credit and other financial resources.
Small-scale traders often rely on local buses and trucking services for transportation, have a high turn over of purchases and sales, limited stocks, and may or may not hire some casual labor.
Seasonal patterns
The number and type of participants engaged in the market may change over the year.
For example, the numbers of traders and transport services tend to peak around the harvest period.
The volume, origin and quality of commodities in the market change over the year.
Local products are more common at harvest time and imported products are more common during the lean season.
Road infrastructure becomes unusable during the rainy season in areas that do not have all-weather roads.
The quality of perishable products such as vegetables and grains changes throughout the year and can influence prices.
Market prices at all levels of the market also follow seasonal patterns.
Responses and strategies related to stresses and shocks
When traditional sources of supplies are affected by unfavorable weather, natural disasters, internal/external conflict, etc., traders turn to alternative sources. They may have fairly regular patterns of sourcing supplies between normal and bad seasons.
Governments impose bans and other restrictive regulations in times of scarcity.
Livestock owners and pastoralists frequently bring animals to the market for sale in larger numbers and earlier in the season when there has been a drought and pasture conditions are poor. Many rural households engage in more causal employment to compensate for revenue losses when harvests are poor or prices of the commodities they grow and sell are low, which can cause a drop in casual wages.
All of the elements of the market system can exhibit seasonal patterns as well as somewhat predictable responses to market threats and stresses. Knowing what the typical patterns are can help us interpret the market and anticipate rises in food insecurity and food crises.
Course – Markets Assessment and Analysis Lesson 1 – Markets and Food Security
Market networks
Market networks describe commodity flows and points of exchange from production to the final consumer.
In its simplest form, a market network refers to how a market system is structured
spatially.
Market networks are typically represented as maps.
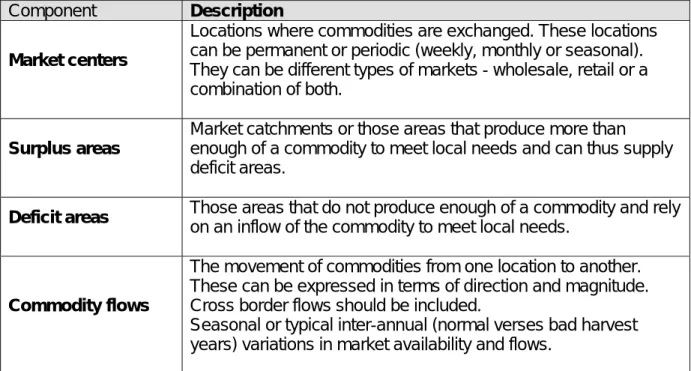
Table 3: Key components of a market network
Component Description
Market centers
Locations where commodities are exchanged. These locations can be permanent or periodic (weekly, monthly or seasonal). They can be different types of markets - wholesale, retail or a combination of both.
Surplus areas
Market catchments or those areas that produce more than enough of a commodity to meet local needs and can thus supply deficit areas.
Deficit areas Those areas that do not produce enough of a commodity and rely
on an inflow of the commodity to meet local needs.
Commodity flows
The movement of commodities from one location to another. These can be expressed in terms of direction and magnitude. Cross border flows should be included.
Seasonal or typical inter-annual (normal verses bad harvest years) variations in market availability and flows.
Course – Markets Assessment and Analysis Lesson 1 – Markets and Food Security
Learners’ Notes 13
Changes in supply and demands
We have already said that markets are dynamic.When we assess food security and design responses or interventions, we are often interested in how food insecure households and food suppliers will react to market changes.
When production is poor and less food enters the market, the supply of food decreases. Also, some households that produce food find it necessary to resort to the market for a larger share of their typical food needs. So, both supply and demand can change. The interaction of supply and demand determines prices.
Price is the cost or value of a good or service expressed in monetary terms.
The price, in the purest sense, indicates the value that has been given to a particular commodity.
Price signals can carry information about the cost of production, transportation, storage, perceptions and desires as well as, in some instances, distortions.
A price represents an agreement between a buyer and seller arrived at through a negotiated process.
The prevailing price at a given level or stage of the market (e.g., farm gate, wholesale, retail) represents the negotiated equilibrium point reached between buyers and sellers at that stage of the market.
Buyers and sellers are always negotiating transactions based on what they expect the price to be and what price is being offered. So, while supply and demand determine prices, prices influence what amount buyers want to buy and what amount sellers want to sell. In other words, as price changes, supply and demand respond.
The following diagram shows the relationship between supply, demand and price (Pe). Diagram 1: The market: supply and demand
Quantity supplied or demanded
Demand Supply
Price
Course – Markets Assessment and Analysis Lesson 1 – Markets and Food Security
Supply usually falls when the price falls, and demand usually falls when the price rises. That’s why the supply curve slopes upward and the demand curve slopes downward.
See Annex 2: Illustration of Supply and Demand Change
Decision makers and food security analysts are often asking the questions: • What happens when the price of a basic good rises?
• Will more supplies come into the market?
• Will consumers be willing and able to pay for the good at higher prices if supplies don’t increase?
For food security analysis, it is very important to know how supply or demand responds to changes in market conditions, especially price changes.
To predict this response, we use a concept called “elasticity”.
Elasticity is the percentage change in one thing relative to a percentage change in another.
For example, if the demand for maize is very inelastic, a small increase in the price of maize will cause a very small reduction in the demand for maize.
If the demand is very elastic, a small increase in the price of maize will cause a large decrease in demand.
Knowing how elastic supply and demand are helps the food security analyst estimate what effect a shift in supply or demand may have on market prices.
Understanding elasticity is important because, when the price of a commodity changes, it tells you:
• how likely consumers will be to change the amount of that commodity they demand and, ultimately, consume; and
• how likely traders and other sellers will be to change the amount they supply and thus how much of a commodity will be available on the market.
Knowing how elastic supply and demand are is important if you want to assess changes in market conditions and their impact on food security.
Course – Markets Assessment and Analysis Lesson 1 – Markets and Food Security
Learners’ Notes 15
Summary
Markets can be viewed as social arrangements that allow buyers and sellers to obtain information and exchange goods and services.
Typically, commodity chain channels comprise four basic types: Farm gate/Producer, Assembly, Wholesale and Retail/ Consumer.
Markets are affected by supply and demand:
• market supply is the amount of a commodity being offered in the market; while • market demand is the amount of a commodity desired (demanded) from the market. The market system includes the whole commodity distribution system from production to consumption.
Market networks describe commodity flows and points of exchange from production to the final consumer.
Price is the cost or value of a good or service expressed in monetary terms.
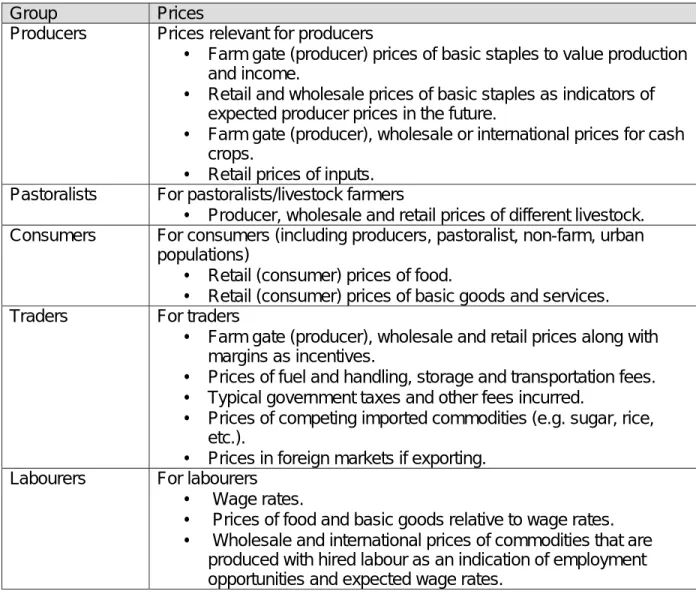
Food security analysts are typically interested in prices of basic commodities, goods and services that are closely related to food security.
Elasticity is the percentage change in one thing relative to a percentage change in another.
Course – Markets Assessment and Analysis Lesson 1 – Markets and Food Security
If you want to learn more...
Online resourcesFEWS NET (http://www.fews.net) RATIN (http://www.ratin.net
ACDI/VOCA “Value Chain Approach: Strengthening Value Chains for Economic Opportunities.” (http://www.ACDIVOCA.org
Additional reading What Are Markets?
Awuor, Thomas (2007). “Review of Trade and Markets Relevant to Food Security in the Greater Horn of Africa.” FEWS NET.
Dradri, Simon (July 2007) “A Market Analysis of the Food Security Situation in Southern Africa in 2007/2008.” Lusaka, WFP.
Murphy, E. (2006), Sierra Leone Bellmon Analysis FY’06, CORAD: CRS/Africare, CARE/World Vision Sierra Leone
Ministere de L’Agriculture de L’Hydraulique et des Resources Halieutiques, Rep. Du Burkina Faso (2004) « Resultates Previsionnel de la Campagne Agricole 2004-2005 et de la Situation Agricole »
WFP/FEWS NET “Southern Africa Informal Trade” Bulletins
Beekhuis, G., Niger: Profil des Marchees Cerealiers, WFP-SENAC, August 2005, Senegal
The Market System
CARE (2004)). “Rationale for a Possible Market Support Program in Darfur, Sudan: A Brief Look at Markets and Food Security.”
WFP (2006). “Emergency Food Security Assessment Handbook.” Helvetas (2002). Clients First! A Rapid Market Appraisal Toolkit
Market Networks
FEWS NET “Structure-Conduct-Performance and Food Security.” Market Guidance No. 1 Holtzman (1986) “Rapid Reconnaissance Guidelines for Agricultural Marketing and Food Systems in Developing Countries.” MSU International Development Working Paper No 30.
Course – Markets Assessment and Analysis Lesson 1 – Markets and Food Security
Learners’ Notes 17
Supply and Demand Response
Tomek and Robinson (1985). Agricultural Product Prices. Cornell University Press. WFP (2007). “PDPE Market Analysis Tool: Price and Income Elasticities.”
Dorosh, Paul and Steve Haggblade (2006) “Incorporating Market Responses in
Emergency Needs Assessments: A Prototype Spreadsheet Model for Zambia.” Rome, WFP.
FEWS NET (2007) “Price Parity and Early Warning” Market Guidance No 2
Dradri, Simon (2007) “A Market Analysis of the Food Security Situation in Southern Africa in 2007/08.” Lusaka, WFP.
William A. Ward (1977) “Calculating Import and Export Parity Prices,” Training material of the Economic Development Institute, CN-3 Washington DC, World Bank
WFP (2007) “PDPE Market Analysis Tool: Import Parity Price.”
CARE (May 2007) “A Market Analysis and Decision Tree Tool for Response Analysis: Cash, Local Purchase and/or Imported Food Aid: A Decision Tree Tool.” Atlanta, CARE. FAO (2007) “FAO/GIEWS Guidelines for Crop and Food Supply Assessments.” Rome, FAO.
Murphy, E. (2006), Sierra Leone Bellmon Analysis FY’06, CORAD: CRS/Africare, CARE/World Vision Sierra Leone.
Course – Markets Assessment and Analysis Lesson 1 – Markets and Food Security
Annex 1: Example of national supply (Food Balance Sheet)
Bilan céréalier national Prévisionnel de la Campagne 2004-2005POSTES RIZ BLE
MIL,SORG HO MAÏS, FONIO
TOTAL Burkina Faso POPULATION AU
30/04/05 12 614 854
1. DISPONIBILITES 53 792 0 2 791 221 2 845 013
PRODUCTION BRUTE (CAMP
2004/5) 95 168 0 2 967 334 3 062 502
PRODUCTION DISPONIBLE 52 342 0 2 522 234 2 574 576
STOCKS INITIAUX (AU 01/11/2004) 1 450 0 268 987 270 437
-STOCKS PAYSANS 0 0 234 796 234 796 -AUTRES STOCKS 1 450 0 34 191 35 641 2. BESOINS 165 255 32 762 2 322 918 2 520 934 NORMES DE CONSOMMATION(kg/hbt/an) 13,1 2,5 174,4 190 CONSOMMATION HUMAINE 165 255 31 537 2 200 031 2 396 822
STOCKS FINAUX (AU 31/10/2005) 0 1 225 122 887 124 112
+ STOCKS PAYSANS 0 0 66 716 66 716 + AUTRES STOCKS 0 1 225 56 171 57 396 3. EXCEDENT(+)/DEFICIT(-) BRUT -111 462 -32 762 468 303 324 079 4. SOLDE IMPORT/EXPORT 223 654 44 840 -27 310 241 184 IMPORTATIONS COMMERCIALES -2004/5 217 554 37 320 0 254 874 + COMMERCANTS PRIVES 210 774 37 320 0 248 094 + AUTRES IMPORTATIONS 6 780 0 0 6 780 AIDES ALIMENTAIRES 6 100 7 520 8 642 22 262 EXPORTATIONS PREVUES 0 0 35 952 35 952 5. EXCEDENT(+)/DEFICIT(-)NET 112 192 12078 440 993 565 263 6. DISPONIBLE APPARENT/HBT(kg) 22,0 3,6 219,1 244,6
Course – Markets Assessment and Analysis Lesson 1 – Markets and Food Security
Learners’ Notes 19
Annex 2: Illustration of Supply and Demand Change
This graph shows how supply and demand determine the price, Pe.
When there is a negative supply shock (e.g., an import ban imposed), the supply shifts back or to the left (S1 to
S2).
This causes the price to rise and the
quantity demanded falls as the price rises.
Price increases from P1 to P2 and the
quantity sold declines from Q1 to Q2 as
shown in the second graph.
Quantity supplied or demanded
Demand Supply Price P2 S1 S2 P1 Figure 2:
A supply shock – import ban or production shortfall Q2 Q1
Quantity supplied or demanded
Demand Supply
Price
Figure 1: The market: supply and demand
Course – Markets Assessment and Analysis Lesson 1 – Markets and Food Security
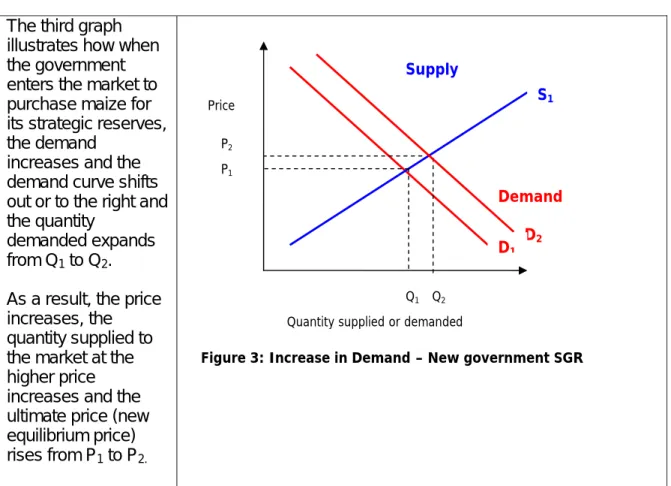
The third graph illustrates how when the government enters the market to purchase maize for its strategic reserves, the demand
increases and the demand curve shifts out or to the right and the quantity
demanded expands from Q1 to Q2.
As a result, the price increases, the quantity supplied to the market at the higher price increases and the ultimate price (new equilibrium price) rises from P1 to P2.
Quantity supplied or demanded
Demand Supply Price P2 S1 P1
Figure 3: Increase in Demand – New government SGR Q1
D2
D1
Course – Markets Assessment and Analysis Lesson 1 – Markets and Food Security
Learners’ Notes 21
Annex 3: Elasticity of Supply and Demand
Elasticity is the percentage change in one thing relative to a percentage change in another.
Supply and Demand Response and Elasticities
• The price elasticity of supply measures how responsive the market it is to price changes.
• The price elasticity of demand measures how responsive demand is to price changes.
Inelastic: If the supply of maize is very inelastic large increases in the price of maize will bring about only very small changes in the supply of maize, all other things being equal. If the demand for maize is very inelastic (steeper), a small increase in the price of maize will cause a very small reduction in demand.
Elastic: If supply of maize is very elastic (flatter), small changes in the price of maize will bring about a large increase in the supply of maize, all other things being equal. If the demand for maize is very elastic (flatter), a small increase in the price of maize will bring about a large decrease in the demand for maize.
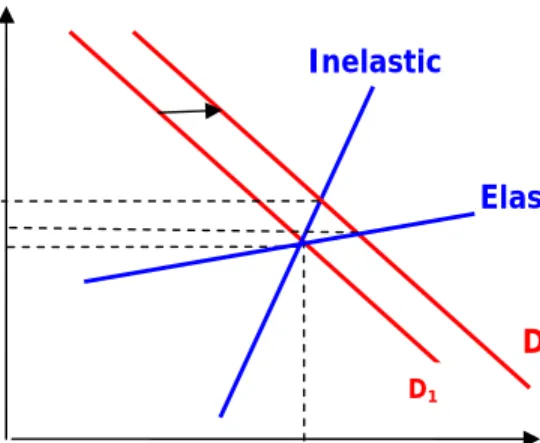
Figures 1 and 2 illustrate how the elasticities of supply and demand have an affect on price. In figure 1 we compare a shift in demand given an elastic supply and an inelastic supply. The elastic supply could depict a situation where there are open borders and commodities can flow freely across the border. The inelastic supply could represent a situation where the border is closed and supplies are relatively fixed until the next harvest. Note that an outward shift in demand from D1 to D2 (e.g., a large-scale brewery opens and
enters the market for local cereals) has a different effect on the price, depending on whether the supply is elastic (p1) or inelastic (p2). In both cases, prices increase due to
pressure from additional consumers entering the market. However, when supply is elastic, prices rise less than when supply is inelastic.
Quantity supplied and demanded
Demand Inelastic
Price
Figure 1: Elastic and inelastic
Elastic Price P2 P1 p D1 D2
Course – Markets Assessment and Analysis Lesson 1 – Markets and Food Security
Figure 2 illustrates what happens when supplies shift back (a typical supply shock scenario), given an elastic and inelastic demand. In this example let us assume that the second harvest of maize was extremely poor.
The elastic demand represents the case where:
the harvest of other basic crops was excellent;
households typically consume a variety of staples such as maize, millet, cassava and sweet potato; and
they can easily substitute another commodity for maize. The inelastic demand depicts the case where:
households have a strong preference for maize;
few other staples are produced or marketed; and
households don’t really have the choice of a substitute for maize.
Implications of an Inelastic Supply of Food
Because agricultural production is generally seasonal with one or two harvests per year and moving commodities from one location requires some planning as well as significant costs, the supply of food commodities tends to be inelastic, at least, in the short to medium term. A more inelastic, and therefore less responsive, supply implies a greater rise in the price and a drop in the quantity when supply shifts back due to a production shortfall. It also means that the price will need to increase more, in order to bring more supplies onto the market.
Implications of an Inelastic Demand for Food
Basic food commodities are necessities, especially for lower income households. The demand for basic food commodities tends to be inelastic. As with supply, inelastic demand implies greater price rises when demand increases.
Characteristics of Supply and Demand and Elasticity
There are a number of characteristics that affect the elasticity of supply. If there are ample stocks of maize, no restrictions to trade, prices are relatively high and maize prices are
Quantity supplied and demanded Elastic Suppl
Figure 2: Elastic and inelastic demand
Price
P2
Inelastic
S2 S1
Course – Markets Assessment and Analysis Lesson 1 – Markets and Food Security
Learners’ Notes 23
expected to decline in the near future (reducing potential future returns), the supply of maize is likely to be more elastic. Sellers are likely to take advantage of the high prices and bring supplies into the market hoping to sell before prices are expected to decline. If there a few sellers, limited stocks, relatively low maize prices and maize prices are
expected to rise in the near future, supply is inclined to be more inelastic and sellers will be less likely or slower to respond to an initial price increase with increased supplies. Thus, knowing something about the characteristics of supply and elasticity can help a food security analyst determine if a rise in a basic food commodity price will be followed by an inflow of food into the local market or not.
Similarly, there are a number of characteristics that affect the elasticity of demand. If households are indifferent about eating maize or millet, substantial supplies of millet are in the market and maize prices are rising, households will probably switch from buying maize to buying millet if the price of maize begins to rise. On the other hand, if households strongly prefer maize over other cereals and all other cereals are in short supply,
households may forgo buying other goods in order to continue buying maize despite the higher price, or they may purchase less maize and reduce the size of their meals. Thus, the elasticity of demand can help a food security analyst determine how households will respond to a rise in basic food commodity prices.
In different places and at different times, supply and demand for a specific commodity can have any combination of these characteristics. A combination of characteristics will
determine whether supply and demand are or more or less elastic. Some of the standard characteristics and effects on elasticities are included in the following table.
Course – Markets Assessment and Analysis Lesson 1 – Markets and Food Security
What makes supply or demand elastic? More Elastic
Demand Supply
• Diverse preferences – people like to eat many different kinds of foods like cassava, millet and rice, not just rice • Availability of close substitute
commodities for final consumption – maize is scarce but millet, sorghum and rice are plentiful
• Availability of close substitutes for derived demand
• The commodity is NOT a necessity • Higher incomes
• Luxury commodities
• Many close substitutes
• Significant competition among sellers • More continuously produced – more of the
commodity can be brought onto the market • Available stocks
• Limited market barriers – few formal or informal fees and legal restrictions, etc • Good market infrastructure – good roads,
telecommunications, etc
• Significant excess or surge capacity • Expectations that prices will be decreasing • Adjustment period is longer – e.g., several
months as opposed to a few days or a week
Less Elastic
Demand Supply
• Rigid preferences – people eat predominantly rice in Asia or predominantly maize in Southern Africa
• Limited or no close substitute commodities are available for final consumption – maize, millet, sorghum and rice are all scarce
• Limited or no close substitutes for derived demand
• The commodity is a necessity • Lower incomes
• Additive commodities
• Few close substitutes
• Lack of competition among sellers • Produced (harvested) infrequently • Limited or no stocks
• Market barriers – formal and informal fees or restrictions, etc
• Poor market infrastructure – poor roads, telecommunications, etc
• Limited or no surge capacity
• Expectations that prices will be increasing (speculation)
• Short period of adjustment
Many of these characteristics stay relatively stable over a long period of time. For
example, people’s preferences for certain foods stay relatively the same over a long period of time. As a consequence, elasticities are relatively stable over time.
Food Security Information for Action
Markets Assessment and Analysis
Lesson 2
Assessing Markets
Learners’ Notes
© FAO, 2008
This course is funded by the European Union and implemented by the Food and Agriculture Organization
Course – Markets Assessment and Analysis Lesson 2 – Assessing Markets
Table of contents
Learning objectives ...2 Introduction...3 Components of a market assessment ...4 Analysis of demand ...5 Selecting market indicators ...6 Analysis of demand ...7 Selecting market indicators ...8 Analysis of demand ...9 Supply and market systems ...10 Types of market assessment ...14 Markets and response design ...17 Summary ...18 If you want to know more ...19 Annex 1: Listing Important Key Consumption Markets...20 Annex 2: Key Production/Income Commodities...21 Annex 3: Listing Important Consumption Markets ...22 Annex 4: Listing Important Production or Income-Generating Markets...23 Annex 5: Using market calendars and market chain diagrams ...24 Annex 6: Gathering market information ...28 Annex 7: Market Questions – Market Baseline or Profile ...30 Annex 8: Typical Market Monitoring and Early Warning Questions ...32 Annex 9: Standard Market Questions for Disasters...33 Annex 10: Sample Trader Survey Outline for Disasters ...35 Annex 11: Typical Market Recovery - Development for Food Security Questions...37 Annex 12: Typical Markets Questions for Cash vs Food Response Choices ...39 Annex 13: Choosing between cash and food programming ...40
Course – Markets Assessment and Analysis Lesson 2 – Assessing Markets
Learners’ Notes 2
Learning objectives
At the end of this lesson you will be able to:
• identify the components of a typical market assessment for food security; and • understand what are the different market assessment tools and their applications.
Course – Markets Assessment and Analysis Lesson 2 – Assessing Markets
Introduction
Information on markets can help you understand worsening or improving food security conditions as well as enhance your food security analysis and identify appropriate responses.
It is important to have an understanding of how markets operate and, particularly, how they relate to and affect food security and vulnerable households.
This lesson will introduce some methods used to assess markets for improving food security analysis.
Course – Markets Assessment and Analysis Lesson 2 – Assessing Markets
Learners’ Notes 4
Components of a market assessment
Market assessments tend to follow a similar format, using some standard methods, and produce some standard outputs. They can be national, sub-national or regional in scope. A good market assessment should be designed to answer a specific set of questions and objectives.
Demand and supply and the market system should be assessed.
The assessment should be focused on markets and market performance as they relate to food security.
It should consider constraints, opportunities and both demand and supply impacts and capacities to respond.
The contents of an assessment typically include: • Definition of the objectives
• Analysis of demand
• Analysis of Supply and the market system
• Analysis of constraints, opportunities and response • Concrete recommendations for interventions
Course – Markets Assessment and Analysis Lesson 2 – Assessing Markets
Analysis of demand
To describe the demand, you first have to identify which commodities are relevant to which population groups (livelihood groups) and how/where households access these
commodities.
Different commodities can be important to different food insecure populations. For
example, some groups eat mostly rice; others eat a combination of different cereals such as millet, maize and sorghum, etc.
Livelihoods of food insecure people may also depend on commodities that they do not consume but that are important to production and income generation.
Food security relevant commodities might include:
Food security relevant commodities might include: food crops, cash crops, livestock and livestock products, fish, non-food items such as fuel wood, carpets, labour.
Important food security commodities
An important food security commodity can be: • a staple (maize, rice, wheat, cassava, etc);
• one that only the poorest consume even if it is not widely consumed by the rest of the population;
• a poorer quality or lower grade of the country’s basic staple; or
• a commodity that is consumed only or mainly when households are under stress and substitute this inferior food for a more preferred one (substitute commodity).
Course – Markets Assessment and Analysis Lesson 2 – Assessing Markets
Learners’ Notes 6
Selecting market indicators
To select commodities, you need to identify:• Consumption Commodities, which are the most important commodities from a consumption point of view.
• Production/income Commodities, which are the most important commodities from an income earning point of view.
Consumption Commodities
These “food security” commodities may not be the same as those which make up the bulk of what you find in the market.
While the majority of the population may consume rice, the poorest may consume
cassava. There are those who can afford to eat and purchase a certain desirable quality of wheat, while the poor and food insecure consume and buy an inferior quality of wheat. Also, you want to make sure to include the commodities that food insecure households tend to consume as substitutes for their more preferred foods when these preferred foods are scarce and expensive. Some commodities can play an important role in the diet when there are stresses: poor harvests, price spikes, border closings, etc can inhibit preferred patterns of consumption and it’s useful to note the alternative foods at such times.
See Annex 1: Listing Important Key Consumption Commodities
Earning Commodities
You also need to identify which commodities are important to production and income generation and thus food access.
Households may or may not consume what they grow or raise predominately for income. Most rural small-scale producers grow and sell basic grains. Pastoralists depend on livestock – cattle, camels, sheep and goats. Women often earn income from small
livestock and poultry. Households with secure land tenure may earn income from perennial crops such as cashews, coffee, palm oil and tea. Coastal populations may depend on fish and fish processing.
Some households will work for others as casual labour and their employment opportunities are dependent on the markets for a certain commodity, e.g. coffee. For many households that are vulnerable to food insecurity, there are foods that they consume more of when they experience some kind of shock or stress. In Uganda, cassava is often called a “food security” crop because a household can store it in the ground and harvest whenever there is scarcity of other foods such as “matoke” (plantains), a preferred food.
Food security crops are important to consider too even if they aren’t eaten as frequently.
Course – Markets Assessment and Analysis Lesson 2 – Assessing Markets
Analysis of demand
You will also need to know some basic characteristics of demand: • Are theses commodities necessities?
• Are there substitutes for these commodities?
• Are these commodities consumed in greater or lesser quantities as incomes rise? • How elastic or inelastic do you think the demand is?
Substitute Commodity
A substitute (commodity) is a commodity that can replace another in consumption or production, such as millet for sorghum.
When the price of one commodity rises, consumers or agro-processors will decrease their consumption of it and increase consumption of the substitute commodity. Wild and
gathered products can be substitutes for preferred staples of food insecure households, especially in times of stress or increasing food insecurity.
The term “substitute” can also be applied to crops where farmers choose to plant more or less of substitute crops, e.g., sorghum or millet, depending on the prices they expect to receive once they harvest and sell their crop.
Whether a substitute in consumption or production, the more easily one commodity (crop) can replace the other, the more important it is to consider the price and price behavior of both commodities in your market analysis.
Another important aspect of demand is which markets are important to food security. While the bulk of a country’s marketable cereals may flow through a few key markets or end up being sold to urban consumers in certain towns and cities, the most food insecure populations may depend on or have access to just one or two minor markets to sell their produce, livestock and labour or to buy their food and other basic goods. These minor markets will be important ones to include in your analysis.
The few markets that food insecure populations depend upon may be supplied by
commodities that were assembled in other major markets. These markets should also be considered.
Food insecure groups may also rely on labour markets. E.g., an analysis of the labour market for sugar cane cutters may be helpful, especially if households rely on this sector to buy food rather than grow it.
Course – Markets Assessment and Analysis Lesson 2 – Assessing Markets
Learners’ Notes 8
Selecting market indicators
To select commodities, you need to identify:1. Consumption Markets, which are the most important markets from a consumption point of view.
Key questions
To select consumption markets, you need to decide:
• At which markets do food insecure and vulnerable populations buy their basic food commodities?
• Which markets have important links to these consumption markets?
− Which markets are these markets dependent on for supplies (e.g. does most of the commodity move through certain provincial or border markets prior to being onward shipped to these less central markets)?
− Do sellers supply other markets that may compete for supplies (e.g. are there major urban centers within the country or across the border with large populations who are willing and able to pay higher prices and typically draw in significant supplies)?
See Annex 3: Listing Important Consumption Markets
2. Production/Income Markets, which are the most important markets from an income earning point of view.
Key questions
To select production or income-generating markets, you need to decide:
• At which markets do food insecure and vulnerable populations sell their produce? • Which markets have important links to these production markets?
− Which markets do these markets supply?
− Do buyers purchase from other markets that may have larger and cheaper supplies?
Course – Markets Assessment and Analysis Lesson 2 – Assessing Markets
Analysis of demand
When you conduct a market assessment it’s important to consider total demand – vulnerable and food secure households, other consumers, derived demand (breweries, bakeries), government and non-governmental buyers, etc.
You should make sure you take into account other consumers in the market who, together with the food insecure population, make up the total demand.
They can be:
• relatively wealthy consumers with significant purchasing power and similar food or consumption preferences living in large urban areas within the country or across the border;
• bakeries, breweries, feed processors and poultry producers buying cereals as inputs; and
• government and/or non-governmental organizations making local purchases to support their strategic grain reserves or humanitarian programmes.
Course – Markets Assessment and Analysis Lesson 2 – Assessing Markets
Learners’ Notes 10
Supply and market systems
Different tools can be used to assess demand, supply and the market systems:
1. Market calendars and market chain diagrams; 2. Market network maps;
3. Basic seasonal and historical price trends; and 4. The Structure-Conduct-Performance framework.
1. Market calendars and market chain diagrams
A market calendar is a simple tool that illustrates the availability of a commodity or a group of commodities in the market throughout the calendar year.
Market chains illustrate the points within the market system where production, transformation, distribution and consumption of a commodity take place.
See Annex 5: Using market calendars and market chain diagrams 2. Market network maps
One of the best ways to identify which markets should be included and who to interview within the market system is to sketch out market maps for the key food security
commodities: one for each commodity.
Just take a map and draw the network for the commodity and populations you are most interested in.
Market network maps help highlight which areas of a country are linked to one another through markets, and which areas of a country are linked to neighbouring countries through cross border trade and markets.
Maps can be constructed for sub-national, national and regional market networks.
Building market network maps
Commodity market maps can be constructed in a number of ways. In general they can be based on data, experience or both. They can use mapping or graphics software, photos and/or sketches.
The choice of methods will depend on what you have at hand:
the type of data and information and how reliable or representative you think it is; the type of technology that is available such as computers, software, cameras, etc; and what you want to do with the map such as perform spatial analysis, plan an assessment, describe the market system for a report or use at a workshop, etc.
Market network maps: example 1
This map was constructed using a review of literature, the collective experience of the analyst and key informants from different countries who the analyst interviewed. He used mapping software to construct the base maps and graphics software to edit and adjust the final product. Because this map is digital, it can be easily shared and adapted using additional information or data.
Course – Markets Assessment and Analysis Lesson 2 – Assessing Markets
Market network maps: example 2
These two maps were created at workshops. The attributes such as the classification of areas as surplus or deficit, commodity flow lines, etc were all derived from the experience of the workshop participants, which included staff from local ministries and food security working groups.
These maps were photographed, downloaded and recreated using GIS software.
The Somali sorghum network map was constructed on a base map built using software. The Haitian maize network map was drawn on an ordinary road map that had been laminated for easy sketching and editing.
3. Basic seasonal and historical price trends
Commodity prices tend to follow a seasonal pattern. Looking at seasonal price movements helps us to understand:
Course – Markets Assessment and Analysis Lesson 2 – Assessing Markets
Learners’ Notes 12
• seasonal patterns of food insecurity (changes in price behaviour make the access to food more difficult in some periods of the year).
• price expectations (if prices are high and we are nearing the harvest, we can expect them to begin to fall; if they are high and we are just moving into the rainy season and period where crops are growing in the fields, we can expect it to be quite a while before prices come back down).
• market performance (seasonal price patterns also indicate relative scarcity and abundance of food and wide variations may suggest that markets are not adjusting well – commodities are not efficiently moving from areas with low prices to those with high prices).
Seasonal pattern of prices
Typical Seasonal Price Movement
Prices are low at harvest time and tend to grow throughout the marketing or consumption season, reaching their peak during the hungry season and fall at the next harvest.
The variation over the season tends to be more dramatic or accentuated where there are few alternative sources of supply and the market is dependent on local production. The pattern is more pronounced for unimodal (one harvest per year) production system. Bimodal (two harvests per year) production systems can have two price peaks and troughs, but these are frequently less pronounced.
Hungry Season Price $/kg Next Harvest Harvest Time
Course – Markets Assessment and Analysis Lesson 2 – Assessing Markets
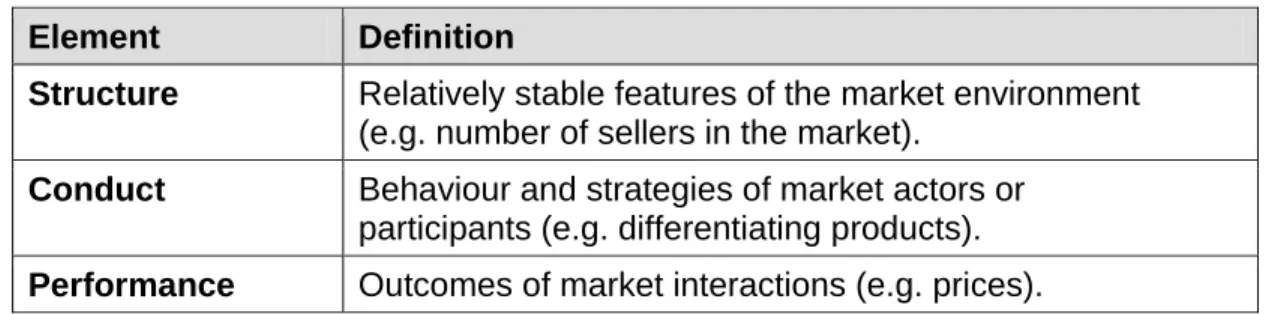
4. The Structure-Conduct-Performance framework
The Structure-Conduct-Performance (S-C-P) approach is based on the idea that the structure of a market influences the conduct of its participants (buyers and sellers) which, in turn, influences its performance.
Table 1: Definitions of Structure-Conduct-Performance for Food Security Analysis Element Definition
Structure Relatively stable features of the market environment (e.g. number of sellers in the market).
Conduct Behaviour and strategies of market actors or participants (e.g. differentiating products).
Performance Outcomes of market interactions (e.g. prices).
Central to assessing current and future food security conditions as well as designing responses or interventions, is being able to estimate how food insecure households and food suppliers will react to market changes.
What type of demand and supply response will there be? Will traders who have stocks of commodities available in one location or market move them to another market that is experiencing scarcity and rising prices?
Wherever there are significant formal or informal cross border flows of commodities, it is important to account for the possibility that commodities could move into and out of border areas and the broader market networks as the market conditions change.
It is important to collect all possible information about the market system and how it operates in normal conditions as well as under typical stress conditions (e.g., production shortfalls, post hurricane or cyclone).
Collecting information on markets can take time and may be impractical within the tight time frame of an emergency. Much of this information can be gathered and organized once and periodically updated.
Often some of this basic market information is already available and just needs to be gathered and incorporated in the food security assessment.
Course – Markets Assessment and Analysis Lesson 2 – Assessing Markets
Learners’ Notes 14
Types of market assessment
The types of tools used for data collection and analysis are basically the same for all types of assessments. What changes are the objectives, the questions asked and breadth of the assessment.
The following typical applications of assessment are presented on the next screens together with standard questions and tools:
1. Market Food Security Monitoring and Early Warning 2. Markets and Food Security Disaster Assessment 3. Market Assessment of Recovery Programs
1. Market Food Security Monitoring and Early Warning
The following process describes how markets fit into food security monitoring: • Initial baseline market assessment
At the beginning of the season, a baseline assessment of the market context, structure, conduct and performance is required if this information does not already exist.
The assessment for the coming season is sometimes called an outlook. The following are the sources of information for initial assessments:
− available data and information,
− output from a food security or vulnerability assessment that was undertaken, and
− interviews with key informants at the local ministries, agencies and associations that deal with the commodities that were deemed food security relevant.
Some interviews, or even quick phone calls, can be made to traders and other well-informed and cooperative market participants (e.g., millers, transporters).
This type of assessment or outlook only needs be updated infrequently. It does not have to be constantly adjusted by the monitoring system. However, it should be updated at least once during the season.
Updates allow you to reassess your previous assumptions and expectations as well as capture the dynamics of markets and their potential impact on food security.
See Annex 7: Standard Questions to develop a Market Baseline or Profile • Regular monitoring
In the process of regular monitoring, current data and information are compared to historical trends, five-year averages or a similar situation in the past looking for anomalies that could suggest significant changes in market and food security
conditions. The initial market assessment or market profile is also used as a reference and it allows us to gauge the significance of the anomalies we see and their
implications on food security.
Course – Markets Assessment and Analysis Lesson 2 – Assessing Markets
• Signs of deterioration or improvement in food security that are related to food availability and access. Some examples of signs of deterioration are:
− production shortfalls;
− non-seasonal increases in the prices of food;
− distress sales of livestock (e.g. sales of breeding stock or draft animals); and
− larger numbers of people migrating in search of casual employment.
• Signs of the way the markets are functioning that could have implications on food security, e.g. declines in world market prices for important crops. Signs of the way the markets are functioning that could have implications on food security, e.g. declines in world market prices for important crops.
Important cash crops are, for example, tobacco or crops for which there is usually a high demand for casual labour like cotton or coffee picking.
Traders might be buying in areas where they don’t typically buy or where they may have started purchasing commodities earlier in the season.
The government might have changed commodity price policies or purchase and sales programs.
See Annex 8: Typical Market Monitoring and Early Warning Questions
As aspects of the market are changing every day and participants are constantly adjusting to these changes, market information and market analysis add a dynamic element to food security analysis.
Assessing markets for food security monitoring and early warning works the same way as food security monitoring and early warning work in general.
The assessment focuses on the following: • Look for anomalies (what is different) • Look for trends
• Historic (over a number of years) • Seasonal (over one year)
• Compare information to reference points/periods (the profile, another drought year) • Project future trends
• Estimate demand and supply response
• Form expectations, make plausible assumptions and develop outlooks Food security monitoring and early warning are normally focused on slow onset disasters, that evolve over a period of time (e.g. droughts), and may allow markets, households and decision makers to adjust and either prevent or mitigate impacts.
However, monitoring and early warning also help to understand how a rapid onset
disaster (e.g. cyclones, earthquakes, policy changes that evoke a massive response from the economy) may have affected the population and what the recovery process might look like.
Course – Markets Assessment and Analysis Lesson 2 – Assessing Markets
Learners’ Notes 16
2. Market and Food Security Disaster Assessment
In the best case scenario, a disaster assessment will take place where market baseline or profile already exists and a food security monitoring system is in place.
In this case, the response to a rapid onset disaster could initially focus on verification of the early warning systems, situation analysis and assumptions, impact and forecasting the recovery rather than having to piece together and build the basic knowledge about the market system.
In the case of a slow onset disaster, a market assessment looks very much like the early warning situation.
The following tools can be helpful for emergency assessments:
See Annex 9: Typical Emergency Impact Questions
and Annex 10: Sample Trader Survey Outline for Disasters
See also: MSU (2006). “Market Profiles and Emergency Needs Assessments: A Summary of Methodological Challenges.” Rome, WFP/SENAC (VII. Annex Table 1)
Typical Market Monitoring and Early Warning Questions
documents.wfp.org/stellent/groups/public/documents/ena/wfp095655.pdf
3. Market Assessment of Recovery Programs
Markets are an integral part of many recovery programs.
Road reconstruction activities following rapid onset or complex emergencies serve as a primary source of employment and the improvement in roads facilitates the inflow of productive inputs, food and other basic goods as well as the output of commodities.
See Annex 11: Typical Market Recovery - Development for Food Security Questions
The following checklist provides guidance on how to select market-based activities that are appropriate for poor and food insecure households that are either chronically food insecure or in the process of recovering from an emergency.
Checklist
• Is there a longer term potential for growth?
• Does this include some element of risk management? • Is the allocation of labour flexible?
• Are start-up costs very low?
• Are the poor facing many buyers and sellers in undertaking this activity? • Is the activity sustainable without external support?
• Does the policy and regulatory environment support participation of the poor?
• Do critical services (e.g., credit) reach the poor? • What is the distribution of benefits?
Course – Markets Assessment and Analysis Lesson 2 – Assessing Markets
Markets and response design
Markets are an important aspect of the response options to food insecurity. Markets:
• fine tune the determination of unsatisfied needs in terms of magnitude, location and time frame;
• condition the type and extent of humanitarian response;
• provide opportunity for earlier response through market related policies; • reduce the need for humanitarian response;
• reduce dependence on donors when the private sector is engaged in the response; and
• help to rebuild shattered/destroyed economies in post emergencies.
See: MSU (2006). “Market Profiles and Emergency Needs Assessments: A Summary of Methodological Challenges.” Rome, WFP/SENAC (X. Annex Table 4)
documents.wfp.org/stellent/groups/public/documents/ena/wfp095655.pdf
In the last several years, many humanitarian agencies have begun to use cash-based responses to address emergency needs following a rapid onset disaster. Such an approach has also been used in regions of chronic food insecurity (e.g. Turkana, Kenya). An important consideration in the choice between a cash or food response is what will be the affect on local markets and ultimately food security.
In general, to avoid negative impacts resulting from cash or food aid interventions, a proper market assessment prior to project implementation is needed.
See Annex 12: Typical Markets Questions for Cash vs Food Response Choices
Course – Markets Assessment and Analysis Lesson 2 – Assessing Markets
Learners’ Notes 18
Summary
A market assessment should be designed to answer a specific set of questions and objectives.
Demand and supply and the market system should be assessed.
The assessment should be focused on markets and market performance as they relate to food security.
Typical types of market assessments include:
• Market food security monitoring and early warning • Markets and food security disaster assessment • Market assessment of recovery programs
Course – Markets Assessment and Analysis Lesson 2 – Assessing Markets
If you want to know more
Online resourcesMSU (2006). “Market Profiles and Emergency Needs Assessments: A Summary of Methodological Challenges.” Rome, WFP/SENAC
(http://documents.wfp.org/stellent/groups/public/documents/ena/wfp095655.pdf)
Additional reading
MSU (2007). “Market Profiles and Emergency Needs Assessments: A Summary of Methodological Challenges.” Rome, WFP/SENAC.
Nyberg, Jennifer (2005) “Pakistan: Market Assessment in Earthquake Affected Areas.” Rome, WFP
Dorosh, Paul (2003) “Market Considerations in Emergency Needs Assessments.” Winahyu, R and R Acaye (2005) “Food Aid