Using Regression Analysis to Identify Patterns
of Non-Technical Losses on Power Utilities
Iñigo Monedero1, Félix Biscarri1, Carlos León1, Juan I. Guerrero1, Jesús Biscarri2, and Rocío Millán2
1
Department of Electronic Technology, University of Seville, C/ Virgen de Africa, 7, 41011 Sevilla, Spain
2
Endesa, Avda. Borbolla S/N, 41092 Seville, Spain
Abstract. A non-technical loss (NTL) is defined as any consumed energy or service which is not billed because of measurement equipment failure or ill-intentioned and fraudulent manipulation of said equipment. This paper de-scribes new advances that we have developed for Midas project. This project is being developed in the Electronic Technology Department of the University of Seville and its aim is to detect non-technical losses in the database of the Endesa Company. The main symptom of a NTL in a customer is an important drop in his billed energy. Thus, a main task for us is to detect customers with anomalous drops in their consumed energy. Concretely, in the paper we present two new algorithms based on a regression analysis in order to detect two types of patterns of decreasing consumption typical in customers with NTLs.
Keywords: Non-technical loss, power utility, data mining, regression analysis, Pearson correlation coefficient.
1 Introduction
A non-technical loss (NTL) is defined as any consumed energy or service which is not billed because of measurement equipment failure or ill-intentioned and fraudulent manipulation of said equipment. Although in the literature there are many works and researches [1-10], however there is not too much research about NTL detection in power utilities [11-16] although as we have said and it is verified the NTLs are very extended in this field. Thus, current methodology work by the electrical companies in the detection of NTLs is basically of two kinds. The first one is based on making in-situ inspections of some users (chosen after a consumption study) from a previously chosen zone. The second one is based on the study of the users which have null con-sumption during a certain period. The main problem of the first alternative is the need for a large number of inspectors and, therefore, a high cost. The problem with the second option is the impossibility of detecting users with non-null consumption (these are only the clearest cases of non-technical losses). Nowadays, data mining tech-niques [17-18] are being applied to multiple fields and detection of NTLs is one field in which it has met with success recently [19-22]. This paper describes new advances in the data mining process included on a proto-type for NTL detections from the databases of the Endesa Company. The work is
within the framework of MIDAS project which we are developing at the Electronic Technology Department of the University of Seville with the funding of the electrical company.
We have presented results in MIDAS project using a detection process based on extraction rules and clustering techniques [23-24]. We are currently working on an additional line in order to detect other type of NTLs. The aim of this new line is the identification of patterns of drastic drop of consumption. It is because we know that the main symptom of a NTL is a drop in the billed energy of the customers.
Our algorithms are based on a regression analysis on the evolution of the consump-tion of the customer. The aim is to search strong correlaconsump-tion between the time (in monthly periods) and the consumption of the customer. The regression analysis makes it possible to adjust the consumption pattern of the customer by means a line with a slope. This slope must be indicative of the speed of the drop of the consump-tion and, therefore, the degree of correlaconsump-tion. Although the concept is quite simple we have developed this idea and we have reached two more-complex algorithms which make it possible to identify with a high grade of accuracy two type of suspicious (and typically corresponding to NTL) drops. The algorithms were programmed with SPSS Clementine (in version 11) [23-24].
2 Selection of Customers for the Analysis
For the development and tests of the algorithms we selected a sample set made by customers with rate 3.0.2 and 4.0. These types of rates are basically assigned by the Endesa Company to identify the enterprises whose contracted power is greater than 15 KW. Besides, concretely inside this set, we used those customers with a very high contracted power (>40 KW). We chose 40 KW as lower limit in order to reach a total number of customers manageable for an analysis in detail and, at the same time, with the highest expected consumptions (and therefore to get in this way that each detected NTL supposed large among of recovered energy). This sample set was reached for the most important region of the Endesa Company: Catalonia (our objective in the future, once completed the validation of the algorithms with this region, will be to apply to all the regions of the Endesa Company as well as the remaining rates).
We configured an analysis period of 2 years which were a time enough to see a sufficiently detailed evolution of the consumption of the customer and, on the other hand, not too long to register along the contract the possible changes of type of busi-ness or the changes in the consumption habits of the client. With these customers we generated a table from which included condensed all the information of consumption and type of contract for each customer: reading values of the measurements equip-ment, bills from the last 2 years, amount of power contracted and the type of customer (private client or the kind of business of the contract), address, type of rate, etc. Thus, with this information in our study we could access to the type of customer as well as the evolution of its consumption in the last two years.
An interesting point of the pre-processing was the one concerning the reading val-ues of the measurement equipment. Normally, the consumption billed is the result of consumption read, but this is not always true. If the company has no access to the data, and there is no doubt consumption has been made, the company experts estimate
the actual consumption, based on the recent historic. Severe and continuous differ-ences between read data and billed data show abnormal behavior. In this sense, a filling up of missing values is performed.
Additionally to the previous selection we carried out a filtering of those customers with:
- Very low consumption (1000 KWs in the two years). This filter was carried out because the study of the consumption pattern of these customers is very limited and, besides, these customers are detected in the inspections of the company.
- Less number of reading values from the measurements equipment (under 10 from the 24 months of the analysis). We filtered those customers because our algorithms would be based on the consumption pattern of each customer and it was very difficult to study with less reading values. Besides, these customers with few reading values were not our objective because the Endesa Company has got its own methods in order to have identified them and to carry out the alerts to its inspectors if it is necessary.
- Without some reading value in the four last months. It was important that the customer had some reading value in these four months because it was neces-sary in order to carry out a precise process of the previously-described filling up of the reading values (since without final reading values it was not possible to adjust intermediate values).
Once carried out the selection and filtering of the sample set we had with a set of 24771 customers for our analysis.
3 Algorithm Based on Regression Analysis
As we mentioned previously, an evident symptom of an anomalous consumption of the customer and for the detection of NTLs in the customers is a drastic drop of their consumption. These drops can be due to a real slope of the consumptions of the cus-tomers (e.g. due to a change of type of contract or by a different use of the consumed energy). But, in turn, these slopes can be due to failures in the measurement equip-ment or voluntary alterations of this equipequip-ment (both cases generates NTLs to the company and therefore loss of money for it).
On the other hand and as it is known, correlation and regression analysis are statis-tical tools for the investigation of relationships among the evolutions of different variables. Usually, the investigator seeks to ascertain the causal effect of one variable upon another (in our case consumption upon time). The goal of regression analysis is to determine the values of parameters for a function that cause the function to best fit a set of data observations that you provide (and therefore, at the same, to reach a de-gree of correlation). In linear regression, the function is a linear (straight-line) equa-tion. For example, if we assume the value of an automobile decreases by a constant amount each year after its purchase, and for each mile it is driven.
We developed two complementary algorithms based on a linear regression analysis of the consumption pattern. Our objective was, on the one hand, the detection of those customers with dependence between consumption and time, and on the other hand, if this dependence was with decreasing consumption.
The first algorithm was based on the Pearson correlation coefficient, and the sec-ond one was based on a windowed regression analysis of the two years of consump-tion of each customer.
3.1 Algorithm Based on the Pearson Correlation Coefficient
In statistics, the Pearson correlation coefficient (r) [25-26] is a measure of how well a linear equation describes the relation between two variables X and Y measured on the same object or organism.
The result of the calculus of this coefficient is a numeric value from -1 to 1. A value of 1 shows that a linear equation describes the relationship perfectly and posi-tively, with all data points lying on the same line and with Y increasing with X. A score of -1 shows that all data points lie on a single line but that Y increases as X decreases. At last, a value of 0 shows that a linear model is inappropriate – that there is no linear relationship between the variables.
Our objective with this first algorithm was to identify those customers with impor-tant continuous drop in their consumption and, therefore, whose pattern of drop was very close-fitting to a linear equation. Thus, with this objective we identified and studied those customers with a Pearson coefficient near to -1.
The Pearson coefficient (r) is calculated by means the following equation:
(1) Where Cov(X,Y) is the covariance between X and Y. SXSY is the product of the stan-dard deviations for X and Y.
Thus, the result of this coefficient is interpreted as follows:
Perfect negative correlationStrong negative correlation Moderate negative correlation Weak negative correlation Weak positive correlation Moderate positive correlation Strong positive correlation Perfect positive correlation
Fig. 1. Interpretation of the Pearson correlation coefficient
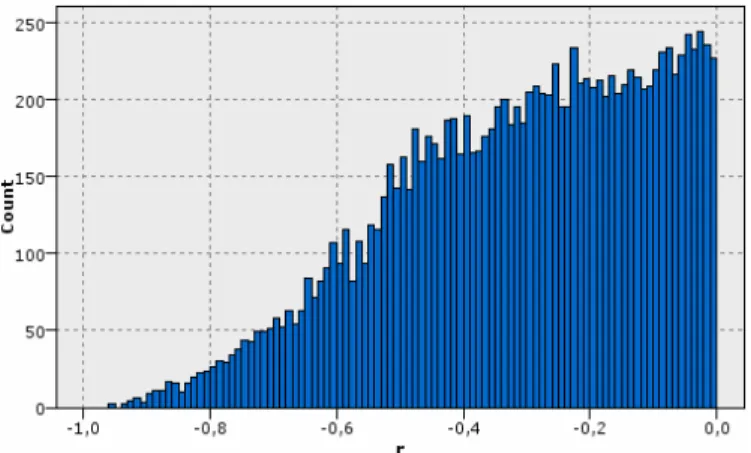
We applied this coefficient to the sample set, sorting the table by increasing Pear-son coefficient and we obtained surprising results. We could observe many customers with strong (and some ones almost perfect) negative correlation. Thus, we could count 331 customers with r below -0.75 (the resultant histogram for negative values of r is showed in figure 2).
In figure 3 it is showed the scaled consumption of four customers with strong nega-tive correlation. All the customers with strong correlation were suspicious of having some type of NTL (because is very strange a drop in consumption so pronounced and
Fig. 2. Histogram for negative values of r in the sample set
Fig. 3. Examples of customers with strong negative correlation
continuous in time) and they were proposed to be inspected in-situ by the inspectors of the Endesa Company (the results are remarked in paragraph 4 of the paper).
Thus, with this first algorithm we could detect with a high grade of accuracy those cus-tomers with a continuous drop in their consumption. The issue was that also were interest-ing those customers that their consumption was steadied with low values after fallinterest-ing. This last type of customers could not be detected with this algorithm. Thus, we developed a complementary method to this first algorithm based on a windowed algorithm.
3.2 Algorithm Based on a Windowed Linear Regression Analysis
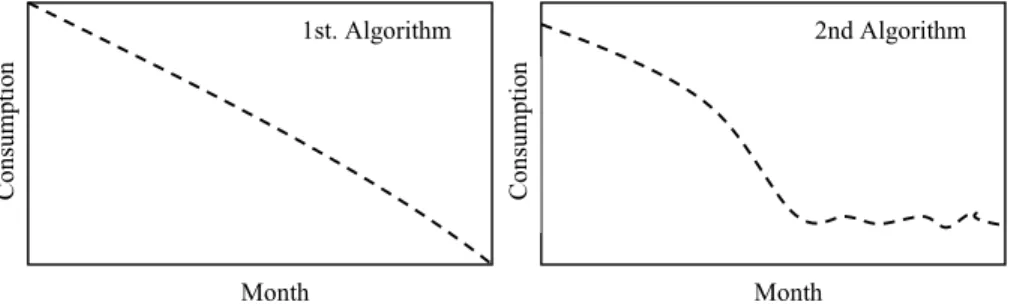
The objective of this algorithm was to detect customers that their consumption was steadied with low values after falling and therefore with the consumption pattern of figure 4. It is important to emphasize that we were looking for customers with low consumption in the last months (but it was not interesting the customers which have got null-consumption in these months due to that they are already detected by the Endesa Company in its internal inspections).
Month Con sump tio n Month Con sump tio n 1st. Algorithm 2nd Algorithm
Fig. 4. Consumption patterns searched with first and second algorithm
In order to get our objective we designed an algorithm by means the analysis of the consumption of the customer in two windows (each window with the half of the con-sumption values of the customer). For the first window we used the Pearson correla-tion coefficient (searching for values near to -1). On the other hand, for the second window we used a linear regression analysis [26] in which we searched for slopes near to 0 and non-zero offsets for this line. Thus, the Pearson coefficient for the first window (the 12 first consumption values) was calculated with the equation (1). While the values of the linear regression analysis for the second window (corresponding to the 12 last consumption values) were calculated in this way:
(2) Once calculated these values, we applied the following rule in order to extract those customers with a pattern similar to figure 4:
Abs(β_w2)<30 and Average_w2<(Maximum/5) and
Average_w2>(Maximum/100) and R_w1 < -0.5 (3) Where Abs(β_w2) is the absolute value of β for the second window (we took the abso-lute values in order to identify in this second window those customers without slope in their consumption or very low –positive or negative-), Average_w2 is the average of the consumption for the second window, Maximum is the value maximum of the reading values of the customer, and R_w1 is the Pearson coefficient for the first window. The meaning of this rule implies an important drop in the first year and a stabilization of the consumption with low values (but not null) with respect to the total consumption of the customer.
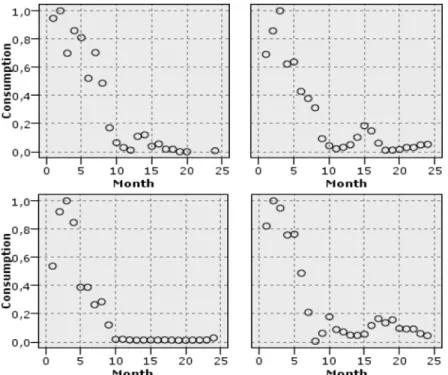
Applying this rule on our sample set we obtained 81 customers. Through a display of their consumption, we could verify that these clients had the pattern of Figure 4. In Figure 5 we can observe the patterns for four customers of these 81.
Fig. 5. Examples of customers detected with second algorithm
4 Results and Conclusions
NTL is an important issue in power utilities because it has a high impact on company profits. Despite this, nowadays the methodology of detection of NTL of the compa-nies is not very advanced as these compacompa-nies used detection methods that do not ex-ploit the use of data mining techniques. We have developed methods to detect NTLs and we have tested them on a real database supplied by the Endesa Company.
Concretely, in this paper we have presented a line of work based on the detection of consumption drops by means of two algorithms which use regression analysis. Thus, we obtained a list of customers with evident and suspicious drops of consump-tion. We selected a sample of the 80 more representative customers (40 customers with each one of the two algorithms) who had clearer drop in the consumption. These cases could be due to a drop of electrical demand for their business but never due to a low contract because in that case they would have reading information in their equip-ment. Therefore, it was interesting as additional information to study the type of busi-ness of these suspicious customers in order to know if it was a busibusi-ness in which the demand is currently falling (e.g., currently, the construction business in Spain). Thus,
we studied the business information for each customer in order to be able to control this fact and to avoid unnecessary inspections. It is known by the inspectors of the Company that the following types of business are more likely to have consumption drops innate to their use of the energy (and not due to possible NTL): wells, lightings, irrigation pumps, water purification and construction (previously mentioned). So, from the 80 detected customers, we filtered those with these types of contracts and we obtained a definitive list of 62.
Currently, the Endesa Company is carrying out inspections with a set of customers from the ones who were detected by our methods. Up to now, with the results ob-tained in the inspections, we have reached an around 38% of success. The total These results are considered very satisfactory taking into account, first, the rate of success of the Company in its routine inspections (less than 10%) and, second, the less input information used in our algorithms (basically the evolution of the consumption of the customer).
To date, the total energy recovered with our prototype stands at about 2 millions of kWh, which implies a large amount of money saved for the Endesa Company. This is allowing us to continue working with guaranties in our project. Thus, in order to im-prove the filtering process previous to the in-situ inspections, we are currently work-ing on an expert system that takes as input all this information from the database and carries out the task of hand analysis. It is to complete our detections with more infor-mation that can be determining the decision to inspect in situ that customer (as for example the type of business, the stationary consumption in some types of business or even the location of the customer).
Acknowledgements
The authors would like to thank the Endesa Company and Sadiel Company for pro-viding the funds for this project (since 2005). The authors are also indebted to the following colleagues for their valuable assistance in the project: Gema Tejedor, Fran-cisco Godoy and Joaquín Mejías. Special thanks to Jesús Macías, Eduardo Ruizbérriz, Juan Ignacio Cuesta, Tomás Blazquez and Jesús Ochoa for their help and cooperation.
References
1. Wheeler, R., Aitken, S.: Multiple algorithms for fraud detection. Knowledge based sys-tems (13), 93–99 (2000)
2. Kou, Y., Lu, C.-T., Sinvongwattana, S., Huang, Y.-P.: Survey of fraud detection tech-niques. In: Proceeding of the 2004 IEEE International Conference on Networking, Sensing and Control, Taiwan, March 21, pp. 89–95. IEEE press, Los Alamitos (2004)
3. Fawcett, T., Provost, F.: Adaptative fraud detection. Data mining and Knowledge Discov-ery 1, 291–316 (1997)
4. Art´ıs, M., Ayuso, M., Guillén, M.: Modeling different types of automobile insurance frauds behavior in the spanish market. In: Insurance Mathematics and Economics, vol. 24, pp. 67–81. Elsevier Press, Amsterdam (1999)
5. Daskalaki, S., Kopanas, I., Goudara, M., Avouris, N.: Data mining for decision support on customer insolvency in the telecommunication business. European Journal of Operational Research 145, 239–255 (2003)
6. Brause, R., Langsdorf, T., Hepp, M.: Neural data mining for credit card fraud detection. In: Proceeding 11th IEEE International Conference on Tools with Artificial Intelligence. IEEE press, Los Alamitos (1999)
7. Kirkos, E., Spathis, C., Manolopoulos, Y.: Data mining techniques for the detection of fraudulent financial statements. Expert Systems with Applications 32, 995–1003 (2007)
8. Burge, P., Shawe-Taylor, J.: Detecting cellular fraud using adaptative prototypes. In: Pro-ceeding on AI Approaches to Fraud Detection and Risk Management, pp. 9–13. AAAI Press, Menlo Park (1997)
9. Cabral, J., Pinto, J., Linares, K., Pinto, A.: Methodology for fraud detection using rough sets. In: 2006 IEEE International Conference on Granular Computing. IEEE press, Los Alamitos (2006)
10. Denning, D.: An intrusion-detection model. IEEE transactions on Software Engineer-ing 13, 222–232 (1987)
11. Yap, K.S., Hussien, Z., Mohamad, A.: Abnormalities and fraud electric meter detection us-ing hybrid support vector machine and genetic algorithm. In: Proceedus-ing of the Third IASTED International Conference Advances in Computer Science and Technology, Phuket, Thailand, April 2-4, Iasted Press (2007)
12. Filho, J., als: Fraud identification in electricity company customers using decision tree. In: IEEE International Conference on Systems, Man and Cibernetics, IEEE/PES, The Hague (2004)
13. Cabral, J., Pinto, J., Gontijo, E.M., Reis, J.: Fraud detection in electrical energy consumers using rough sets. In: 2004 IEEE International Conference on Systems, Man and Cybernet-ics. IEEE press, Los Alamitos (2004)
14. Cabral, J., Pinto, J., Martins, E., Pinto, A.: Fraud detection in high voltage electricity con-sumers using data mining. In: IEEE Transmission and Distribution Conference and Expo-sition T&D, April 21-24, IEEE/PES (2008)
15. Sforna, M.: Data mining in power company customer database. In: Electric Power Systems Research, vol. 55, pp. 201–209. Elsevier Press, England (2000)
16. Jiang, R., Tagiris, H., Lachsz, A., Jeffrey, M.: Wavelet based features extraction and mul-tiple classifiers for electricity fraud detection. In: Transmission and Distribution Confer-ence and Exhibition 2002: Asia pacific, October 6-10. IEEE/PES (2002)
17. Kantardzic, M.: Data mining: concepts, models methods and algorithms, 1st edn. AAAI/MIT Press (1991)
18. Witthen, I., Frank, E.: Data Mining–Practical Machine Learning Tools and Techniques with Java Implementations. Morgan Kaufmann/Academic Press, New York/San Mateo (2000)
19. Editorial, Recent advances in data mining. Engineering applications of Artificial Intelli-gence 19, 361–362 (2006)
20. McCarthy, J.: Phenomenal data mining. Communications of the ACM 43(8), 75–79 (2000) 21. Ramos, S., Vale, Z.: Data mining techniques application in power distribution utilities. In: IEEE Transmision and Distribution Conference and Exposition T&D, April 21-24, IEEE/PES (2008)
22. Nizar, A., Dong, Z., Zhao, J.: Load profiling and data mining techniques in electricity de-regukated market. In: Power Engineering Society General Meeting, June 18-22. IEEE/PES (2006)
23. Biscarri, F., Monedero, I., León, C., Guerrero, J.I., Biscarri, J., Millán, R.: A data mining method based on the variability of the customers consumption. In: 10th Int. Conf. on En-terp. Inf. Systs., ICEIS 2008, Barcelona, Spain, June 12-16 (2008)
24. Biscarri, F., Monedero, I., León, C., Guerrero, J.I., Biscarri, J., Millán, R.: A mining Framework to detect non-technical losses in power utilities. In: 11th Int. Conf. on Enterp. Inf. Systs., ICEIS 2009, Milano, Italy, May 6-10 (2009)
25. Pearson, K.: Mathematical contributions to the theory of evolution.—III. Regression, he-redity and panmixia. Philos. Trans. R. Soc. London, ser. A 187, 253–318 (1896)