Original article:
TESTING CHEMICAL CARCINOGENICITY BY USING
A TRANSCRIPTOMICS HEPARG-BASED MODEL?
Tatyana Y. Doktorova*1‡, Reha Yildirimman*2, Liesbeth Ceelen3, Mireia Vilardell2, Tamara Vanhaecke1, Mathieu Vinken1, Gamze Ates1, Anja Heymans1, Hans Gmuender4, Roque Bort5,6, Raffaella Corvi7, Pascal Phrakonkham7, Ruoya Li8, Nicolas Mouchet9, Christophe Chesne8, Joost van Delft10, Jos Kleinjans10, Jose Castell5,6, Ralf Herwig2**, Vera Rogiers1**
1
Department of Toxicology, Center for Pharmaceutical Research, Vrije Universiteit Brussel, 1090, Brussels, Belgium
2
Max Planck Institute for Molecular Genetics, Department Vertebrate Genomics, D-14195 Berlin, Germany
3
Pathlicon, 9940, Evergem, Belgium
4
Genedata AG, 4053, Basel, Switzerland
5
Unit of Experimental Hepathology, University Hospital La Fe Valencia, Spain
6
University of Valencia, Faculty of Medicine, Department of Biochemistry and Molecular Biology, E-46009, Valencia, Spain
7
European Union Reference Laboratory for Alternatives to Animal Testing (EURL ECVAM), Systems Toxicology Unit,21027, Ispra, Italy
8
Biopredic International, 35000, Rennes, France
9
Institut Génétique et Développement de Rennes, 6290, Rennes, France
10
Department of Toxicogenomics, Maastricht University, 6229 ER, Maastricht, The Netherlands
Equally contributed as *first and **last authors.
‡ Corresponding author: T. Y. Doktorova, Vrije Universiteit Brussel, Department of Toxicology, Center for Pharmaceutical Research, Laarbeeklaan 103, B-1090, Brussels, Belgium; Tel: +3224774507; Fax: +3224774582; E-mail: [email protected].
ABSTRACT
The EU FP6 project carcinoGENOMICS explored the combination of toxicogenomics and in vitro cell culture models for identifying organotypical genotoxic- and non-genotoxic carcino-gen-specific gene signatures. Here the performance of its gene classifier, derived from expo-sure of metabolically competent human HepaRG cells to prototypical non-carcinogens (10 compounds) and hepatocarcinogens (20 compounds), is reported. Analysis of the data at the gene and the pathway level by using independent biostatistical approaches showed a distinct separation of genotoxic from non-genotoxic hepatocarcinogens and non-carcinogens (up to 88 % correct prediction). The most characteristic pathway responding to genotoxic exposure was DNA damage. Interlaboratory reproducibility was assessed by blindly testing of three compounds, from the set of 30 compounds, by three independent laboratories. Subsequent classification of these compounds resulted in correct prediction of the genotoxicants. As ex-pected, results on the non-genotoxic carcinogens and the non-carcinogens were less predic-tive. In conclusion, the combination of transcriptomics with the HepaRG in vitro cell model provides a potential weight of evidence approach for the evaluation of the genotoxic potential of chemical substances.
Keywords: genotoxic carcinogens, non-genotoxic carcinogens, gene expression profiling, pathways-based analysis, HepaRG cell line, liver-based in vitro models
INTRODUCTION
Exposure to potential human carcinogens and possible subsequent occurrence of can-cer is of major concan-cern for the safety of man and his environment. For decades, the 2-year rodent carcinogenicity assay has been the ul-timate model for evaluating the carcinogenic potential of substances (EU, 1988). In gen-eral, this test is indicated by positive results obtained in an in vitro screening battery, usually followed by subsequent positive in vivo follow-up genotoxicity tests. The 2-year carcinogenicity assay, however, has several scientific drawbacks as the tested doses are unrealistically high and important interspe-cies differences exist, thus questioning hu-man relevance of data obtained. Indeed, a substantial number of false positive results (i.e. identified as carcinogens in the rodent cancer bioassay but actually proven non-carcinogens for humans) are generated (Ennever et al., 1987; Gold and Slone, 1993). Furthermore, ethical and economic obstacles relate to the use of large numbers of animals, high doses and long duration times, and large costs (Ferdowsian and Beck, 2011; Doktorova et al., 2012). Furthermore, regulatory requirements for in vivo testing of various compounds differ substantially worldwide. In Europe, for example, in vivo
testing of cosmetic products and their ingre-dients is prohibited because of the imple-mentation in Directive 76/768/EC of strict testing and marketing bans. Both have been taken over in the actual cosmetic Regulation 1223/2009 (EU, 2009). Exemptions can only be claimed when the tested compound is equally in use in other consumer and indus-trial products for which animal testing may be necessary to ensure compliance with the legal frameworks applicable to these prod-ucts (EC, 2013) e.g. cosmetic products are generally also subject to the horizontal REACH (Registration, Evaluation, Authori-zation and restriction of Chemicals)
re-quirements, which impose testing of a large amount of chemicals. Although only for high production volume chemicals carcinogenici-ty testing is required, and this still will in-volve a large number of animals (SCCP, 2006). Therefore, the development of as-says/strategies able to identify carcinogens in a shorter timeframe, at a lower cost and pref-erably not using animals presents a huge challenge. Different approaches have been proposed, among which the use of genetical-ly modified animals, the incorporation of histopathological data derived from repeat-ed-dose toxicity studies, and toxicogenomics as an endpoint combined with in vivo treat-ment or in vitro cell culture exposure (Bercu et al., 2010; Doktorova et al., 2012; Magkoufopoulou et al., 2012). A toxicoge-nomics approach allows investigation of the entire genome response to toxicant effects and is an acknowledged strategy for discov-ering the mode of action of compounds and for identifying potential biomarkers of expo-sure and toxicity. It also allows to quantify and validate biomarker signatures (Bercu et al., 2010; Van Hummelen and Sasaki, 2010; Waters et al., 2010).
In this respect, the recently ended EU framework 6 project, carcinoGENOMICS (www.carcinogenomics.eu), had as final goal the development of an organ-specific battery of mechanism-based in vitro tests, account-ing for various modes of carcinogenic action, using "omics" technologies coupled with in vitro cell systems from rat and human origin (Vinken et al., 2008). The project was con-veyed in two phases and during the first one (Phase I) the best performing liver-, kidney- and lung-derived in vitro models were se-lected mostly based on "omics" responses generated from a well-defined set of 15 model compounds causing genotoxicity and carcinogenicity (Doktorova et al., 2013) (Ta-ble 1). The choice of the compounds was based on several strict criteria including
di-versity and selectivity, biochemical and bio-physical properties, and availability of toxi-cological information (Vinken et al., 2008). With regard to the liver-based in vitro mod-els, which were used to evaluate the 15 pro-totypical compounds, the human hepatoma cell line HepaRG generated the best per-forming gene classifier, differentiating DNA-reactive from DNA non-reactive mechanisms (Doktorova et al., 2013). In the second phase of the project (Phase II), an ad-ditional number of 15 carefully selected compounds (thus resulting in a total of 30 analyzed compounds, shown in Table 1) were tested using HepaRG cells. The chemi-cal selection for the second phase of the pro-ject was mostly focused on human relevance,
e.g. whether the compounds are known hu-man carcinogens. The global study results are reported here, including the classification performance and assessment of the interla-boratory reproducibility in three independent laboratories of three blindly tested com-pounds: as a prototypical genotoxic (GTX) carcinogen Benzo(a)pyrene was used, as a non-genotoxic (NGTX) carcinogen Tetra-decanoyl phorbol acetate and as a non-carcinogen (NC) Clonidine hydrochloride were used, respectively.
MATERIALS AND METHODS
Compounds, cell culture and treatment For the in vitro experiments which were aiming at enrichment of the classifier, human hepatoma-derived HepaRG cells (Biopredic International, France) were cultivated as pre-viously described (Gripon et al., 2002; Guillouzo et al., 2007). At day 13 of cultiva-tion, dimethylsulfoxide (DMSO)-containing medium was added for 7 days (Gripon et al., 2002). At day 19, using the same study con-ditions as applied during the first phase of the project (Doktorova et al., 2013), the cells were exposed for 72 h to the second set of 15 prototypical compounds chosen during the second phase of the project, i.e. 5 GTX (N-nitrosomorpholine, NMP; Hydroquinone, HQO; Hydrazine dihydrochloride, HHC;
2-acetylaminofluorene, TAF; 2-amino-3-methylimidazo(4,5-f)quinoline, AMQ), 5 NGTX (Fumonisin B1, FMB; Cyclosporine A, CsA; Acetamide, ACE; Diethylhexyl Phthalate, DHP; Ethanol, ETH), 5 NC (4-acetylaminofluorene, FAF; D,L-Menthol, DLM; Benzoin, BEN; Benzyl Alcohol, BEA; Triclosan, TRI). IC10 concentrations (reducing cell viability by 10 %) were de-termined by a 3-(4,5-dimethylthiazol-2-yl)-2,5-diphenyltetrazolium bromide test (MTT test) (see Table 1) (number of replicates n = 3) (Mosmann, 1983) following 72 h in-cubation with the selected chemicals. Further exposure to the IC10 concentrations was ini-tiated and RNA samples were collected at 24 h and 72 h. Technical and experimental specifications are presented in Table 1.
For the interlaboratory reproducibility study coordinated by the European Union Reference Laboratory for Alternatives to An-imal Testing (EURL ECVAM), three com-pounds from the Phase I list of chemicals were blindly labelled as D (Benzo(a)pyrene), E (Clonidine hydrochloride), F (Tetradeca-noyl phorbol acetate) (EURL ECVAM), dis-tributed (Maastricht University) and inde-pendently tested in three laboratories (Vrije Universiteit Brussel (VUB), Belgium; Uni-versity Hospital of Valencia (HUL), Spain; Biopredic International (BPI), France). Each laboratory had to determine the IC10 con-centrations by a MTT test and to expose at the selected doses for 24 h or 72 h. The ex-periments were executed according to a standard operating procedure distributed to the participating laboratories prior to the start of the experiments. The laboratories in-volved also attended an experimental train-ing session organized by the Consortium. Maastricht University generated all microar-ray data and Genedata and Max Plank Insti-tute performed all the data analyses. Tech-nical and experimental specifications for the interlaboratory study are present in Table 2.
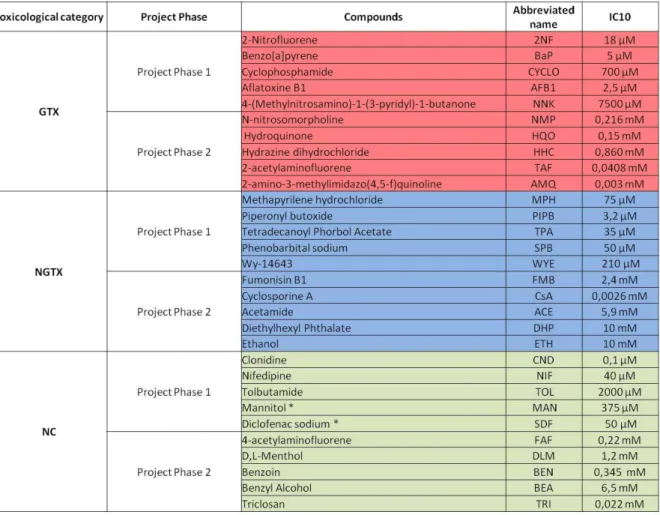
Table 1: IC10 concentrations of the 30 compounds (10 GTX, 10 NGTX and 10 NC) used in both phases of the carcinoGENOMICS project. The compounds were either dissolved in DMSO with 0.5 % v/v final concentration in the medium or in phosphate-buffered saline (*). The experiments were per-formed in triplicate.
Table 2: IC10 concentrations of 3 blindly tested compounds (D, E, F) obtained by 3 different laborato-ries. The compounds were dissolved in DMSO with 0.5 % v/v final concentration. The experiments were performed in triplicate. (BPI, Biopredic International; HUL, University Hospital of Valencia; VUB, Vrije Universiteit Brussel)
Total RNA isolation
Cell samples for RNA isolation were col-lected by removing cell culture media and adding lysis buffer (QIAshredder kit, Qi-agen)(n = 3 for each compound). Total RNA extraction (RNA extraction kit, Qiagen), in-cluding a DNase digestion step, was done according to the manufacturer’s instructions. Quality control was carried out by gel analy-sis using RNA 6000 Nano chips on an Ag-ilent 2001 Bioanalyzer (RNA integrity num-ber (RIN) > 7).
Microarray data hybridization
Complementary RNA targets were pre-pared and hybridized according to the manu-facturer's procedures on high-density oligo-nucleotide microarrays (i.e. Affymetrix U133 Plus 2.0 GeneChip). They were washed and stained using an Affymetrix flu-idics station and subsequently scanned by means of an Affymetrix GeneArray scanner. Normalization quality controls, including scaling factors, average intensities, present calls, background intensities, noise and raw Q-values were within acceptable limits for all chips. Hybridization controls were identi-fied on all chips and yielded the expected in-creases in intensities.
Microarray data re-annotation and normalization
For the gene- and pathway-based anal-yses, the data of the 15 phase II compounds generated in this study were added to the previously obtained results of the 15 phase I chemicals. The raw microarray data were annotated to Ensembl version 61 genome and Gene Chip Robust Multi-array Average (GC-RMA) normalized. This resulted in 18,919 probe sets.
For classification analysis, the raw mi-croarray data were annotated using the chip description files from Affymetrix and GC-RMA normalized. In order to eliminate batch effects, data from the different studies were half-z normalized (adjusting logarithmic ex-pression values of transcripts within a group
in such a way that each transcript has a zero mean).
Microarray data analysis:
Enrichment of the existing gene classifier Gene as well as pathway level approach-es were used to evaluate the global perfor-mance of the gene classifier composed of the 30 compounds tested during phase I and phase II of the project. For analysis at the gene level, the relative ratios (treatment ver-sus control) were computed and a multivari-ate ANOVA analysis between the three groups (GTX carcinogens, NGTX carcino-gens and NC) was applied. Only the top dis-criminative genes between the three groups selected after applying a p-value cut-off (0.01 or 0.05) were further selected for anal-ysis. Hierarchical clustering analysis (HCA) (Euclidean Distance, Ward’s Linkage) was performed to visualize the discriminative ca-pacity of differentially expressed genes. Considering the direction of deregulation (i.e. up- or down-regulated), the genes were further assigned to biochemical and toxico-logical categories.
The second approach aimed at analyzing treatment-induced expression changes at the pathway level. First a response score (SiJ) for each gene “i” in each treatment “j” was cal-culated as described previously (Yildir-imman et al., 2011). Further p-values and fold changes were generated per gene “i” by comparing the average value of the intensity data of each treatment to the average of the respective control elements. These genes were further assigned to pathways using ConsensusPathDB (Kamburov et al., 2011; 2013). For the pathway response analysis, the response score for each pathway was de-fined as the average score derived from all Sij within a certain pathway “j”. In order to make the pathway response scores compara-ble across the experimental panel of com-pounds, relative pathway response (RPR) scores were calculated. This was done by di-viding the individual scores for each experi-ment by the median pathway response score of that experiment. To identify pathways
discriminative between GTX, NGTX and NC, a multivariate ANOVA analysis was performed and the p-value was set at 0.01. PCA and HCA were performed to visualize the discriminative capacity of the selected pathways.
Microarray data analysis: Classification analysis
The Analyst module from the Genedata Expressionist© system was used for super-vised classification analysis. Raw data from the Affymetrix arrays were assessed for quality and pre-processed using the Refiner Array module from the Genedata Expres-sionist© software package as follows. Defec-tive areas, gradient and distortions on the ar-rays were diagnosed and expression values for all probe sets were obtained by applying the Gene Chip Robust Multi-array Average (GC-RMA) condensing method to the arrays. The Analyst module from the Genedata Ex-pressionist© system was used for supervised classification analysis. A support vector ma-chine was used for assessing the perfor-mance of classification (Cristianini and Shawe-Taylor, 2000). For SVM a linear ker-nel was used, and the penalty factor was set to 10. The kernel defines how the scalar product between two data points is evaluat-ed, while the penalty factor determines how rigid the margin of the SVM classifier is. As a sampling method K-fold Cross Validation was used. For K-fold the number of folds was set to 10, and the number of repeats to 10. Categories for cross validation were GTX, NGTX and NC. Cross validation was performed using the GC-RMA and half-z normalized data.
Interlaboratory reproducibility and compound prediction
The interlaboratory reproducibility anal-ysis was based on the comparison of the ranking of fold-changes (treatment versus
control) per laboratory. Thus, the overlaps of the top 20, 50, 100, 200, 500, 1000, 2000, 5000, 10000, and 20000 ranked transcripts for each treatment/time group were
deter-mined. Random overlaps were determined as number of top ranked expression values di-vided by the number of transcripts on the microarray. Further, the area under the curve (AUC) for the top ranked transcripts (rang-ing from the 20th to the 5000th transcript) was estimated for all comparisons.
For the prediction of the three blinded compounds (D, E, F), two different kinds of data analysis were applied. The first ap-proach was based on using SVM as classifi-er. Classification of the three blinded com-pounds was performed with the top 5000 ranked transcripts of the reference compen-dium (i.e. gene classifier composed of the 30 compounds from phases I and II) using the three toxic categories (GTX, NGTX, NC). In the second approach, a multivariate ANOVA argument was used. The total of 30 com-pounds, combined from phase I and II, were assigned to three classes, namely GTX, NGTX and NC. Every blinded compound (D, E or F) was consecutively assigned to each of the 3 classes and an ANOVA test was performed. Further, the number of sig-nificantly deregulated genes was computed (p = 0.05). The blinded compounds were then assigned to the class with the largest number of significantly deregulated genes. A more detailed description of both bioinfor-matics approaches will be given in a separate manuscript (Herwig et al., in preparation).
RESULTS
Analysis at the gene and pathway level At the gene level, the results of the ANOVA analysis showed that after 24 h and 72 h of exposure, 440 genes and 353 genes (Figure 1), respectively, were significantly deregulated. Most GTX carcinogens were separated from the NGTX carcinogens and NC, irrespective of the time of exposure. A survey of the involved pathways, however, revealed more carcinogen-specific processes after 72 h of exposure in comparison to 24 h of exposure. Briefly, the most prominent changes after 72 h of exposure consisted of upregulation of genes involved in apoptosis, DNA-repair and DNA damage (Figure 1).
Also increased oxidative stress, intra- and in-tercellular transport and metabolism were demonstrated. Downregulated genes were mostly involved in cellular metabolism and xenobiotic biotransformation, probably flecting a dedifferentiation response as a re-sult of GTX exposure. In comparison, after 24 h of exposure, these downregulated genes were associated with amino acid, carbohy-drate and lipid metabolism, which may be in-terpreted as a dedifferentiation trigger, whereas the upregulated genes were involved in cell cycle progression, DNA replication, immunity and defense and oxidative stress. The latter may be explained as a cell cycle progression and general stress response. Af-ter 24 h of exposure, the DNA damage re-sponse appeared not yet activated.
Consequently for analysis at the pathway level, emphasis was laid on data generated from samples after 72h of exposure. The re-sults showed that all GTX grouped together as such providing a better discrimination of GTX from NGTX and NC in comparison
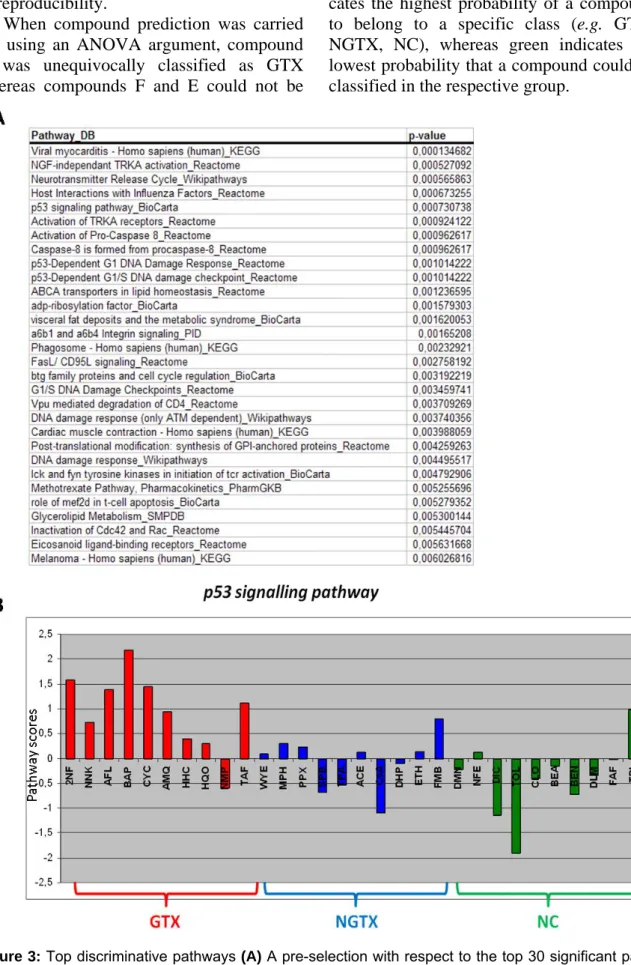
with the results obtained at the gene level (Figure 2). A pre-selection with respect to the top 30 significant pathways showed that p53-dependent DNA damage was among the most affected and differentially expressed processes (Figure 3 A). In Figure 3 B, modu-lation of the p53 signaling pathway by the 30 prototypical compounds is presented as an example of a discriminative pathway. Fur-ther, similar to the results at the gene level, at the pathway level no separation was pos-sible between NGTX carcinogens and NC. Classification analysis
After 72 h of exposure, the correct classi-fication rate was slightly higher than after 24 h of exposure (Figure 4). Inclusion of the second set of 15 compounds (the phase II compounds) decreased this percentage. Fi-nally, the lowest misclassification rate was observed when the data from both time-points were combined. The compounds most frequently wrongly classified, belonged to the NGTX and NC groups.
Figure 1: Hierarchical clustering analysis of (A) 440 genes and (B) the 353 genes following 24 and
72h of exposure that were significantly deregulated (False Discovery Rate ≤ 0.05) according to
Figure 2: (A) Principal component analysis and (B) hierarchical clustering analysis of the pathways
that were significantly deregulated (p ≤ 0.05) according to ANOVA analysis following 72 h of exposure.
The red dots are the genotoxic (GTX) carcinogens, the blue dots are the non-genotoxic (NGTX) car-cinogens and the green dots are the non-carcar-cinogens (NC).
Interlaboratory reproducibility and classification of the coded compounds
The last part of the analysis focused on the interlaboratory reproducibility among the three laboratories for the three blindly tested compounds (D, E and F) which were part of the original set of 30 compounds. The calcu-lations, using AUC for the top ranked tran-scripts, showed overall interlaboratory re-producible results (Figure 5). Compounds D and E generated reproducible results with
AUC values above 20 %. The outcome of compound F exposure, especially after 72 h of exposure, was less reproducible.
The compound prediction was further performed by using two approaches. In the first one, SVM was applied as algorithm and compound D was by the three laboratories unequivocally classified at all time-points as a GTX carcinogen (Figure 6). Compounds E and F were classified as either NGTX or NC. The response was uniform among the three
laboratories confirming a good interlaborato-ry reproducibility.
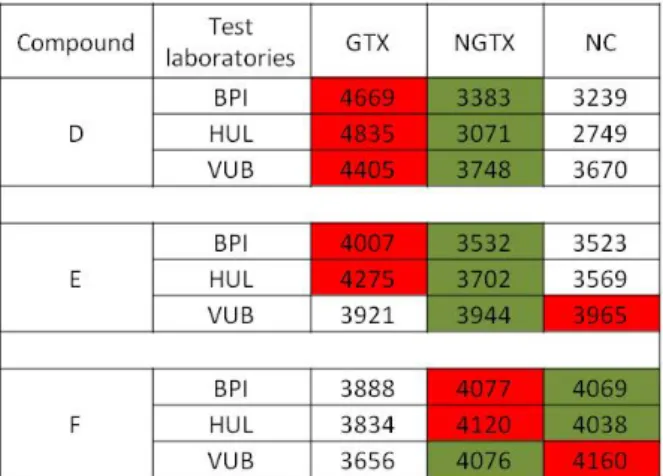
When compound prediction was carried out using an ANOVA argument, compound D was unequivocally classified as GTX whereas compounds F and E could not be
classified (Figure 7). In the figure red indi-cates the highest probability of a compound to belong to a specific class (e.g. GTX, NGTX, NC), whereas green indicates the lowest probability that a compound could be classified in the respective group.
Figure 3: Top discriminative pathways (A) A pre-selection with respect to the top 30 significant
Figure 4: Classification analysis -Percentages of correctly classified experiments following GC-RMA and half-z normalization are indicated. As an algorithm Support Vector Machine is used. The cross validation is performed with the samples generated after 24h and 72h of exposure, separately or pooled together. The compounds tested in phase I and II of the project are shown. The experiments were performed in triplicate. (IC10, inhibitory concentration 10 %)
Figure 5: Interlaboratory reproducibility - Results among three laboratories of three blindly tested compounds denoted as D, E and F using Area Under the Curve for the top ranked transcripts. Darker green indicates higher reproducibility of results among the compared laboratories. (BPI, Biopredic In-ternational; HUL, University Hospital of Valencia; VUB, Vrije Universiteit Brussel)
Figure 6: Interlaboratory reproducibility - The results obtained among three laboratories of three blind-ly tested compounds (denoted as D, E and F) using Support Vector Machine as algorithm, are pre-sented. Red indicates the highest probability of a compound to belong to a specific class (e.g. DMSO control, GTX, NGTX, NC), whereas green indicates the lowest probability that a compound could be classified in the respective group. The experiments were performed in triplicate. (BPI, Biopredic Inter-national; HUL, University Hospital of Valencia; VUB, Vrije Universiteit Brussel)
Figure 7: Interlaboratory reproducibility
Results among three laboratories of three blindly tested compounds denoted as D, E and F using ANOVA approach. Red indicates the highest probability of a compound to belong to a specific class (e.g. GTX, NGTX, NC), whereas green indicates the lowest probability that a compound could be classified in the respective group. The experiments were performed in triplicate. (BPI, Biopredic Inter-national; GTX, genotoxic, HUL, University Hospital of Valencia; NC, carcinogens; NGTX, non-genotoxic; VUB, Vrije Universiteit Brussel)
DISCUSSION
The ability of a chemical to induce can-cer is traditionally assessed by a 2-year ro-dent carcinogenicity assay. Although this as-say is far from ideal, for the time being it is the most commonly used model for human cancer risk assessment (EU, 2008). Ap-proaches to at least partially substitute the necessity for in vivo testing are ongoing and among the different strategies proposed, tox-icogenomics is a promising methodology (Benfenati et al., 2009; Bercu et al., 2010; Doktorova et al., 2012; Magkoufopoulou et al., 2012). Indeed, the combination of tran-scriptomics with short-term in vivo exposure has been proposed by several teams (El-linger-Ziegelbauer et al., 2005; Nakayama et al., 2006; Ellinger-Ziegelbauer et al., 2008; Fielden et al., 2008; Uehara et al., 2008; Matsumoto et al., 2009; Doktorova et al., 2011). Majorly involved discriminative pathways are DNA damage, cell cycle pro-gression, oxidative stress and detoxification response. Interpretation of transcriptomics data derived from in vitro exposurestudies is even more challenging.
In the current study, the performance of the gene classifier generated following
expo-sure of HepaRG cells to 30 prototypical GTX, NGTX carcinogens and NC was as-sessed. The choice of the in vitro model was based on a previously performed study (Phase I of the project) in which the HepaRG model was chosen among 5 commonly-used liver-based in vitro models as the system able to generate the best discriminative gene classifier (Doktorova et al., 2013). The re-sults shown here were generated to obtain a gene classifier based on a larger group of compounds as such covering more diverse mechanisms of action. After analyzing the global gene expression data of the 30 com-pounds by using several statistical approach-es including cross validation and classifica-tion analysis, a slightly higher misclassifica-tion rate in comparison to the initial test set was observed. This could be attributed to the fact that inclusion of additional compounds diversified the pool of involved mechanisms of action and might as such have lead to a slightly lower correct prediction rate. On the other hand, diversification usually contrib-utes to the generation of a more reliable gene classifier. Additionally, some difficulties as-sociated with the selection of appropriate test compounds should be acknowledged, espe-cially when human relevance is required.
In-terestingly, despite the slightly higher mis-classification rate, DNA damage remains the most characteristic pathway after exposure of the cells to GTX carcinogens. Indeed, the normal reaction of cells upon disruption of DNA integrity following chemical exposure consists of the activation of a number of downstream targets including tumor suppres-sor p53 and murine double minute 2 (Mdm2) (Lu, 2010; Oliver et al., 2011). Further, the effect is transferred onto a number of target genes involved in cell cycle, apoptosis, DNA repair and several others associated with the maintenance of normal cellular homeostasis and response to stimuli (Ellinger-Ziegelbauer et al., 2005; Ellinger-Ziegelbauer et al., 2008). Indeed these genes were found dereg-ulated following GTX insults by the majority of the selected compounds. This finding pro-vides an opportunity for developing in vitro
assays aimed at identifying genotoxicants in particular.
The second class of investigated chemi-cals consists of NGTX carcinogens. Unlike most GTX carcinogens, which directly or in-directly affect DNA, NGTX carcinogens do not bind to DNA, yet these substances can cause cancer in animal models and possibly also in humans (Hernandez et al., 2009). In-deed, in this study the tested NGTX carcino-gens showed to act through various process-es such as endocrine modification, immune suppression, inhibition of gap junction inter-cellular communication and apoptosis, epi-genetic modifications, tissue-specific toxicity and general inflammatory/stress responses. Some of the GTX carcinogens as well as some NC, however, often induce these events. For example, TRI is classified in this study as a NC, but induces peroxisome pro-liferation, a feature typically attributed to NGTX carcinogens (Rodricks et al., 2010). Therefore, discrimination was possible most-ly based on the GTX-specific pathways such as DNA damage. As NC, being predomi-nantly liver toxicants, were equally involved in the above described processes, they clus-tered together with the NGTX.
It has to be pointed out, however, that the current separation of selected prototypical chemicals into classes is liable to change. An interesting example in this regards is FB1, which is currently classified as being NGTX, but the incubation of methanolic extracts of Fusarium cultures with DNA in the presence of rat liver S9 proteins results in the for-mation of DNA adducts (Bever et al., 2000). Therefore, the possibility exists that com-pounds present in Fusarium fungi might al-kylate DNA and exert GTX properties (Bev-er et al., 2000). On the oth(Bev-er hand, HQO is classified as a GTX according to our study as it shows genotoxicity or chromosomal aber-rations in rodent bone marrow cells but evi-dence for any genotoxic effect in vivo is ra-ther weak and the responses are only mar-ginally positive (McGregor, 2007). Addi-tionally, a NGTX mode of action of HQO is proposed that involves exacerbation of a spontaneously occurring rodent renal disease and chronic progressive nephropathy (McGregor, 2007). The misclassification of the compounds into the different toxic clas-ses might be one of the cauclas-ses for the slight-ly higher misclassification rate when the second set of chemicals has been added. In-deed, this set of compounds had a less clear-cut mechanism of action than the chemicals of the first part of the project. Also it remains difficult to discriminate between compounds that might share some mechanism of action
e.g. GTX versus NGTX versus NC.
Apart from the classification perfor-mance of the HepaRG model (up to 88 % correct prediction), the transferability and reproducibility of the model among different laboratories were assessed. These parameters represent major steps in the validation of any test method. In this study, it was found that the interlaboratory reproducibility was situ-ated within a range of 20-35 % overlap of the AUC of the top ranked transcripts. The most reproducible results among the three laboratories were those that were obtained after exposure to the GTX compound D. The classification exercise of the 3 coded com-pounds, when used as a validation set,
re-sulted in a high correct prediction rate for the GTX carcinogen. Indeed compound D was correctly identified as a GTX and recognized as BaP. The two other blinded compounds could not be predicted. These results were overall reproducible among the three labora-tories.
In conclusion, the HepaRG model is a promising tool for identification of genotoxi-cants. The assay, however, could not dis-criminate between NGTX carcinogens and NC and in its present form cannot be regard-ed as an alternative to carcinogenicity test-ing. Currently, the standard in vitro assays for the detection of genotoxicants produce an unacceptably high number - up to 70 % and more - of irrelevant positive results (i.e. low specificity), meaning that compounds are in vitro identified as being genotoxicants whereas in vivo they are not genotoxic (Kirk-land et al., 2005; 2011; Kirk(Kirk-land and Fowler, 2010). This leads, for example in the case of candidate-pharmaceuticals, to follow-up con-firmatory in vitro and in vivo genotoxicity testing which is not only expensive and con-sumes a lot of animals but it also slows down the development process of new chemical entities (Goodsaid et al., 2010). In the case of cosmetics, for which confirmatory in vivo
tests are no longer possible in Europe as from July 2013 (EU, 2009), interesting com-pounds such as UV-filters and preservatives could erroneously be considered genotoxic, and thus restricted or even rejected (Ates et al., 2013). In such a case, identification of “not being a genotoxicant” as shown in this study, could be a valuable result to be added in a weight of evidence approach. However, in order to increase the reliability of this in vitro approach more reference compounds are needed in order to represent the high di-versity of mechanisms involved in genotoxi-city. This approach could in particular be of interest to be used in a tired testing strategy to obtain additional mechanistic information. This type of strategy is under investigation by the pharmaceutical industry in the USA to de-risk false positive results obtained in standard genotoxicity testing batteries. Its
application is already under discussion with the US Food and Drug Administration (Goodsaid et al., 2010).
As shown in this study, genotoxicants could be clearly identified using HepaRG cells as in vitro exposure model. A positive aspect of applying a toxicogenomics ap-proach is the generation of detailed infor-mation on the mechanism of action of the tested compounds. In addition, the use of human-based cells also contributes to more reliable results since interspecies differences are avoided.
DATA ACCESS
The microarray data is available at
http://www.ncbi.nlm.nih.gov/geo/query/acc. cgi?token=wtmfuemkddudnup&acc=GSE48 990
FUNDING
The study was financially supported by the European 6th Framework Program car-cinoGENOMICS (PL 037712).
CONFLICT OF INTEREST
The authors declare that they have no conflict of interest.
REFERENCES
Ates G, Pauwels M, Doktorova T, Rogiers V. Retro-spective analysis of the mutagenicity/genotoxicity da-ta of the cosmetic ingredients present on the Annexes of the Cosmetic EU legislation (2000-12). Mutagene-sis 2013;29:115-21.
Benfenati E, Benigni R, Demarini DM, Helma C, Kirkland D, Martin TM et al. Predictive models for carcinogenicity and mutagenicity: frameworks, state-of-the-art, and perspectives. J Environ Sci Health C Environ Carcinog Ecotoxicol Rev 2009;27:57-90. Bercu JP, Jolly RA, Flagella KM, Baker TK, Romero P, Stevens JL. Toxicogenomics and cancer risk as-sessment: a framework for key event analysis and dose-response assessment for nongenotoxic carcino-gens. Regul Toxicol Pharmacol 2010;58:369-81. Bever RJ Jr., Couch LH, Sutherland JB, Williams AJ, Beger RD, Churchwell MI et al. DNA adduct
for-mation by Fusarium culture extracts: lack of role of fusarin C. Chem Biol Interact 2000;128:141-57. Cristianini N, Shawe-Taylor J. An introduction to support vector machines. Cambridge, UK: Cambridge Univ. Press, 2000.
Doktorova T, Ellinger-Ziegelbauer H, Vinken M, Vanhaecke T, van Delft J, Kleinjans J et al. Compari-son of hepatocarcinogen-induced gene expression profiles in conventional primary rat hepatocytes with in vivo rat liver. Arch Toxicol 2011;86:1399-411. Doktorova TY, Pauwels M, Vinken M, Vanhaecke T, Rogiers V. Opportunities for an alternative integrating testing strategy for carcinogen hazard assessment? Crit Rev Toxicol 2012;42:91-106.
Doktorova TY, Yildirimman R, Vinken M, Vilardell M, Vanhaecke T, Gmuender H et al. Transcriptomic responses generated by hepatocarcinogens in a battery of liver-based in vitro models. Carcinogenesis 2013;34:1393-402.
EC. Communication from the Commission to the Eu-ropean Parliament and the Council on the animal test-ing and markettest-ing ban and on the state of play in rela-tion to alternative methods in the field of cosmetics. Brussels: European Commission, 2013.
Ellinger-Ziegelbauer H, Stuart B, Wahle B, Bomann W, Ahr HJ. Comparison of the expression profiles in-duced by genotoxic and nongenotoxic carcinogens in rat liver. Mutat Res 2005;575:61-84.
Ellinger-Ziegelbauer H, Gmuender H, Bandenburg A, Ahr HJ. Prediction of a carcinogenic potential of rat hepatocarcinogens using toxicogenomics analysis of short-term in vivo studies. Mutat Res 2008;637:23-39. Ennever FK, Noonan TJ, Rosenkranz HS. The predic-tivity of animal bioassays and short-term genotoxicity tests for carcinogenicity and non-carcinogenicity to humans. Mutagenesis 1987;2:73-8.
EU. B.32. Carcinogenicity test. Commission Directive 88/302/EEC of 18 November 1987 adapting to tech-nical progress for the ninth time Council Directive 67/548/EEC on the approximation of laws, regula-tions and administrative provisions relating to the classification, packaging and labelling of dangerous substances. Off J Eur Union 1988;L133:37-42.
EU. B.32 Carcinogenicity test. Council regulation (EU) No 440/2008 of 30 May laying down test meth-ods pursuant to Regulation (EC) No 1907/2006 of the European Parliament and of the Council on the Regis-tration, Evaluation, Authorization and Restriction of Chemicals (REACH). Off J Eur Union 2008;L142: 338-43.
EU. Regulation 1223/2009 of the European Parlia-ment and of the Council of 30 November 2009 on cosmetic products. Off J Eur Union 2009;L342:59-209.
Ferdowsian HR, Beck N. Ethical and scientific con-siderations regarding animal testing and research. PloS One 2011;6:e24059.
Fielden MR, Nie A, McMillian M, Elangbam CS, Trela BA, Yang Y et al. Interlaboratory evaluation of genomic signatures for predicting carcinogenicity in the rat. Toxicol Sci 2008;103:28-34.
Gold LS, Slone TH. Prediction of carcinogenicity from two versus four sex-species groups in the car-cinogenic potency database. J Toxicol Environ Health 1993;39:143-57.
Goodsaid FM, Amur S, Aubrecht J, Burczynski ME, Carl K, Catalano J et al. Voluntary exploratory data submissions to the US FDA and the EMA: experience and impact. Nat Rev Drug Discov 2010;9:435-45. Gripon P, Rumin S, Urban S, Le Seyec J, Glaise D, Cannie I et al. Infection of a human hepatoma cell line by hepatitis B virus. Proc Natl Acad Sci U S A 2002;99:15655-60.
Guillouzo A, Corlu A, Aninat C, Glaise D, Morel F, Guguen-Guillouzo C. The human hepatoma HepaRG cells: a highly differentiated model for studies of liver metabolism and toxicity of xenobiotics. Chem Biol Interact 2007;168:66-73.
Hernandez LG, van Steeg H, Luijten M, van Benthem J. Mechanisms of non-genotoxic carcinogens and im-portance of a weight of evidence approach. Mutat Res 2009;682:94-109.
Kamburov A, Pentchev K, Galicka H, Wierling C, Lehrach H, Herwig R. ConsensusPathDB: toward a more complete picture of cell biology. Nucleic Acids Res 2011;39:D712-7.
Kamburov A, Stelzl U, Lehrach H, Herwig R. The ConsensusPathDB interaction database: 2013 update. Nucleic Acids Res 2013;41:D793-800.
Kirkland D, Fowler P. Further analysis of Ames-negative rodent carcinogens that are only genotoxic in mammalian cells in vitro at concentrations exceeding 1 mM, including retesting of compounds of concern. Mutagenesis 2010;25:539-53.
Kirkland D, Aardema M, Henderson L, Muller L. Evaluation of the ability of a battery of three in vitro genotoxicity tests to discriminate rodent carcinogens and non-carcinogens I. Sensitivity, specificity and rel-ative predictivity. Mutat Res 2005;584:1-256.
Kirkland D, Reeve L, Gatehouse D, Vanparys P. A core in vitro genotoxicity battery comprising the Ames test plus the in vitro micronucleus test is suffi-cient to detect rodent carcinogens and in vivo geno-toxins. Mutat Res 2011;721:27-73.
Lu X. Tied up in loops: positive and negative auto-regulation of p53. Cold Spring Harbor Perspect Biol 2010;2:a000984.
Magkoufopoulou C, Claessen SM, Tsamou M, Jennen DG, Kleinjans JC, van Delft JH. A transcriptomics-based in vitro assay for predicting chemical genotoxi-city in vivo. Carcinogenesis 2012;33:1421-9.
Matsumoto H, Yakabe Y, Saito K, Sumida K, Sekiji-ma M, NakayaSekiji-ma K et al. Discrimination of carcino-gens by hepatic transcript profiling in rats following 28-day administration. Cancer Inform 2009;7:253-69. McGregor D. Hydroquinone: an evaluation of the human risks from its carcinogenic and mutagenic properties. Crit Rev Toxicol 2007;37:887-914.
Mosmann T. Rapid colorimetric assay for cellular growth and survival: application to proliferation and cytotoxicity assays. J Immunol Meth 1983;65:55-63. Nakayama K, Kawano Y, Kawakami Y, Moriwaki N, Sekijima M, Otsuka M et al. Differences in gene ex-pression profiles in the liver between carcinogenic and non-carcinogenic isomers of compounds given to rats in a 28-day repeat-dose toxicity study. Toxicol Appl Pharmacol 2006;217:299-307.
Oliver TG, Meylan E, Chang GP, Xue W, Burke JR, Humpton TJ et al. Caspase-2-mediated cleavage of Mdm2 creates a p53-induced positive feedback loop. Molecular Cell 2011;43:57-71.
Rodricks JV, Swenberg JA, Borzelleca JF, Maronpot RR, Shipp AM. Triclosan: a critical review of the ex-perimental data and development of margins of safety for consumer products. Crit Rev Toxicol 2010;40: 422-84.
SCCP, Scientific Committee on Consumer Products. The SCCP’S notes of guidance for the testing of cos-metic ingredients and their safety evaluation. 6th rev., adopted by the SCCP during the 10th plenary meeting of 19th December 2006. SCCP, 2006.
Uehara T, Hirode M, Ono A, Kiyosawa N, Omura K, Shimizu T et al. A toxicogenomics approach for early assessment of potential non-genotoxic hepatocarcino-genicity of chemicals in rats. Toxicology 2008;250: 15-26.
Van Hummelen P, Sasaki J. State-of-the-art genomics approaches in toxicology. Mutat Res 2010;705:165-71.
Vinken M, Doktorova T, Ellinger-Ziegelbauer H, Ahr HJ, Lock E, Carmichael P et al. The carcino-GENOMICS project: critical selection of model com-pounds for the development of omics-based in vitro carcinogenicity screening assays. Mutat Res 2008; 659:202-10.
Waters MD, Jackson M, Lea I. Characterizing and predicting carcinogenicity and mode of action using conventional and toxicogenomics methods. Mutat Res 2010;705:184-200.
Yildirimman R, Brolen G, Vilardell M, Eriksson G, Synnergren J, Gmuender H et al. Human embryonic stem cell derived hepatocyte-like cells as a tool for in vitro hazard assessment of chemical carcinogenicity. Toxicol Sci 2011;124:278-90.
Abbreviations: 2NF, 2-nitrofluorene; ACE, acetam-ide; AFB1, aflatoxin B1; AMQ, 2-amino-3-methylimidazo(4,5-f)quinoline; AUC, area under the curve; BaP, benzo(a)pyrene; BEA, benzyl alcohol; BEN, benzoin; BPI, Biopredic; cDNA, complemen-tary DNA; CND, clonidine; CsA, cyclosporine A; CYCLO, cyclophosphamide; DHP, diethylhexyl phthalate; DLM, D,L-menthol; DMSO, dimethyl-sulfoxide; ETH, ethanol; EURL ECVAM,European Union Reference Laboratory for Alternatives to Ani-mal Testing; FAF, 4-acetylaminofluorene; FDR, false discovery rate; FMB, fumonisin B1; GC-RMA, gene chip robust multi-array average; GTX, genotoxic; HCA, hierarchical clustering analysis; HHC, hydra-zine dihydrochloride; HQO, hydroquinone; HUL, University hospital of Valencia; IC10, inhibitory con-centration reducing viability by 10 %; LOO, leave one out; MAN, D-mannitol; Mdm2, murine double minute 2; MPH, methapyrilene hydrochloride; MTT test, 3-(4,5-dimethylthiazol-2-yl)-2,5-diphenyltetrazolium bromide test; NC, carcinogen; NGTX, non-genotoxic; NIF, nifedipine; NMP, N-nitroso-morpholine; NNK, 4-(methylnitrosamino)-1-(3-pyridyl)-1-butanone; PIPB, piperonylbutoxide; PBS, phosphate-buffered saline; PCA, principal component analysis; qRT-PCR, quantitative reverse transcription polymerase chain reaction; REACH, Registration, Evaluation, Authorization and restriction of Chemi-cals; RIN, RNA integrity number; RPR, relative pathway response; SDF, diclofenac sodium; SPB, phenobarbital sodium; SVM, support vector machine; TAF, 2-acetylaminofluorene; TOL, tolbutamide; TPA, tetradecanoyl phorbol acetate; TRI, triclosan; VUB, Vrije Universiteit Brussel; WYE, Wy-14643.