An Analysis of the Effect of English Proficiency towards
Students' Academic Performance in University of
Malaysia Sabah
Qhatrunnada Suyansah
*, Darmesah Gabda
Faculty of Science and Natural Resources, University Malaysia Sabah, Malaysia
Received July 21, 2019; Revised October 5, 2019; Accepted February 20, 2020
Copyright©2020 by authors, all rights reserved. Authors agree that this article remains permanently open access under the terms of the Creative Commons Attribution License 4.0 International License
Abstract
Students are the main assets of universities. Students’ academic performance has been the top priority for themselves, educators, researchers, government, and parents. There have been many studies that sought to investigate factors that influence students’ academic performance and they discover that hard work, discipline, class attendance, self-motivation, previous schooling and family’s income affect students’ academic performance, and these seem to have significant effects on the students’ final Cumulative Grade Point Average, CGPA. This study aims to investigate whether students’ English language results and their entry results during admission are also factors that influence their final Cumulative Grade Point Average, CGPA. Multiple linear regression was the analysis used to determine the effect of English proficiency towards students’ academic performance. Thus, the results will show the factors that significantly contribute to the students’ academic performance.Keywords
Academic Performance, English Results, Multiple Linear Regression1. Introduction
The higher learning institutions in Malaysia are growing in number which indicates a positive improvement towards the opportunities for individuals to pursue their higher education and as a result increasing the growth of human capital of the country [5]. Student’s performance has always been a concern to many parties especially in education and government sector. Education institutions are on the go to consistently improve the quality of students that they produce. Moreover, fresh graduate employment is the main concern for students as they complete their studies.
Malaysia is one of the Asian countries that adopt bilingual education system. English is used as the second language in the country [11]. It is through the vehicle of English language that student accesses knowledge in other subject areas. Some universities in Malaysia today are also teaching fully in English. To this effect, proficiency in the English language is essentially not only for academic success alone but performing in life as various individuals. Thus, it is crucial for us to study whether students’ English language proficiency influences their academic performance or not.
Another variable to be considered in this study is the entry results during admission; the students’ cumulative grade point average (CGPA). Malaysia Ministry of Higher Education’s website shows that the qualifications’ requirement to pursue to the degree level by Unit Pengambilan Universiti (UPU) is Foundation, Matriculation, Diploma, Sijil Tinggi Persekolahan Malaysia (STPM), and Sijil Tinggi Agama Malaysia
(STAM). The results (CGPA) from the different background of certification will be used in this study as the entry results during admission. This is to determine whether students’ entry results and their background of certification have any influence on students’ academic performance.
Previous studies discover that class attendance reflects significantly towards students’ academic performance [7]. On the other hand, student’s studying effort, age, and a healthy match between student’s learning style and instructor’s teaching style also have positive effect on student's performance [7]. Several studies also indicate that students’ previous GPA is another factor that has a positive effect on the students’ performance. Hence, this study will determine whether the students’ English language results, entry results during admission as well as demographic factor affect their academic performance.
2. Literature Review
One of the indicators for students’ performance is measured by their cumulative grade point average (CGPA). Many factors can act as a catalyst for students to achieve higher CGPA that reflects their overall academic performance such as gender, previous academic results, family’s level of income, time spent studying, and learning ability [10]. In Malaysia there are several numbers of studies conducted to determine the factors that affect students’ performance. Another research that explores the attitude of a group of six students towards accounting finds that the subjects’ academic achievement correlates with the thinking behind the subject, interest, time, view of parental assistance and the impact and financial status of undergraduates. However, gender does not seem to have any influence [2].
Martirosyan et. al., [9] conducted a research on the impact of English proficiency on academic performance of international students. The analysis used in this study was the analysis of variance (ANOVA) and multiple linear regression and this resulted that English language proficiency does contribute significantly towards the international students’ academic performance (CGPA). Martirosyan et. al., [9] quoted from many previous studies, which indicated that there were significant positive correlations between English scores (TOEFL, IELTS) and students’ academic performance (CGPA).
On the other hand, measuring the prior instructional results of learners is the most significant indicators of the future accomplishment of learners, i.e. the greater the prior results are, the better the academic output of the learners is. In addition, students who showed higher performance at the start of their studies are also expected to perform better in their future academic years [12]. The motive to be successful can be obtained from experiences in achieving success in previous learning situation. These experiences of success will result in high achievement motivation and a lack of success results in motive to avoid failure [6].
Tangaraju et. al., [4] investigated factors that may influence the academic performance among a group of undergraduates of in Kampar. The inferential statistical test applied in this study was multiple linear regression measuring which of the factors that influences their academic performance, i.e. teaching method, time management, attendance of student, sleeping, and racial ideology. They discovered that the independent variables were positively and significantly correlated to the academic performance except the variable racial ideology, which indicated that it has a negative relationship towards the academic performance.
3. Material and Methods
3.1. Data Description
The main objective of this study is to identify whether
English proficiency affects students’ academic performance. The respondents for this study were from the Faculty of Science and Natural Resources (FSSA). Anaccumulation of 1989 respondents within the 3 years (2015, 2016 & 2017) were involved in this study. The dependent variable for this study is the student’s final CGPA which is the variable used to determine the student’s academic performance. In addition, there are also several independent variables to be considered for this study, which are the student’s admission result in CGPA, their qualification, the average of their matriculation English results, asasi sains or foundation for science English results,
Sijil Pelajaran Malaysia, SPM English results, and the English results from the Centre for The Promotion of Knowledge and Language Learning, PPIB.
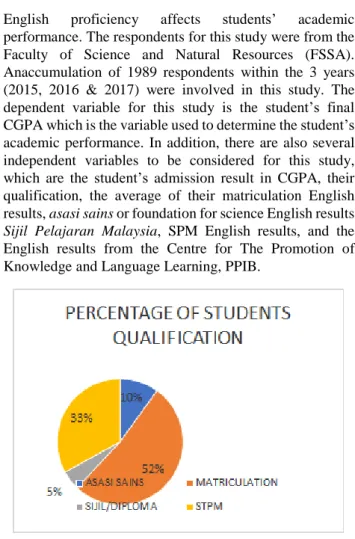
Figure 1. Percentage of Students Qualification from the year 2015, 2016 & 2017
The different qualifications of the students are matriculation, asasi sains, diploma, and STPM. The highest percentage of student’s qualification admitted is from matriculation with 52%. The second highest is STPM with a percentage of 33%, asasi sains with a percentage of 10% and the least number of students admitted is with a diploma with the percentage of 5%.
Figure 2. CGPA in of Students from the year 2015, 2016 & 2017
From the bar chart in figure 2, an average of 245 students has an admission CGPA in between 2.50 and 2.99 from the year 2015, 2016 and 2017. It shows that a high number of students received an admission CGPA within that range.
Figure 3. Final CGPA of Students from the year 2015, 2016 & 2017
An average of 274 students have a final CGPA between 3.00 and 3.49 from the year 2015, 2016 and 2017. It shows that a high number of students received a final CGPA within that range and it shows that there is an average increase of students who have received a higher final CGPA compared to the average of admission CGPA.
Figure 4. Percentage of Student’s MUET results from the year 2015, 2016 & 2017
In the year of 2015, 2016 & 2017, students who achieved Band 3 had the highest number of achievers with a percentage of 51%. On the other hand, students who achieved Band 5 in the 3 years (2015, 2016 & 2017) recorded the lowest number of achievers as many as 1% of the total students. Band 1 students recorded the second lowest with 2%. An average of 8 students attained band 5 in the 3 years.
In this study, the Statistical Package for Social Sciences (SPSS) is used as an analysis tool for this study.
3.2. Data Analysis Technique
3.2.1. Normality Test
A normality test was conducted to test whether the sample data is from normally distributed population. In this research, Kolmogorov-Smirnovis used to test the normality because the sample size is greater than 50. This test will further determine which analysis is appropriate to proceed with, a parametric test or a non-parametric test. The null
hypothesis for this test is “the sample distribution is normal” [1].
3.2.2. Pearson Correlation
A Pearson correlation is used to measure the strength and direction of linear relationships between pairs of continuous variables. The output is in matrix form. The null hypothesis is, there is no statistically significant linear relationship or association between the two variables.
The formula of Pearson correlation to measure the strength of the association between two variables, x and
y with sample size, nis shown in Equation 1:
𝑟 =√(𝑛 ∑ 𝑥2𝑛 ∑ 𝑥𝑦−∑ 𝑥 ∑ 𝑦
−(∑ 𝑥)2)(𝑛 ∑ 𝑦2−(∑ 𝑦)2) (1) The direction of correlation can be determined by the value of r, when the value of r is a positive value it is a positive correlation, the direction will go in an upward linear direction. However, if r is a negative value it is a negative correlation, the direction will go in a downward linear direction. According to Gogtay et. al., [8], when the correlation value, r is 1, it is a perfect linear correlation, if it is 0.70 and above, there is a strong positive relationship, 0.40 to 0.69, there is a strong relationship, 0.20 to 0.29, there is a weak relationship, 0.01 to 0.19, there is no or negligible relationship and if it is 0, there is no relationship. The positive and negative value of the correlation shows that they are a positive or negative relationship among the variables.
3.2.3. The Analysis of Variance
The analysis of variance (ANOVA) is a test to determine whether there are any statistically significant differences between the means of three or more independent comparison groups. According to Sawyer [13], the null hypothesis is: H0: µ1 =µ2 =µ3. However, the alternative hypothesis is that at least one group mean differs in this study the groups are the different qualification backgrounds of students. Hence, we want to investigate the mean difference of the final CGPA between the groups of students’ qualifications.
3.2.4. Multiple Linear Regressions
Multiple linear regressions analysis refers to a statistical way that permits simultaneous analysis with the linear relationship of two or more independent variables, X on the dependent variable, Y . In simple matrix form, the relationship of variable Y and X can be expressed as YX where is referred as a regression slope parameter and as error term. According to McDonald [3], the null hypothesis of a multiple regression is that there is no relationship between the independent variables and the dependent variables; in other words, the dependent variables you anticipate from your multiple regression equation are no nearer to the actual values of the dependent variable than you would expect by chance. The parameter estimates of ˆ can be obtained by using least square method as follows:
𝛽̂ = (𝑋𝑇𝑋)−1𝑋𝑇𝑌 (2) The corresponding equation for this study is as below: Y= β0 + β 1X1 + β 2X2 + β 3X3 + β 4X4 + β 5X5+ … + β kXk + ε (3)
The equation in this study is constructed as below:
(4) Whereby,
CGPAFINAL – Final CGPA
CGPAIN – Admission Results
BIMATRIX – Matriculation english results
BIPPIB- PPIB english results
BIASASI- Asasi Sains english results
BISPM- SPM english reuslts
QUALIFICATION- Qualification
4. Results and Discussion
4.1. Normality Test
The SPSS output of Kolmogorov-Smirnov test of normality showed that the three years, 2015, 2016 and 2017, are all statistically significant in terms of the final CGPA against the different qualifications of matriculation, STPM,
asasi sains, and diploma. Therefore, we can conclude that the data are normally distributed. Hence, we could proceed
with a parametric test for further analysis.
4.2. ANOVA
We conducted an ANOVA test with the aid of the SPSS to investigate whether there was a mean difference of the CGPA from different admission qualification. As a result, it could be concluded that there is a statistically significant difference of CGPA between the group means in all three years with 5% level of significance. Therefore, there is a statistically significant difference in the means of the final CGPA to the different qualifications.
Figure 5 shows a bar chart for the year 2017 of the mean final CGPA difference between the groups of qualification with 95% confidence interval. From the bar chart, the mean between the groups of qualification is different. The highest was from STPM, with a mean CGPA of 3.38, the second highest is asasi sains with a mean of 3.04 and the other two groups’ mean differences do notvary as much, which are 2.95 and 2.96. STPM shows an obvious mean difference compared to the other three qualifications. Hence, we can reject H0, which indicates that there is a statistically significant difference of the final CGPA between the mean of the groups of qualification.
Besides that, for the year 2015, the highest was also from STPM with a mean CGPA of 3.31 and the other two groups, matriculation and diploma, with a close mean CGPA difference of 2.89 and 2.90. Lastly, in 2016, the highest mean CGPA of 3.34 was from STPM. The other groups do not have many differences in their mean CGPA, which were 3.04, 2.83 and 2.87.
Figure 6. Correlation Matrix of the Year 2017
4.3. Correlation
The results of the strength and direction of linear relationship between the variables of the Pearson correlation are shown in Figure 6.
Figure 6 shows the correlation matrix between variables for the year 2017. The final CGPA is against the independent variables; qualifications, CGPA in, BI MUET, BI MATRIX, BI PPIB and BI SPM. The result shows that the value of the correlations indicates that most of the independent variables have a significant and weak linear relationship with the CGPA Final. The similar results were obtained for the year 2016 and 2015.
4.4. Multiple Linear Regressions
The stepwise linear regression model used to determine factors affected student’s academic performance (final CGPA). A stepwise linear regression was the method used to regress multiple variables while simultaneously removing variables that are not important. Therefore, there are only the significant factors remained. From the SPSS output, we could see that the most significant factors were the entry results (CGPA IN), which are the entry results, BIMUET, which is MUET English results, BI PPIB, which is the average of English results from PPIB, BI MATRIX, which is the average of Matriculation English results, and Dstpm, which are students from STPM qualification background.
Table 1. Regression Statistics for dependent and independent variable for Year 2017
Model R R Square Adjusted R Square Std. Error of the Estimate 5 .619e .383 .379 .28253 Model Unstandardized Coefficients Standardized Coefficients t Sig. B Std. Error Beta 5 (Constant) 1.895 .104 18.269 <.01 Dstpm .275 .032 .350 8.720 <.01 BI PPIB .174 .026 .205 6.678 <.01 CGPA IN .155 .026 .182 5.962 <.01 BI MATRIX -.042 .010 -.156 -4.215 <.01 BI MUET .054 .016 .112 3.471 .001
a. Dependent Variable: CGPA FINAL
The results above show the final model which indicates the best predictor for students’ academic performance. CGPA FINAL is used as dependent variable.
The general form of equation to predict the FINAL CGPA is:
(5)
The strongest predictor is the qualification from STPM. A 1-unit increase is associated with an increase of 0.275 unit in the CGPAFINAL. Furthermore, for every increase in 1 unit for entry results (CGPAIN), the CGPAFINAL expected to be increased by 0.155. The result shows that English proficiency significantly affects the students’ academic performance. However, these factors only explain 37.9% of total variation of the student’s results (adjusted R2=0.379).
The previous two years 2015 and 2016, showed similar patterns compared to 2017. The similar significant factors included were CGPA IN, BI PPIB, BI MUET, BI MATRIX and from STPM qualification background. Besides that, the adjusted R2 for 2015 and 2016 are about 45% respectively. The remaining of total variation explains that there are other factors that influence the students’ academic performance.
Lastly, a goodness of fit test for residuals could be seen by using normal probability plot. The normal P-P plot shows that most of the plots fall on the line. Therefore, this shows that the standardized residuals are normal distributed.
5. Discussion and Conclusions
In this paper, it is found that students’ admission results, MUET results, matriculation English results, PPIB English results and STPM, and admission CGPA significantly affect the students’ academic performance. This is clearly reflected in the analysis of the 1989 students of Faculty of Science and Natural Resources, Universiti Malaysia Sabah data from the year 2015 to 2017.
Obviously, besides English proficiency, there are other factors, as shown by previous study such as, students’ attitude towards the subject, interest, time management, parental support, teachers’ influence, socio-economic
status, time spent studying, learning ability and other related factors, that influence tertiary students’ academic performance.
The finding of this study not only will highlight the issue that needs to be addressed by these students to increase their marketability and employability rate but can also be a form of yard stick for the industries in choosing graduates who should be competent in promoting themselves and their workplace. In conclusion, the finding of this study shows that tertiary students’ English proficiency does have an impact on their quality of academic performance. Hence, to excel in their academic performance, they have to consistently improve their English proficiency and other crucial factors.
Acknowledgements
In preparation to complete this full paper, I would like to express my gratitude towards University Malaysia Sabah for the financial support by providing a grant, GUG0354-1/2019 to conduct this study.
REFERENCES
[1] A. Ghasemi, & S. Zahediasl, (2012). Normality tests for statistical analysis: a guide for non-statisticians. International journal of endocrinology and metabolism, 10(2), 486–489. doi:10.5812/ijem.3505
[2] E. Alfan, & M. N. Othman, (2005) "Undergraduate students' performance: the case of University of Malaya", Quality Assurance in Education, Vol. 13 Issue: 4, pp.329-343, https://doi.org/10.1108/09684880510626593
[3] J. H. McDonald, (2009). Handbook of Biological Statistics. Sparky House Publishing, Baltimore, Maryland, USA. [4] K. Tangaraju, S. H. Chee, T. L. Koon, T. S. Yi, T. W. Mann,
(2013). Analysis of Factor Influencing the Academic Performance of Undergraduates in Kampar. Retrieved from http://eprints.utar.edu.my/1016/1/AC-2013-0904962-1.pdf [5] M. A. Nazron, B. Lim, & J. L. H. Nga, (2017). Soft Skills
Attributes and Graduate Employability: A Case in Universiti Malaysia Sabah. Malaysian Journal of Business Economic, vol. 4, no. 2, 65–76.
[6] Naccache, & H. Salim, "Factors Related to Student Performance in Statistics Courses in Lebanon" (2012). Dissertations. 852. https://aquila.usm.edu/dissertations/852 [7] N. Harb, & A. El-shaarawai, (2006) Factors effecting
student’s performance. Munich Personal Repec Archive, paper No. 13621.
[8] N. J. Gogtay, & U. M. Thatte, (2017). Principles of Correlation Analysis. Journal of The Association of Physicians of India, 65(3), 78-81.
[9] N. M. Martirosyan., E. Hwang, & R. Wanjohi, (2015). Impact of English proficiency on academic performance of
international students. Journal of International Students, 5(1), 60-71.
[10]N. Yogendra, A. Andrew, (2017). A Study on The Factors Influencing on Grade Point Average (GPA) with Special Reference to Third Year Commerce and Management Students of Eastern University, Sri Lanka. Journal for Studies in Management and Planning, 3(8), 409-425. [11]R. Darmi, & P. Albion, (2013). English language in
Malaysian education system: Its existence and implication. Retrieved from https://www.researchgate.net/publication/2 79867616_ENGLISH_LANGUAGE_IN_MALAYSIAN_ EDUCATION_SYSTEM_ITS_EXISTENCE_AND_IMP LICATION
[12]S. Ali, Z. Haider, H. Khan & A. Ahmed, “Factors Contributing to the Students’ Academic Performance: A Case Study of Islamia University Sub-Campus.” American Journal of Educational Research 1, no. 8 (2013): 283-289. doi: 10.12691/education-1-8-3.
[13]S. F. Sawyer, (2009). Analysis of Variance: The Fundamental Concepts. The Journal of Manual & Manipulative Therapy , volume 17 , number 2, E27-E38.