2015
Psychometric changes on item difficulty due to item review by
Psychometric changes on item difficulty due to item review by
examinees
examinees
Elena C. Papanastasiou
Follow this and additional works at: https://scholarworks.umass.edu/pare
Recommended Citation Recommended Citation
Papanastasiou, Elena C. (2015) "Psychometric changes on item difficulty due to item review by examinees," Practical Assessment, Research, and Evaluation: Vol. 20 , Article 3.
DOI: https://doi.org/10.7275/jcyv-k456
Available at: https://scholarworks.umass.edu/pare/vol20/iss1/3
This Article is brought to you for free and open access by ScholarWorks@UMass Amherst. It has been accepted for inclusion in Practical Assessment, Research, and Evaluation by an authorized editor of ScholarWorks@UMass
A peer-reviewed electronic journal.
Copyright is retained by the first or sole author, who grants right of first publication to Practical Assessment, Research & Evaluation.
Permission is granted to distribute this article for nonprofit, educational purposes if it is copied in its entirety and the journal is credited. PARE has the right to authorize third party reproduction of this article in print, electronic and database forms.
Volume 20, Number 3, January 2015 ISSN 1531-7714
Psychometric changes on item difficulty due to item review by
examinees
Elena C. Papanastasiou, University of Nicosia
If good measurement depends in part on the estimation of accurate item characteristics, it is essential that test developers become aware of discrepancies that may exist on the item parameters before and after item review. The purpose of this study was to examine the answer changing patterns of students while taking paper-and-pencil multiple choice exams, and to examine how these changes affect the estimation of item difficulty parameters. The results of this study have shown that item review by examinees does produce some changes to the examinee ability estimates and to the item difficulty parameters. In addition, these effects are more pronounced in shorter tests than in longer tests. In turn, these small changes produce larger effects when estimating the changes in the information values of each student’s test score.
In recent years there has been an increase of the amount of tests that have changed, or are planning to change their administration formats. For example, the GRE and the TOEFL tests that had originally been administered in a paper-and-pencil format, moved to a computer adaptive administration format of their tests in 1995. State assessments have also seen changes in their administration formats. As of spring 2004, the Kansas Assessments had included a computerized assessment option (Kansas Computerized Assessment, KCA), while other states such as Indiana, North Carolina, and Virginia soon followed these directions (Poggio, Glassnap, Yang, Beauchamp & Dunham, 2005). Numerous private organizations have already made the move from their paper-and-pencil tests into computerized formats as well.
Changes in the administration formats of these tests could also mean changes in the ways in which examinees respond to these tests. In turn, these changes could interfere with each tests’ psychometric properties, and with their item parameters. One such change that came along when computer adaptive tests were introduced was that of item review by examinees. Item review is the process of permitting examinees to
go back, review, and possibly change answers that have previously been entered by the same examinee on a test (Papanastasiou, 2005). Although item review is a common practice on paper-and-pencil tests, it was not always permitted in computer adaptive tests when they were first introduced, due to various problems associated with item review, including the issue of cheating on the test. This ignited a series of studies examining the issue of item review (Papanastasiou, 2001; Vispoeal, 1998; Vispoes, Henderickson & Bleiber, 2000). However, no research studies have examined whether item review can affect the item characteristics of the reviewed items. More specifically, no study has examined whether the calibration of the test items produces different results before and after review. It is possible that the item difficulties might vary before and after the students make changes to their answers. This could affect the estimation of the examinee’s ability estimates. Prior studies have found that in situations where the items are not well matched to the examinee’s ability, the bias of the examinee’s ability estimate tends to increase (Reckase, 1975). Therefore the objectives of the study are:
1) to examine the answer changing patterns of students on paper-and-pencil multiple choice tests, and their effects on student achievement 2) to examine the effects of these changes on the
estimation of the item difficulty parameters 3) to determine how the answer changes and the
changes in the difficulty parameters affect the information values of each student’s test scores
Literature review
Item review by examinees has been an issue of concern to researchers and students for a number of decades. From the student perspective, it is not uncommon to want to go back and change some answers on any type of test. Some reasons for wanting to use item review and make changes to certain answers include rereading and better understanding an item, conceptualizing a better answer, gaining information and clues from other items, and correcting careless mistakes (Harvill & Davis, 1997, p.97). These reasons can be further divided into two major categories: into legitimate and illegitimate reasons for changing answers (Wise, 1996). Legitimate reasons are the ones in which examinees change incorrect to correct answers due to knowledge that was possessed at the beginning of the test. This can be considered good practice since the final score would reflect an examinee's ability more accurately. In turn, the validity of the test increases.
Allowing answer changes following review also could increase test score validity if the changes reflect corrections of typing errors, misreading of items, temporary lapses in memory, or reconceptualizations of answers to previously administered items. Under these conditions, item review would yield more valid scores because the scores would represent the examinee's skill level at the end of the test more accurately, and the scores would not be contaminated with clerical or other inadvertent errors (Vispoel, 1998b, p.338).
Illegitimate reasons for changing answers include the cases in which examinees correct an incorrect response due to test wiseness, by using methods such as cheating strategies, by gaining clues from other test items, or by the instructor (Papanastasiou, 2001). Obviously this is not considered as good practice since the final scores would provide misleading information about the examinee's true abilities.
Schwartz, McMorris and DeMers (1991) have found that the majority of the students would change their answers on tests because of legitimate reasons. Forty five percent of the students would change their answers because they reread and better understood the question; 31% would change their answers because they rethought and conceptualized the question better, and 20% because they remembered more information. In addition, this study also found that the students that gained the most out of their answer changing were the students in the middle or highest third of their class. Therefore, according to Lunz, Bergsrtom and Wright (1992), it is an issue of fairness to permit the examinees to demonstrate their true knowledge by checking for calculation or entry errors or for uncertain responses, and to be able to change their answers when such errors are spotted.
Prior research that was based on paper-and-pencil tests has shown that examinees tend to increase their test scores when they are allowed to revise their answers. In a study conducted by Geiger (1991), it was found that on regular paper-and-pencil tests where students had the opportunity to review items, 97% of the students had changed at least one item. In addition, 70% of the students increased their scores by changing their answers on the test (Geiger, 1991). Wagner, Cook, and Friedman (1998) found similar results with a sample of fifth grade students. Their results show that 85% of the students changed their answers during the test, and that only 23% of those students lost points by the changes. Fifty-seven percent of the students gained points by their changes, while 20% had no change in their final scores. A meta-analysis conducted with 75 studies on answer changing found that 57% of the answer changes were made from incorrect to correct options, and 21% of the changes were from correct to incorrect options (Waddell & Blankenship, 1994).
Vispoel (1998) found similar results for a computerized test. He found that 67% of the examinees had made changes to their answers on the adaptive test. Stone and Lunz (1994) also found that 47% of the total answers changed on an adaptive test were from incorrect to correct options, and 27% were changed from correct to incorrect options. In a more recent study with Spanish students, Revuelta, Ximenez and Olea (2003) found that almost 90% of the students chose to change their answers, of which 65% benefited from doing so.
Practical Assessment, Research & Evaluation, Vol 20, No 3 Page 3 Papanastasiou, Item parameter shifts
Effects of Item Review
What are the effects of item review on test’s psychometric properties ? In order to understand the effects of review on a computer adaptive certification exam, Stone and Lunz (1994) compared the examinee responses before and after reviewing and possibly altering their responses on the test. Their results show that the error of measurement after reviewing the items increased by approximately 0.0025. This means that the loss of precision and efficiency on the test, caused by the item review was minimal. Another study performed by Lunz, Bergstrom and Wright (1992) found that the loss of information due to the revision of items was less than the amount of information that would be added if one additional item targeted to an examinee's ability were added to the test. Moreover, the same study found that the examinees that were able to review their answers performed significantly better than an equivalent group of examinees that were administered the same test, but were not allowed to revise their answers. This increase in test scores might also be due to the comfort that the examinees feel when they know that they are allowed to go back and revise their answers, and correct possible careless errors they might have made (Lunz, Bergstrom, & Wright, 1992).
Stocking (1997) examined the effects of revising items on a CAT where students were purposely told to use a cheating strategy, while answering the test. Her results show that the conditional bias of a test, when up to two items (out of 28) were revisited and changed, was minimal. However, when there were seven or more items that were revisited, there was a positive bias in the test scores. This bias was especially large for examinees with approximately average or high scores.
However, no research studies have examined whether item review can affect the item characteristics of the reviewed items, and whether the calibration of the test items produces different results before and after review in relation to the examinee answer changing practices. This study will try to reach a conclusion in regard to these issues, and determine whether it is appropriate to use item parameters from two different testing situations interchangeably or not.
Methods
The sample for this study consists of 1062 sophomore, undergraduate college students. The
students, who were all Europeans, had responded to five-option, dichotomously scored multiple choice exams in their research methods courses. The items that the students responded to were obtained from three separate tests that all measured the student’s knowledge in research methodology. Test 1, which was a midterm test consisted of 64 items; test 2, a final test consisted of 80 items, while test 3 which was also a midterm test consisted of 30 items. There were 376 students that responded to test 1, 383 students that responded to test 2, and 303 students that responded to test 3. Three separate tests were included in the analysis in order to increase the number of test items analyzed.
All exams were administered in a paper-and-pencil format on which the students were requested to circle their answers with a pen. This method enabled the researchers to clearly identify the questions to which the students had changed their answers to, because those answers were clearly crossed out as reviewed answers. The responses to which students crossed out incorrect distractors (to eliminate the remaining response options) as a test-taking strategy were not considered as items to which item changing took place. The students in the sample were not given any additional time to make changes to their test scores, and all students had adequate time to respond to the test and make the necessary changes to their answers. Therefore, all changes were made within the predetermined time limits of the examination.
After the exams of the students were collected, the student’s final answers, as well as their crossed out answers were documented. The calibrations of the three tests were run separately with the use of Conquest (Wu, Adams & Wilson, 1998), where the examinees were centered on 0. Additional analyses were performed with the use of SPSS. Due to the relatively small sample size and the small size of the item pool, the one-parameter logistic model was used for the analyses of the dichotomous data. This enabled the researcher to focus on the effects of item review on a single item parameter1. The item parameters were obtained through marginal maximum likelihood estimates obtained using an EM algorithm.
1
Additional data are currently being collected to examine the effects of item review on the 2 and 3 parameter logistic models.
The reliability of the test scores were calculated before and after review. On tests one and three, the reliabilities of the scores were slightly higher after review. On test 2 however, there was practically no change in the score’s reliability estimates. More specifically, the Cronbach’s alpha reliability of the scores on test 1 was 0.716 with a 95% confidence interval (CI) of [0.674, 0.755] before review, and 0.754 with a CI of [0.717, 0.788] after review. The reliability of the test scores on test 2 were 0.756 with a 95% CI of [0.720, 0.790] before review and 0.757 [0.720, 0.790] after review. Finally, the reliability of the test scores on test 3 were 0.670, with a 95% CI of [0.614, 0.721] before review and 0.688 with a CI of [0.635, 0.737] after review.
Results
The results of this study have shown that 85.9% of the students in the sample had changed at least one of their answers on their test. On average, each student made 6.39% changes to their answers on the test, while the maximum amount of changes that were made by a single student were 46.67% (on test 3). As shown in the pooled results of Table 1, the mean percentage of wrong-to-right changes that were made by each student was 2.74%. The percentage of wrong-to-wrong changes was 2.39%, while the average percentage of right-to-wrong changes that were made was 1.30%.
The majority of the students did benefit from their answer changing behaviors. Of all the answer changes made, 42.40% were from wrong-to-right, 40.53% were from wrong-to-wrong, and 17.07% were from right-to-wrong. It should be noted that on tests 1 and 3 the majority of the answer changes were from wrong-to-right (48.33% and 46.27% correspondingly). The exception occurred on test 2 however, the longer test, in which the majority of the changes (69.36%) were from wrong-to-wrong.
The maximum number of points gained by answer changing by any student was 21.88% (14 points out of 64 items) on test 1. The maximum amount of points lost because of answer changing was 10% (3 points out of 30 items) which occurred on test 3. On average however, the students managed to gain 1.58% on their final number-correct test scores. The effect sizes of the grade changes were also calculated on the three tests.
Table 1. Examinee’s item changing patterns across all three tests
Max Mean SD % of change Test 1 Wrong-to-right changes (%) 21.88 3.22 3.35 48.33 Wrong-to-wrong changes (%) 14.06 2.25 2.51 42.85 Right-to-wrong changes (%) 10.94 1.30 1.90 32.37 Overall changes in item
responses (%) 31.25 6.67 5.86 -- Test 2
Wrong-to-right changes (%) 10.00 1.34 2.10 29.80 Wrong-to-wrong changes (%) 21.25 2.63 3.15 69.36 Right-to-wrong changes (%) 6.25 0.53 0.98 21.62 Overall changes in item
responses (%) 35.00 4.50 4.54 -- Test 3
Wrong-to-right changes (%) 23.33 3.89 4.10 46.27 Wrong-to-wrong changes (%) 16.67 2.24 3.22 45.76 Right-to-wrong changes (%) 16.67 2.28 2.99 42.48 Overall changes in item
responses (%) 46.67 8.42 7.05 -- Pooled
Wrong-to-right changes (%) 23.33 2.74 3.39 42.40 Wrong-to-wrong changes (%) 21.25 2.39 2.96 40.53 Right-to-wrong changes (%) 16.67 1.30 2.16 17.07 Overall changes in item
responses (%) 46.67 6.39 6.01 --
In terms of the percentage correct scores, the effect sizes were all small. The effect size for test 1 was d1=0.18, for test 2 d2=0.12, and for test 3 d3=0.11. When taking into account each of the three tests separately (Table 2), one can see that the patterns of change are quite similar on the three tests. 2
The relationships between the examinee ability estimates as well as their answer changing patterns are presented in Table 3. The results are presented separately for each test, although the pattern of results is quite consistent. As expected, the largest correlations were between the ability estimates of the examinees before and after review. The interesting aspects of this table however, is the relationships between ability estimates and the percentage of total changes that each examinee made on their test. More specifically, in all
2
Since Conquest was implemented by setting the mean theta to zero, though, it was not appropriate to compare the students’ logit scores before and after review since any such changes could be masked by the change in the b-parameters.
Practical Assessment, Research & Evaluation, Vol 20, No 3 Page 5 Papanastasiou, Item parameter shifts
three test there were no statistically significant correlations between the examinee’s final test scores and the percentage of answers that they changed. This indicated that there were no major differences between high and lower achieving examinees in terms of the number of answer changes that they performed. However, higher achieving examinees were more likely to make wrong-to-right answer changes on test 1 (r=0.272, p<0.01), and test 3 (r=0.224, p<0.01), while lower ability examinees were more likely to make wrong-to-wrong answer changes (= -0.131, p<0.01) on test 1 and test 3 (r= -0.189, p<0.01). Although the size of the correlations is small, these correlation patterns
are similar when taking into account the examinee’s final number correct scores. However, these patterns of relationships were not found on test 2.
Item parameter shifts
There were also a number of changes in the estimation of the item difficulty parameters before and after review. Although the majority of the items had an increase in their p-values, there were also 6 items whose p-value decreased after review. Three of those items were in test 1, one item was in test 2, and the other two items were in test 3. There were also 7 items in which no change occurred in their p-values (5 in test Table 2. Percentage correct score comparisons before and after review by tests
Mean S.D.
Test 1 2 3 1 2 3
After review 54.16 59.93 62.19 10.93 10.34 14.31 Before review 52.29 58.64 60.61 10.25 10.39 14.13 % of grade change 1.87 1.29 1.58 3.14 2.38 4.29
Table 3. Pearson correlation coefficients of ability estimates and answer changing patterns
T es t P er ce n ta ge c o rr ec t gr ad e-af te r re vie w P er ce n ta ge c o rr ec t gr ad e-b ef o re re vie w N u m b er o f an sw er c h an ge s (% ) T o ta l p er ce n ta ge o f an sw er ch an ge s W ro n g-to -W ro n g ch an ge s R ig h t -t o -W ro n g ch an ge s
1 Percentage correct grade-before review .958*
Percentage of number correct difference .354* .071
Total percentage of answer changes .071 -.061 .444*
Wrong-to-Wrong changes -.131* -.171* .105* .740*
Right-to-Wrong changes -.099 -.041 -.211* .701* .418*
Wrong-to-Right changes .272* .040 .814* .828* .338* .385* 2 Percentage correct grade-before review .974*
Percentage of number correct difference .092 -.137*
Total percentage of answer changes .006 -.132* .602*
Wrong-to-Wrong changes -.083 -.181* .427* .811*
Right-to-Wrong changes .083 .084 -.008 .508* .104*
Wrong-to-Right changes .098 -.055 .664* .708* .205* .475* 3 Percentage correct grade-before review .955*
Percentage of number correct difference .190* -.111
Total percentage of answer changes .063 -.005 .227*
Wrong-to-Wrong changes -.189* -.167* -.080 .588*
Right-to-Wrong changes .046 .167* -.400* .702* .212*
Wrong-to-Right changes .224* .000 .745* .744* .069 .309* * Correlation is statistically significant at the 0.01 level (2-tailed).
1, 1 in test 2, and 1 in test 3). About fifteen percent of the items had no change in their p-values, while 77.0% of the items became easier. The change in p-values ranged from -0.03 (on test 3) to 0.25 (on test 1). Overall, the items decreased in difficulty after review, although these changes were quite small. More specifically, the average percentage correct (p-value) of the items increased by 0.016 after review (Table 4). These changes were consistent across all tests. The differences in the p-values before and after review were statistically significant when a dependent samples t-test was performed (t173=9.35, p=0.000), although its effect size d=0.071 was minute.
Table 4. Item difficulty comparisons before and after review
P-values Minimum Maximum Mean SD
Test 1 After review 0.02 0.90 0.54 0.23 Before review 0.02 0.88 0.53 0.23 Change -0.01 0.25 0.02 0.03 Test 2 After review 0.27 0.94 0.60 0.16 Before review 0.25 0.94 0.59 0.16 Change -0.01 0.04 0.01 0.01 Test 3 After review 0.35 0.94 0.62 0.18 Before review 0.34 0.91 0.61 0.17 Change -0.03 0.06 0.02 0.02 Pooled After review 0.020 0.940 0.583 0.190 Before review 0.020 0.940 0.567 0.190 Change -0.030 0.250 0.016 0.023 b-parameters Test 1 After review -2.14 4.24 -0.05 1.25 Before review -1.97 4.23 0.05 1.23 Change -1.10 0.09 -0.10 0.16 Test 2 After review -2.92 2.95 -0.04 1.17 Before review -2.77 2.88 0.04 1.14 Change -0.26 0.10 -0.08 0.07 Test 3 After review -2.22 1.42 -0.05 0.99 Before review -1.81 1.44 0.05 0.92 Change -0.51 0.18 -0.10 0.14 Pooled After review -2.920 4.240 -0.044 1.164 Before review -2.770 4.230 0.044 1.136 Change -1.100 0.180 -0.088 0.121
The b-parameter estimates showed similar patterns of shift across all tests. The average change in the b-parameter was -0.088, which ranged from -1.10 (on test 1) to 0.18 (on test 3). There were 12.6% of the items
that obtained higher b-parameters after review; 1.1% of the parameters had no change, while 86.2% of the b-parameters decreased after review indicating that the items became easier. These differences in the b-parameters were also statistically significant when a dependent samples t-test was performed (t171=11.723, p=0.000). However, its effect size was too small to be have any substantial effect d=0.08.
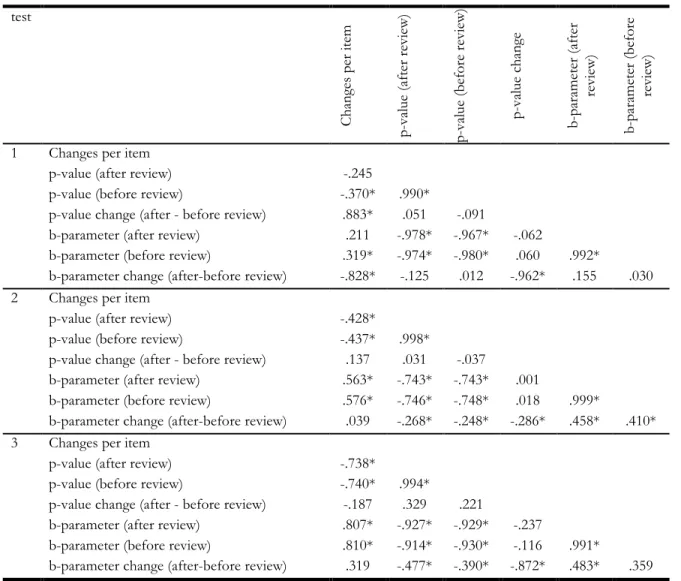
Table 5 includes the magnitude of the correlations that were performed to determine the types of items the students chose to change their answers to. Overall, the percentage of changes that were made to each item was significantly correlated with the difficulty of the items. The responses to more difficult items were changed more frequently than the responses to the easier items on all three tests. These correlations were statistically significant when taking into account both, the b-parameters and p-values, before and after review. However, the correlations were slightly higher with the b-parameters as opposed to the p-values. In addition, the correlations were slightly higher before review as opposed to after review.
Figure 1 graphically represents the b-parameter values changes (b before review –b after review) in relation to the b-parameter values before review. The general pattern that appears in the scatter plot is that in general, the b-parameters become larger after review. However, the amount of change is slightly smaller for the easier items compared to the more difficult items. Moreover, one should also notice that item review took place throughout all the spectrum of b-parameters that were used in this study.
Figure 1. Scatterplot of the amount of change in b-parameter size by b-b-parameter value (before review)
Practical Assessment, Research & Evaluation, Vol 20, No 3 Page 7 Papanastasiou, Item parameter shifts
Effects of item review and b-parameter
shifts
An attempt was made to determine the change in the information values provided by each student’s test score when using each set of b-parameters (after review -before review). So the information value for each student was calculated once using the b-parameters after review, and again with the b-parameters before review. The differences in these scores, when using the examinee’s final ability estimate θafter reviewr are presented in Table 6. The change in the information values on each student’s test scores using the b-parameters calculated before review, were higher than the ones calculated after review. The largest average
difference in the magnitude of the test information functions was in the examination consisting of 30 items, where the difference was -0.29. The smallest difference was in the 80-item test where the average difference was -0.11.
Table 6. Student’s final score information change using b-parameters after, and before review (using the examinee’s final θ estimate)
Test length Minimum Maximum Mean SD Test 1 – 64 items -0.410 0.378 -0.174 0.179 Test 2 - 80 items -0.242 0.227 -0.114 0.094 Test 3- 30 items -0.383 0.386 -0.292 0.122
In the second part of the analysis, both sets of b-parameters were used, as well as the examinee’s original ability estimate before review θ. The goal of this Table 5. Pearson Correlation of item parameter changes
test C h an ge s p er it em p -v alu e (a ft er r ev ie w ) p -v alu e (b ef o re r ev ie w ) p -v alu e ch an ge b -p ar am et er ( af te r re vie w ) b -p ar am et er ( b ef o re re vie w )
1 Changes per item
p-value (after review) -.245
p-value (before review) -.370* .990*
p-value change (after - before review) .883* .051 -.091
b-parameter (after review) .211 -.978* -.967* -.062
b-parameter (before review) .319* -.974* -.980* .060 .992*
b-parameter change (after-before review) -.828* -.125 .012 -.962* .155 .030 2 Changes per item
p-value (after review) -.428*
p-value (before review) -.437* .998*
p-value change (after - before review) .137 .031 -.037
b-parameter (after review) .563* -.743* -.743* .001
b-parameter (before review) .576* -.746* -.748* .018 .999*
b-parameter change (after-before review) .039 -.268* -.248* -.286* .458* .410* 3 Changes per item
p-value (after review) -.738*
p-value (before review) -.740* .994*
p-value change (after - before review) -.187 .329 .221
b-parameter (after review) .807* -.927* -.929* -.237
b-parameter (before review) .810* -.914* -.930* -.116 .991*
b-parameter change (after-before review) .319 -.477* -.390* -.872* .483* .359 * Correlation is statistically significant at the 0.01 level (2-tailed).
analysis was to examine the change in information values between the following: a) each student’s score information value when using their final test score with the b-parameters after review, and b) each student’s score information value when using their original test score as well as the b-parameters before review. In this case, the magnitude of the difference in the score information values was even larger. The largest difference was in the examination consisting of 30 items, where the difference was -0.37. The smallest difference was in the 80-item test where the average difference was -0.30 (Table 7).
Table 7. Test information change using b-parameters after, and before review (using the examinee’s θ estimate before review)
Test length Minimum Maximum Mean SD Test 3- 30 items -1.956 0.691 -0.367 0.320 Test 1 – 64 items -3.529 1.178 -0.341 0.571 Test 2 - 80 items -3.915 1.782 -0.300 0.632
Discussion
The purpose of this study was to examine the answer changing patterns of students while taking paper-and-pencil multiple choice exams, and to examine how these changes affect the estimation of item difficulty parameters, the test score information values, as well as the examinee’s final ability estimate. The results of this study were consistent with the previous literature (Geiger, 1990; Vispoel, Hendrickson & Bleiler, 2000; Revuelta, Ximenez & Olea, 2003). The great majority of the students (85.9%) chose to change at least one of their answers, while the majority of the changes were from wrong to right answers. On average, each student made 6.39% changes to their answers on the test, and gained 1.58% on their final number-correct test scores, or 0.09 logits on their θ estimates.
Also consistent with the prior literature is the fact that higher achieving students gained more from answer changing compared to their lower achieving counterparts (Geiger, 1990; Vispoel, 1998b). The interesting result of this study however, is that there were no major differences between high and lower achieving examinees in terms of the number of answer changes that they performed. This might indicate that by examining the data more closely, higher achieving examinees were more likely to make changes that
would increase their test scores by making wrong-to-right changes. However, lower achieving examinees were more likely to make wrong-to-wrong changes that didn’t affect their final scores in any way.
The item difficulty parameters also had changes in their estimates before and after review. Overall, the majority of the items decreased in difficulty after review, although these differences were small. This is in accord with the hypotheses proposed by Olea, Revuelta, Ximenex & Abad, 2000) who stated that item pools that are calibrated after item review will show a decrease in their difficulty. However, according to Olea et. al, this decrease in difficulty might be due to the increase in testing time that is needed in order to perform item review. In the current study though, no additional time was administered to the students. Therefore, it would be more correct to state that the item pool appears to be more difficult before item review is permitted. After the students have the opportunity to review their answers though, the item pool obtains its final form based on the student’s reviewed and final responses.
An examination of the patterns with which the item parameters changed after review also produced some interesting results. More specifically, the percentage of changes that were made to each item was significantly correlated with the difficulty of the items. This indicated that the responses to more difficult items were changed more frequently than the responses to the easier items. These results have important consequences for the administration of tests. First of all, one cannot assume that the item parameters remain the same before and after review. Consequently, it is not always appropriate to use item parameters that have been calibrated after review to situations where item review is not allowed, or vice versa. By not taking into account the ways in which the item parameters change, it is likely that higher ability examinees will be administered items that are not well targeted to their ability levels, which in turn could reduce the efficiency of a test.
Overall, the results of this study have shown that item review does produce some small changes to the examinee ability estimates and to the item difficulty parameters. When taking each unit independently (e.g. each item change, or each b-parameter change), the changes that are produced before and after review are minute, and might appear as nonsignificant. When adding up all of these changes however, these
Practical Assessment, Research & Evaluation, Vol 20, No 3 Page 9 Papanastasiou, Item parameter shifts
differences add up to much larger numbers. For
example, the average change in the test information is about 0.192 when taking into account the b-parameters difference before and after review. However, when taking into account the change in the b-parameters, as well as the change in the estimation of the examinee’s ability estimates, the average change in the test information value is 0.335. These are quite large differences that should not be ignored. In addition, these effects are more pronounced in shorter tests than in longer ones.
A result that is unique in this study is that the pattern of answer changing was quite different in the two midterm exams compared to the final cumulative exam which was longer in length. For example, the students tended to make more wrong-to right answer changes on the midterm exams, and more wrong-to-wrong changes in their final exam. In addition, in the final exam there was no consistent relationship between the types of answer changes that the students made and their ability estimate (although these relationships did exist in the two midterm exams). These differences between the midterm and final exams need to be looked further into to determine the reason that they exist, as well as their consequences.
With the recent advances in the area of measurement today, test developers are trying to produce the necessary conditions that will permit them to obtain examinee ability estimates that are as accurate as possible. Many of the parameters that are taken into account include the use of various item and ability estimation techniques, the use of various test lengths, and the use of item pools of varying characteristics. However, not enough attention has been paid to the ways in which item review affects the item parameters. In addition, no other studies have examined whether items that have been calibrated based on two separate testing conditions are interchangeable. This study has identified that item review does affect the calibration of the item difficulty parameters to a small extent, which in turn affects the estimation of the examinee ability, as well as the test information value. Therefore, test developers and administrators need to also take the testing conditions into account in order to truly be able to administer items with maximum information that are matched to each examinee’s ability estimate. This study has served as a first attempt to examine the effects of item review on the item characteristics. However more research needs to be performed on the
subject to examine whether the results of this study are generalizeable to other datasets. It is also imperative to look further into the differences in the students’ responses on midterm and final exams, as well as examine these effects on large scale computerized tests where answer changing patterns can be tracked more clearly.
References
Center for Educational Testing and Evaluation (2005). Kansas Computerized Assessment (KCA). Retrieved November 16, 2005 from http://kca.cete.us/kca.html
Geiger, M. A. (1990). Correlates of net gain from changing multiple-choice answers: Replication and extension. Psychological reports, 67, 719-722.
Geiger, M. A. (1991). Changing multiple-choice answers: Do students accurately perceive their performance? Journal of experimental education, 59, 250-257.
Harvill, L. M., & Davis III, G. (1997). Medical student's reasons for changing answers on multiple-choice tests. Academic medicine, 72(10), 97-99.
Lunz, M. E., Bergstrom, B. A., & Wright, B. D. (1992). The effect of review on student ability and test efficiency for computerized adaptive tests. Applied psychological measurement, 16 (1), 33-40.
Olea, J., Revuelta, J., Ximenez, M. C., & Abad, F. J. (2000). Psychometric and psychological effects of review on computerized fixed and adaptive tests. Psicologica, 21, 157-173.
Papanastasiou, E. C. (2001). A ‘Rearrangement Procedure’ for administering adaptive tests when review options are permitted. (Doctoral dissertation, Michigan State University, 2001). Dissertation Abstracts International, DAI-A 62/07, 2397.
Papanastasiou, E. C. (2005). Item review and the
rearrangement procedure. Its process and its results. Educational research and evaluation, 11, 303-321. Poggio, J., Glasnapp, D., Yang, X., Beauchamp, A., &
Dunham, M. (2005). Moving from paper-and-pencil to online testing: Findings from a state large assessment program. Paper presented at the annual meeting of the National Council of Measurement in Education, Montreal, Canada, April 2005.
Reckase, M. D. (1975). The effect of item choice on ability estimation when using a simple logistic tailored testing model. Paper presented at the annual meeting of the American Educational Research Association, Washington, D.C.
Revuelta, J., Ximenez, M. C., & Olea, J. (2003). Psychometric and psychological effects of item selection and review on computerized testing.
Educational and psychological measurement, 63, 791-808.
Schwartz, S. P., McMorris, R. F., & DeMers, L. P. (1991). Reasons for changing answers: An evaluation using personal interviews. Journal of educational
measurement, 28, 163-171.
Stocking, M. L. (1997). Revising item responses in computerized adaptive tests: A comparison of three models. Applied psychological measurement, 21, 129-142.
Stone, G. E., & Lunz, M. E. (1994). The effect of review on the psychometric characteristics of computerized adaptive tests. Applied measurement in education, 7(3), 211-222.
Vispoel, W. P. (1998). Review and changing answers on computerized adaptive and self-adaptive vocabulary tests. Journal of educational measurement, 35, 328-347.
Vispoel, W. P., Henderickson, A. B. & Bleiler, T. (2000). Limiting answer review and change on computerized adaptive vocabulary tests: Psychometric and attitudinal results. Journal of educational measurement, 37(1), 21-38.
Wagner, D., Cook, G., & Friedman, S. (1998). Staying with their first impulse? The relationship between
impulsivity/reflectivity, field dependence/field
independence and answer changes on a multiple-choice exam in a fifth-grade sample. Journal of research and development in education, 31 (3), 166-175.
Waddell, D. L. & Blankenship, J. C. (1994). Answer changing: A meta-analysis of the prevalence and patterns. The journal of continuing education in nursing, 25, 155-158.
Wu, M. L., Adams, R. J., & Wilson, M. R. (1998). ACER Conquest. A generalized item response modeling software [Computer software]. Melbourne: Australian Council for Educational Research.
Citation:
Papanastasiou, Elena C. (2014). Psychometric changes on item difficulty due to item review by examinees. Practical Assessment, Research & Evaluation, 20(3). Available online: http://pareonline.net/getvn.asp?v=20&n=3
Author: Elena C. Papanastasiou 46 Makedonitissas Ave., 2414 Engomi, Nicosia CYPRUS