Effects of the budgetary process on SME’s performance: An Exploratory
study based on Selected SME’s in India
Jamil Mulani
School of Business Management, Dalian University of Technology, Dalian, Liaoning, China, Guotai Chi
Professor –School of Business Management, Dalian University of Technology, Dalian, Liaoning, Jun Yang
Surrey Business School, University of Surrey, Surrey, United Kingdom (UK), GU2 7XH.
ABSTRACT
This research study is intended to find out the impact of budgeting on the performance of small and medium enterprises of India. Three major areas of the study are budgeting in SMEs, performance measurement in SMES and Small and Medium Enterprises. The budgeting process is explained and analyzed from the point of view of budgetary planning, budgetary sophistication and control. A sample of two hundred and sixty eight firms is selected from SME sector of India. The sample was selected from three districts of Mumbai, Pune and Solapur. Impact of budgeting on firm performance in these firms was tested through detailed analysis. Questionnaires and other statistical tools were used for analysis of the problem statement. A positive relationship between firm performance and budgeting process is found in this research study. The performance of Small and Medium Enterprises of India is further affected by the characteristics of the budget goals. The results add to the fact that higher performance can be achieved through more clear goals. Astonishingly budget goals that are difficult but achievable motivate employees to achieve budget goals. Moreover tight but achievable goals also increase employee’s motivation in achievement of budget objectives and it improved the performance of Small and Medium Enterprises of India. Another important result is that formal and tight control mechanism of control for budgetary process also tends to increase firm performance in the SME sector of India. It was very interesting to find out that budgetary process have greater impact on the performance of the firm in SME sector as compared to the budgetary control process. Furthermore budgeting planning affects the sales growth of firms in Small and Medium Enterprises more than the budgetary control phenomena. But the impact of budgetary planning on sales becomes very weak and in turn budgetary control strongly affects the profit in small and medium enterprises. Sales and budgetary sophistication have a statistically insignificant relationship and budget sophistication relationship with profit is even negative. The sophistication of budgetary tools includes acquiring and installation of costly financial modeling software, training and expensive training and follow up mechanism. This needs a huge investment which is difficult for Small and Medium Enterprises to acquire that much huge investment. If firm goes for these huge investments this increase in their expenses will decrease their net profit value. Budgetary goal clarity has a statistically insignificant relationship with the employee’s motivation level and further the budget goal difficulty and employee’s job involvement also shows a statistically insignificant relationship. As far as the firm size is concerned it affects sales insignificantly, however it impacts profit of the firm in SMEs sector. Medium sized firms showed a greater growth in their sales as compared to the smaller sized firms.
Key Words: Small and Medium Enterprises, Budgeting, Firm Performance, Budget Control
1. Introduction
Budgeting is the set of the activities of forecasting the financial demands of company in the future (Garisson, et al., 2003). A budget is a comprehensive plan which depicts the information about acquiring and using resources over a certain period of time. During the Budgeting process the anticipated levels of sales, cash flows and probable costs are assigned by the management (Horngren, 2006). Past research has mainly focused on the budgeting functions of the large corporations that are publicly listed in the developed economies. For instance, Dugdale (1994) reported that UK companies experienced eminent gains by careful planning of their budgetary functions and majority of the Australian companies have systemized and elaborated their planning processes (Bonn and Christodoulou, 1996). In addition or it, it is also determined that strategic planning positively influences the performance of SMEs (e.g. Aram & Cowen, 1990Knight, 1993), but considerable attention is not paid to explore the influence of budgeting process on the performance of SMEs (Wijewardena& De Zoysa, 2001) which makes it an underdeveloped research area that warrants more attention. Budgeting process is adopted differently in firms depending upon their size and organizational diversity (Merchant, 1981). The
budgeting process in the SMEs should be contrastingly different as compared to the large corporations due to their smaller size and restrained resources. Therefore, the aim of present study is to profoundly examine the relationship between budgeting process and performance of SMEs.
2. Literature review 2.1.SME sector in India
Indian SME sector is central to her economy imparting 40% of exports and adding up to 45% of industrial production. Moreover it provides employment opportunities to approximately 60 million people and yearly creates 1.3 million jobs in India. According to the figures rendered by the Europe India SME business council, there are around 30 million small and medium enterprises in India rapidly growing at 8% annual rate and they are estimated to produce jobs for millions of people in the country (Europe India SME business council). Growth of Indian SME’s has made this sector very lucrative for the foreign and domestic investors. The cutting edge innovative technologies have assisted these small and medium entrepreneurs to add substantial value to their products. The barriers to trade have significantly lessened as different trade portals and directories have made easier to establish contacts between buyers and sellers and thus paved the way for trade to occur.
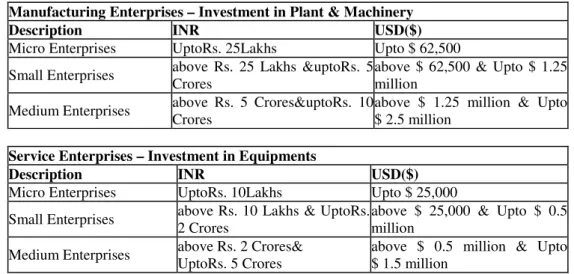
With strong backing from the government, Indian SME sector has excellent prospects to show unparalleled growth rates in the years to come. However industry experts and financial advisors believe that regardless of this phenomenal growth rate, the potential of Indian SME sector has not been fully exploited. The categorization of the small and medium enterprises according to the MSME India (Micro small medium enterprises) is shown in the table 1 below.
Table 1: Indian MSME categorization
Manufacturing Enterprises – Investment in Plant & Machinery
Description INR USD($)
Micro Enterprises UptoRs. 25Lakhs Upto $ 62,500 Small Enterprises above Rs. 25 Lakhs &uptoRs. 5
Crores
above $ 62,500 & Upto $ 1.25 million
Medium Enterprises above Rs. 5 Crores&uptoRs. 10 Crores
above $ 1.25 million & Upto $ 2.5 million
Service Enterprises – Investment in Equipments
Description INR USD($)
Micro Enterprises UptoRs. 10Lakhs Upto $ 25,000 Small Enterprises above Rs. 10 Lakhs & UptoRs.
2 Crores
above $ 25,000 & Upto $ 0.5 million
Medium Enterprises above Rs. 2 Crores& UptoRs. 5 Crores
above $ 0.5 million & Upto $ 1.5 million
Description: The categorization of the small and medium enterprises according to the MSME India (Micro small medium enterprises)
Micro small and medium enterprises are globally believed to fuel the economic development of the country and advance the possibilities of equitable growth. The fundamental benefit of this sector is the provision of employment opportunities at a very low cost of capital. Most of the large enterprises are not economically efficient to match the labor intensity of micro small and medium enterprises. More than 90% of the enterprises in most of the countries belong to the category of micro, small or medium enterprises and offer bulk share of the employment opportunities and majority of the industrial and economic output. Similarly in India MSME sector is major contributor of recent economic uplift of India. Despite of recent recessions, MSME sector in India show casted tremendous endurance characteristics and continued showing promising growth and returns.According to the statistics reported by the fourth census of MSME India, over 26 million enterprises are currently operating in India while employing approximately 60 million people. The broad range of industrial products produced by the MSME sector includes beverages, wool, synthetic products, tobacco products, wood products, electronics appliances, machineries, paper products, textiles, furniture, printing and a prominent number of service industries.
2.2.Performance Measurement in SMEs
The financial aspects of the performance have been employed to a greater extent in order to gauge the performance of the businesses not in SMEs but in also larger firms as they manifest the accomplishment of the economic objectives of the firm (Murphy, et al. 1996). . A great deal of accounting literature acknowledges the underlying benefits of financial measures as objective measurement systemcertain to provide a brief view of the achievement of the intended purpose that directly relates with performance of the organization and practicability of its strategies and plans (Hopwood, 1972; Ross, 1994; Kaplan & Atkinson, 1998; Lau &Sholihin, 2005). Use of financial indicators as a measure of organization’s performance is conventionally most commonly exercised accounting tool as it based on the principle of profitability which is one of the significant measureable goal of a firm (Kaplan and Atkinson, 1998).
There are several financial indicators that are used as evaluation criteria in assessing the financial performance like profitability, sales revenue, growth and efficiency (Robinson, 1983; Murphy et al., 1996) The financial ratios employed in this regard are return on assets, return on sales, net profit margin, market share growth, return on investment and change in net income among others (Murphy et al., 1996)
2.3 The Impact of Firm Size and Ownership on budgeting process and Performance
The process of budgeting has many uses across companies (Merchant, 1981). Context in which companies set the budget can best explain the variation in the budget process, for example, firm’s size, and organizational structure and diversification (Fisher, 1996). Reid and Smith (2000) determined that the theory of contingency has been used for a long time in research to explain how certain conditions play an important role in the formation of a company. The earliest work in this field goes back to the studies by Burns and Stalkerin (1961). It emphasizes the impact of technological uncertainties, as one of the contingency variable, to play a significant part in the formation of organization. According to Hayes (1977), three variables that act as contingency include a dynamic work environment, interdependence sub - unit, and mode of action are important specifications to decide on management accounting practices to subunits across the organization. More recent work by Anderson and Lanen (1999) found that both national culture and competitive strategy have a significant impact on the management accounting systems. Firm size is regarded as one of the contingent variables and budgeting literature has also focused on comparing budget process variables and their use in large enterprises to small businesses. Merchant (1981) suggested that more diversified companies tend to use more sophisticated formal budget. In contrast, smaller companies tend to rely lesser on the budgeting. Second, the trader indicates that the budget, including the development of a more formal and detailed budget process, seems to have a stronger relationship for good performance in large companies than in smaller firms. Joshi et al. (2003) suggested that large companies tend to carry a detailed budget process and achieve better performance. Therefore, the size and complexity of the company and its operations generally affect the nature of the budget process that should be adopted and ultimately affect the performance of the company. Moreover, the size of the company is also one of the variables that are generally used in quantitative research. According to Wijewardena and Zoysa (2001) budget planning and budget control differs between small and medium enterprises.
Empirical research has dealt extensively on the relationship between the ownership structures of the companies, however, mixed research results are mostly reported but some positive research outcomes were also evident. Borcherding, et al (1982) analysis found out overall differences in efficiency between the public and private sectors in the five countries, which is to say that most of the findings are consistent with the idea that public companies have high cost structures. Lauterbach and Vaninsky (1999) studied the effect of ownership structure on the performance of companies and found that the institutions with disperse ownership and non-owner managers enhances the performance of the companies as compared to the family businesses run by owners and corporate Owner Director. However, some research results show the negative impact of ownership on performance. Millward and Parker (1983) made a comparison on the economic efficiency of public and private institutions and came up with conclusions that public institutions are less cost effective than private companies. Eastern and Rosevear (1999) disapprove the notion that private ownership is linked with better performance. Mixed research results, as shown above, encourage researchers to ascertain whether the ownership structure effects on the performance of small and medium businesses in India or not. The impact of ownership on the budget process is not profoundly related in the existing research, but some empirical research in the past affirms the impact ownership on management accounting system design. Firth (1996) investigates the dissemination of managerial accounting procedures in Chinese companies and conducted a survey to equate the execution of management accounting techniques between state-owned companies and joint ventures in China. Firth research shows that Chinese companies which operate a joint venture with foreign partners integrate more detailed accounting techniques and their management is better than state-owned enterprises without foreign joint venture partnership operations. As the review of the literature show that ownership structure and size of the firms have
influential impact on the management accounting of the firms, so we hypothesize that;
Hypothesis 1a1: Owner ship structure has a significant impact on the budgeting process of Indian SME’s Hypothesis 1a2: Owner ship structure has a significant impact on the performance of Indian SME’s Hypothesis 1b1: Size of the firm has a significant impact on the budgeting process of Indian SME’s Hypothesis 1b2: Size of the firm has a significant impact on the performance of Indian SME’s
2.4 The Formal Budgeting Process
Wijewardena and DeZoysa (2001) characterized the formal process of budgeting in SME’s by two aspects, i.e. a formal process of budget planning and a formal process of budgetary control. They further categorized the firms into three exclusive categories. The firms in the first category do not use any type of written budget. Those in the second group prepare simple budgets with respect to few areas of operation representing a less comprehensive planning process. In the third group are firms using detailed budgets with respect to many different areas of operation. These firms were considered to be engaged in a more comprehensive planning process. In addition, budgeting as management control is also emphasized in their model. Then in terms of budgetary control, the firms falling into the second and third categories are re-classified into three additional categories. Firms in the first category do not calculate differences (variances) between actual performance and budgeted performance. Firms in the second category occasionally use budget variances with respect to a few specific items for taking suitable corrective action. The third category represents firms that use budget variances regularly with respect to many different items of operating activities, revenues and cost for taking appropriate corrective action. Thus, the indicator of a formal budgeting process in Wijewardena & DeZoysa’s (2001) model is the presence of written budgets, the specification of operating budget, and the frequency of calculating budget variances and taking corrective actions.
As proposed by Wijewardena and DeZoysa (2001) the formal budget planning and the formal budget control have two important facets of the regular budget process by SMEs. They classified three special types of firms. In first category, firms do not use any type of budget. In the second group, they represent a less comprehensive planning process with respect to a few areas of operation i.e. simple budgeting. In the third group many different areas of operation are included with regard to the detailed budget plan used by the firms. These firms engage in a more comprehensive planning process. In addition, the administrative control of the budget is focused in the third category in terms of budget control. The firms in the second and third categories are classified into three additional levels. In the first type of firms, the differences between actual performance and budget performance is calculated. In second type of firms appropriate corrective actions are used in regard to certain items of budget variances. The third type represents firms that use corrective actions that are appropriate to the operating activities, investment income and with respect to many different objects that use regular budget variances. Thus, according to the Wijewardena and DeZoysa 's (2001) model, the indication of the regular budget process includes written budget , operating budget details and the calculation of budget variances and taking corrective measures is the presence of variation .
Thus we hypothesize that,
Hypothesis 2: the more formalized the budgeting process, the better the performance of the firms.
In the aforementioned hypothesis, the independent variable is the formal budgeting process and the dependent variable is the performance of the firm. The performance of the firm can be gauged by financial indicators and the budgetary performance. It is expected that formal budgeting process positively influences the performance o the firms in the small and medium enterprises of India.
2.5 Budgetary Control
Garisson, et al., (2003) determined that budget variance takes into account the deviation between the actual expenses and comparable budgeting figure. It can be further divided into favorable and unfavorable deviations. If actual revenues exceed the projected revenue, the variance is favorable. It is unfavorable when budgeted figures are more than the actual revenues. In case of expenses, an unfavorable deviation occurs when there is a decrease in the operating income relative to the budget; a favorable deviation takes place when operating income relative to the budgeted amount is increased. In such circumstances a system is regarded as efficient and effective system (Friedlob & Plewa, 1996). Budget variances may be an outcome of imprecise data, ascending costs and uncertain conditions in the production department, random events and may be consequence of inefficient
are appropriately met and company stick to its plan and automatic regulator monitor the system continuously and variations from the predetermined level are identified and corrective actions are taken in case of deviations from the predetermined level. The budget system can conduce the control usage but it cannot itself attain the control function. This is the reason there is convergence between control and budget.
Figure2.3 The process of budgetary control
Feedback
Feedback
Source: Glynn, et al., 2008
As illustrated in the figure, we can ascertain that the programmable inputs as shown in the budget are equated to the results of the current (i.e. the product) and the variations from the sought after inputs are discovered. The budgetary control model not only asserts the significance of feedback management which includes the restorative actions and required explanations of budgetary deviations, but also a comparison of real results with the budget in order to recognize the deviations.
Therefore, it is very essential to measure true performance against planned performance at times and take steps to correct the negative things that cause deviations from the planning perspective (Koontz and Weihrich, 1998). According to Merchant (1985), the performance of the managers ameliorate when a justifiable explanation for the negative budget deviations is given by managers to their superiors and when managers are actually required to do that, it is eventually in the best interest of the firm (McWatters (2008). The size and comprehensiveness of the company’s operations effect on the process of budgeting. In this study the budgeting process basically defined as a planning and control tool. Thus we hypothesize,
Hypothesis 3: the more formalized the budgetary control, the better the firm performance;
2.6 Budget goal clarity and difficulty
Apart from the degree of budgeting planning and budgetary control processes as we explored above that might have an optimistic effect on organizational performance, the earlier literature on goal setting (Kenis, 1979; Hirst, 1981; Hirst, 1987; Dunk, 1994; Hirst, et al. 1999; Yuen, 2004) has long emphasized the helpful outcome of budget goals on promoting endorsing performance in an firm. An earlier of huge work (Hirst, 1981; Ivancevich, 1976; Hirst, 1987,Yuen, 2004) examine that the characteristics(feature) of the budget goal from two (2) aspects and show their potential(possible) link with performance. These two (2) aspects are: goal clarity and goal difficulty. “Goal clarity mentions to the degree of which budget goals are specified exactly and evidently, and are understood by those who are responsible for meeting them” (Yuen, 2004). Investigators trust that manager’s doing work on that with uncertain goals are faced with sophisticated and innovative in relations to goal achievement, whereas pure goals decrease uncertainties in the budgeting process, which, in turn, will recover the performance of enterprises. Furthermore, understanding the motivational part of budget goals, previous work (Weingart, 1992; Yuen, 2004) also shows that clear goals encourage the performance of employee’s staff by advising they can do in the proper or good way. Some experimental study is having supported the optimistic effects of task-goal clarity on performance (Ivancevich, 1976; Steers, 1976; Imoisili, 1989,Locke& Schweiger; 1979) Example shows that “goal clarity can recover budgetary performance, while absence of clarity leads to misperception, stress, and disappointment amongst the workers”. So-called when budget goals are attained it means budget performance is attained or achieved have satisfactory change by the employees (Kenis, 1979). Hirst & Yetton (1999) and Weingart (1992) and also shows that the because of unclear goals can decrease the budgetary performance. In the other side, can differ from very loose and simply attainable goals tovery fitted and unattainable goals only because of budget goals. Problematic goals require more efforts, and possibly or conceivably more knowledge and skills. However, those goals which can easily be achieved with less energy, knowledge, and skills to attain. This shows that, the level of budget-goal difficulty may influence on the performance. Actually, empirical study shows that the comprehended budget goal difficulty and performance are positively related. (Ezzamel,1990; Hirst, 1981; Nouri 1998; Kenis, 1979; Locke & Schweiger, 1979; Mia,
Planned inputs
(the budget) Process
budget)
Output (Actual results)
Regular comparison of (budget and actual)budget)
1989).For example, Hirst & Lowy (1990) they found that difficult goals create sophisticated performance than setting particular moderate goals, particular informal goals, or too common goals. Kenis (1979) argues that managers can be motivated trough attainable and reliable budget goals and it is the most effective way to motivate to achieve these goals. If budget goals are too tight it adversely affects the performance of the managers and leads to higher job dissatisfaction. When goals are easy they tends to provide no incentives to motivate the mangers and thus the mangers do not peruse a higher level of performance. Hence it can be inferred from this study that more difficult and attainable budget goals tend to motivate mangers to higher performance.
Hypothesis 4a: the clearer the budget goals, the better the firm performance
Hypothesis 4b: the more difficult but attainable the budget goals, the better the firm performance;
2.7 Budgeting Sophistication
From literature review we know that the traditional accounting literature stresses (pressures) the practical and balanced roles in organization of the budgeting. They shows budgeting as a practical process to remitted and encourage to the rationality in the decision-making or as a practical device for handling with an objective domain and to sensibly with foster efficiency, order, and constancy (Covaleski, et al., 1986). Consequently, the intellectual level of budgeting decisions is depending on the degree of information accurateness. Merchant (1981), says that the acceptance of extra advanced budgeting, including more use of computer, practical workers, and economic modeling, improves the correct capability of budgetary plan, and in turn, results in advanced performance in the firms. Another study (Peel & Bridge, 1998; Farragher, et al., 2001) on capital budgeting also proposes that using sophisticated capital budgeting techniques progress the organizational performance. Peel and Bridge (1998) it shows that through an example, Small and Medium Enterprises that involve in extra sophisticated net current value capital budgeting techniques, have a reliable rises of firm performance. Such as, more empirical research is required to shows that the positive relationship between budgeting sophistication and performance. Also Wijewardena & De Zoysa’s model is the only framework in previous studies to expose the formal budgeting process and performance link in Small and Medium Enterprises, other dimensions that might lie in Small and Medium Enterprises budgeting process that may significantly influence on their performance also have to be conceived. This exploration, assistances the main task of this work, which concentrate on how budgeting process impacts Small and Medium Enterprises performance. Finally in this research, the author groups the simplicity and difficulty of budget-goal and more budgeting sophistication—these are the two extra dimensions into the prior research model as a complete definition of the formal budgeting process. Thus, we shall define the formal budgeting process in Small and Medium Enterprises as the comprehensiveness of the budgeting process from the four aspects. In the first part, in terms of budgeting planning, firms in the first group do not use any budgets to forecast and succeed their future actions. Firms in the second group make common budgets for some field of process. Finally in the last group are firms using complete budgets for many different extents of process. Then in the preceding part keeping in view the budget goal, budget clarity and budget difficulty as our variables the firms in second and third level of budget forecasting into three levels based on these variables. Firms with lowest budget clarity are grouped in first category, then firms with lower budget clarity are put in the 2nd level and then firm having maximum budget clarity are grouped in third level of the firm. The budget goal difficulty categorization it shows that: The firms setting up simply achievable goals are in the first level which shows that loose budget goal use; firms who use hard but achievable goals related to the second level; enterprises are highest level are those who use very difficult and unachievable budget goals. Thirdly, furthermore based on the budgeting sophistication, firms with a budget are more divided into three part and we can discuss sequentially first is which firms that use very less technical workers, computer, and financial modeling used in budgeting this is all related about low budgeting sophistication, second is which firms that can use as a modest practical workers, computer and financial modeling in budgeting and this shows that all related about middle level of budgeting sophistication And third is which firms that use more practical staff, computer and financial modeling in budgeting it shows that this is all related about high level of budgeting sophistication.
At the end of budgetary control, firms who practice budgetary planning are reclassified into three additional categories. From the first category actual performance and budgeted performance we cannot find the variances. From the second category few specific items and take suitable corrective action on the basis of occasionally use budget variances. From the third category of many different items of operating activities and take appropriate corrective action on the basis of firms uses budget variances regularly.
We assume that:
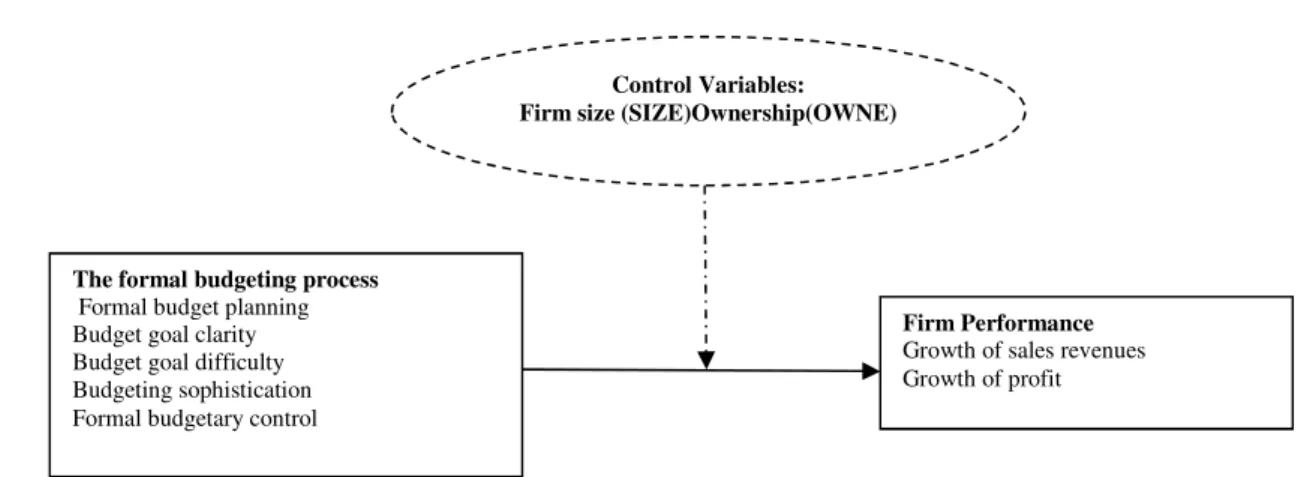
Figure 1 Conceptual model of studies
Figure 1 depicts the conceptual model. It represents the dependent, independent and control variables. The arrows are extending to show relationship of different variables The model of Wijewardena & De Zoysa’s (2001) is used for budgeting process of small and medium sized enterprises. The same model is used for Financial Control process. As far as these two features of formal budgeting processing are concerned we know both of these play an important role in determining the performance of the business enterprise. Particularly firms that have used a more comprehensive approach of budgeting processing show a higher performance depicted by higher growth in their sales than those having no on paper budget There is link between budget comprehensiveness and firms found by studies related to other than small and medium enterprises. As this particular study will be exploratory in its essence these prior studies can also be considered in this study. This study is intended to find out the answer of one of the basic question do SMEs performance is affected by budgeting processing in India. Three perspectives are used to design the research model. First formal budgeting processing is reproduced in a more detailed manner by adding more dimensions into it. Yuen 2004 conducted a research study about two important dimension of the subject matter. These include budget goal clarity and difficulty of budget goal two important feature of budget goal. This study found that despite the tightness of budget goals if the goal have clarity and they are attainable, it will motivate employees and thus an improved performance on the part of the firm and employees can be achieved. The budget goals clarity reduces the unnecessary bottlenecks and thus uncertainty is decreased that improves firm performance. The same relationship between firm performance, budget processing, budget goals clarity and difficulty is found out in numerous studies including Ivancevich (1976), Steers (1976), Imoisili (1989), Locke & Schweiger (1979), Mia (1989), Ezzamel (1990), Hirst & Lowy (1990) etc making it significant for further research. Numerous researches can be found in on the dimension of budget sophistication and firm performance. Some important studies in this regard include Merchant, 1981; Peel & Bridge, 1988; Edward, et al., 2001.According to these researchers if budgeting process are improved by using computers, technical staff and advance financial methods can lead to improved performance of the firm. Merchant, 1981 empirically found that trough modernization accurate budgets are achieved having an improved information accuracy. By studying the research work of Yuen’s (2004) and Merchant’s (1981) and overlapping the models of these studies with Wijewardena & De Zoysa’s model, we can provide a refined definition of budgeting process. We can infer then those budgeting processes include a formal planning process, goal definition in a clear way, budget sophistication and a formal mechanism of control for the whole budgeting processes. Then this whole concept is extrapolated to the SMEs and all these parameters are studied from the context of Small and Medium Enterprises. Furthermore it is encouraged by the blackness of data for SME sector. And due the fact that almost all studies of budgetary processing and firm performance are based on the large firms so this issue to be studied in small firms became necessary To study the dimensions of budget participation of employees this study adopt the model of Parker & Kyj’s (2006).Most of the contemporary studies on the performance studies have used managerial performance as the dependent variable. Several researches studies have used non-financial measures to measure the managerial performance. These two dimensions are discussed in the 2nd part of the model. In this study performance is then measured from the three significant perspectives discussed in the literature. These perspectives include financial performance, non-financial performance and the managerial performance. The theoretical framework in this study is derived from the combined models of several studies, including the formal budgeting process, budgetary participation, and the measurement of performance (Wijewardena & De Zoysa, 2001; Yuen, 2004; Merchant,
Control Variables: Firm size (SIZE)Ownership(OWNE)
The formal budgeting process
Formal budget planning Budget goal clarity Budget goal difficulty Budgeting sophistication Formal budgetary control
Firm Performance
Growth of sales revenues Growth of profit
1981; Parker & Kyj, 2006).
3 Methodology
India is one of the emerging countries situated in the south East Asia. In India at presently have 29 states/provinces and 7 areas. Then the federation is further sub-divided into administrative districts, tehsils & villages. The data for this study has been collected from the districts of Mumbai, Pune and Solapur. The reason for the selection of these districts is that these are located in the industrial areas of India and further they constitute extensive manufacturing firms and have higher labor and raw material intensity. Since, these districts are very big and have a large number of small and medium sized companies so it was almost impossible to select the data from all SMEs. However, it was tried to get the data from as many companies as possible. The data has been collected from the companies’ belonging to different industries particularly textile, computer manufacturing, construction, clothing etc. The owner, senior managers or financial managers were requested to provide us the required data.
The questionnaire regarding budget planning, control, and sophistication was formulated by using the questionnaires used by Yan Qi 2012, Kenis 1979 and Gorden 1978 and by adding some additional questions formulated by keeping in view the culture of the areas from where the sample has been collected. It has been tried to measure the performance of the firms through a questionnaire inquiring correspondents to tell us their sales growth in percentage terms and their profit growth rather than asking them the real numbers. It has been done to collect as realistic answer as possible because the correspondent hesitate to state their pure income because they consider that we may inform to the tax authorities who will disturb them by different means. Questionnaire were intelligently designed to include a wide set of open as well as closed end questions for a reliable response from the correspondents. As far as the open ended questions are concerned they were intended to be used to ask general information like name of company, its location, the name of the correspondent and the position of the correspondent of the company. Close ended questions are of different kinds like yes or no questions, some of them offer a list of answers and the correspondent is supposed to select one of them, some are like scale based. However, most questions use a 7 point rating scale the level of sophistication of budget and extent of budget control etc. Data was collected from 268 small and medium sized companies situated in the districts of Mumbai, Pune and Solapur and belonging to different industries like textile, electronics, construction, ceramics, plastic manufacturers, kitchen ware and printing sector registered with MSME. More than 80 firms from each district responded to the researcher. There were four main criterions which were used for the selection of the firm and those criterions are (i) all the firms were registered with MSME, (ii) the companies which were having less than 500 employees, (iii) firms having sales revenue below 3 million Indian rupees, and (iv) companies established at least 5 years ago. The questionnaires were distributed in person to each of the SME and were collected in person. The benefit of this exercise was that the authors briefed the respondents in person which resulted in minimal number of filling errors. The questionnaires were completed by owners, general managers, finance managers and officers who were having known how of the budgeting process of the company. Questionnaires were completed by managers, directors, owners, officers also employees of the companies. All of them have more or less budgetary responsibility during the budget setting. The questionnaires aim to inquire into the participants’ personal opinion about the formal budgeting process, budgetary participation, and the performance of the sampled firms.
4 Discussion and Analysis
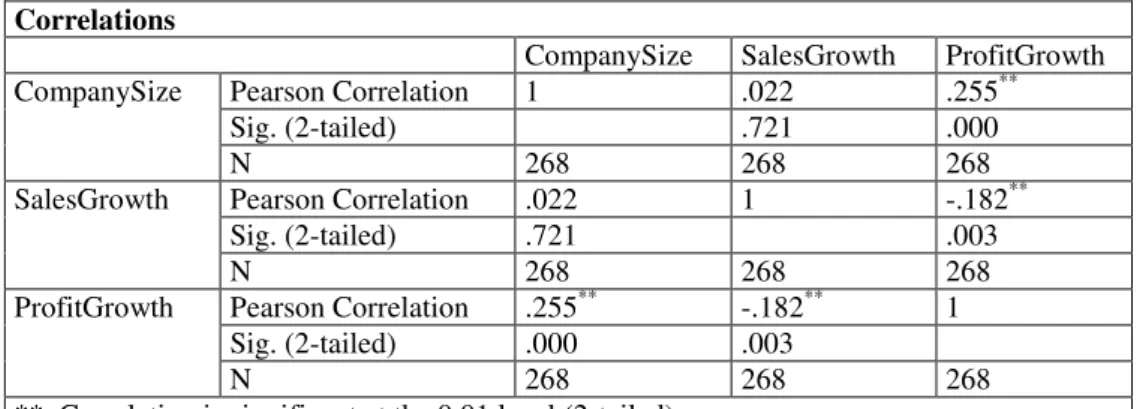
268 completed questionnaires were obtained giving us a response rate 89%. Interviewer administered questionnaire style ensured a high response rate for this studies. A total of 159 responses were collected from district of Solapur (59.3%), 68 (25.4%) from Mumbai district and 41(15.3%) from Pune district. A total of 140 responses were obtained from owners (52.2 %) , 86 senior managers (32.1 %) and 42 financial managers (15.7 %). The bigger the firm size, the more financial managers responded.In terms of business type, there are four types of business in the data, i.e., state-owned enterprise, private enterprise and joint-venture, firms. Strong positive relationship existed between company size and profit growth rate. As the size of the firms increased their profit growth rate also increased. The reason is that firms in their initial years are smaller in size and their focus is more on sales growth rather than on profit growth with due time as their size increase the focus shifts to profit growth. Table 2 reflects the determined values.
Table 2. Correlations Correlations
CompanySize SalesGrowth ProfitGrowth
CompanySize Pearson Correlation 1 .022 .255**
Sig. (2-tailed) .721 .000
N 268 268 268
SalesGrowth Pearson Correlation .022 1 -.182**
Sig. (2-tailed) .721 .003
N 268 268 268
ProfitGrowth Pearson Correlation .255** -.182** 1
Sig. (2-tailed) .000 .003
N 268 268 268
**. Correlation is significant at the 0.01 level (2-tailed).
Description: company size and ownership structure were found to have a significant effect on the budgeting process of the firms.
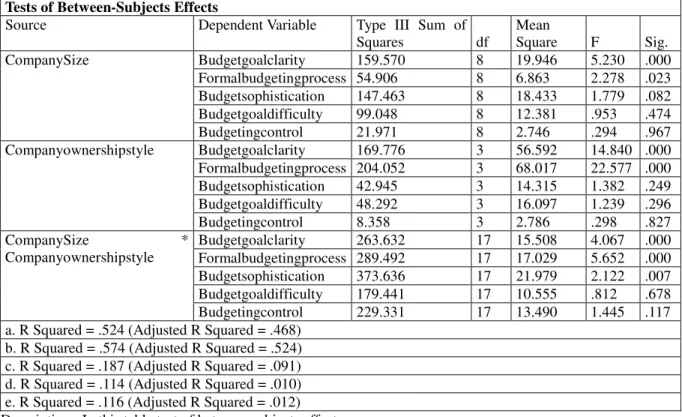
Hypothesis 1a1 and 1b1 were accepted as company size and ownership structure were found to have a significant effect on the budgeting process of the firms. The multivariate analysis of variance indicates that company size and ownership structure effects the two budgeting process, firstly the formal budgeting and secondly the budget goal clarity as shown in table 5 and 6. Company size additionally has an influence on the budgeting sophistication as well. The F values of 5.23, 2.278 and 1.779 were recorded for the budget goal clarity, formal budgeting process and budget sophistication for the company size. As far as ownership structure is concerned high F values of 14.84 and 22.58 were recorded for the budget goal clarity and formal budgeting process.
Hypothesis 1a2 and 1b2 were accepted, company size had a significant impact on the profit growth of the firm and company ownership structure had a significant impact on the sales growth of the firm as depicted in the table 3 and 4.
Table 3. Regression analysis on profit growth Coefficients Model Unstandardized Coefficients Standardized Coefficients T Sig. B Std. Error Beta 1 (Constant) 2.959 .126 23.412 .000 CompanySize .131 .031 .255 4.302 .000 2 (Constant) 3.940 .250 15.747 .000 CompanySize .136 .029 .265 4.628 .000 Formalbudgetingprocess -.110 .025 -.257 -4.490 .000 3 (Constant) 3.099 .307 10.088 .000 CompanySize .129 .029 .250 4.507 .000 Formalbudgetingprocess -.228 .036 -.534 -6.406 .000 Budgetgoalclarity .149 .034 .371 4.441 .000
a. Dependent Variable: ProfitGrowth
Table 4. Regression analysis on sales growth Coefficients Model Unstandardized Coefficients Standardized Coefficients T Sig. B Std. Error Beta 1 (Constant) -.332 .133 -2.493 .013 Formalbudgetingprocess .565 .014 .926 39.914 .000 2 (Constant) -1.516 .139 -10.934 .000 Formalbudgetingprocess .403 .017 .660 24.140 .000 Budgetgoalclarity .204 .016 .355 12.978 .000 3 (Constant) -1.775 .144 -12.300 .000 Formalbudgetingprocess .382 .017 .626 22.939 .000 Budgetgoalclarity .213 .015 .372 13.993 .000 Companyownershipstyle .127 .027 .086 4.709 .000
a. Dependent Variable: SalesGrowth
Description:company size and ownership structure on sales growth
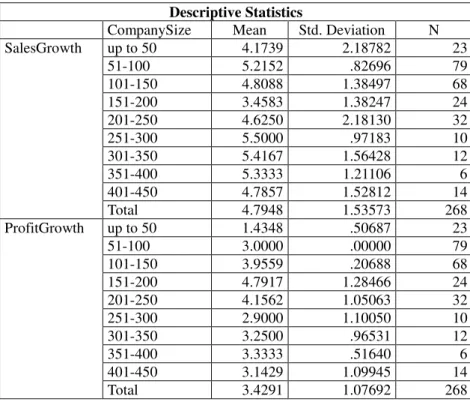
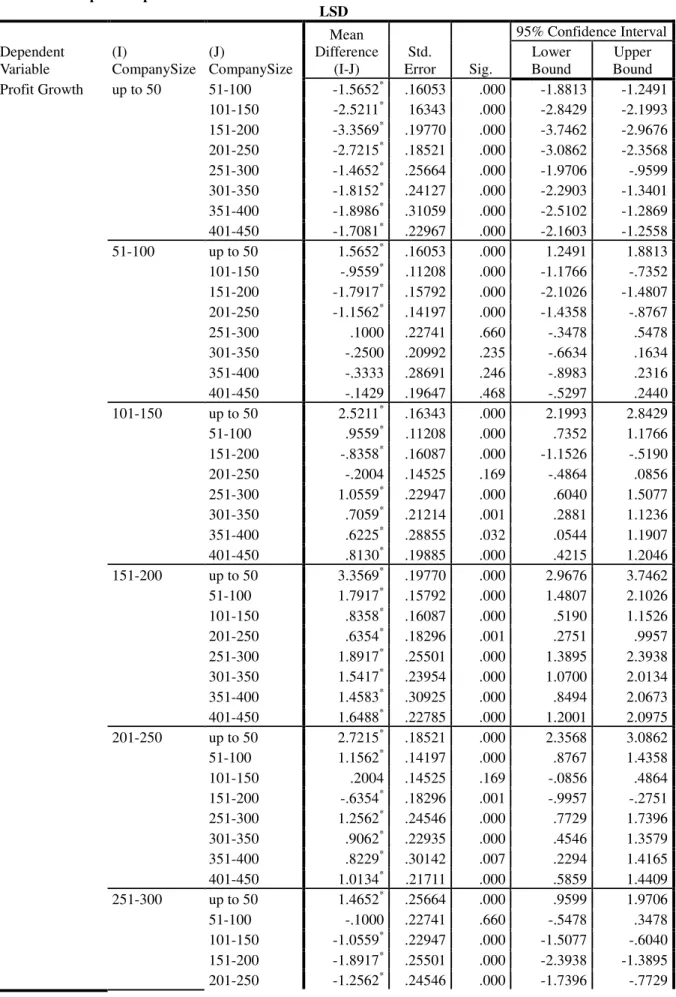
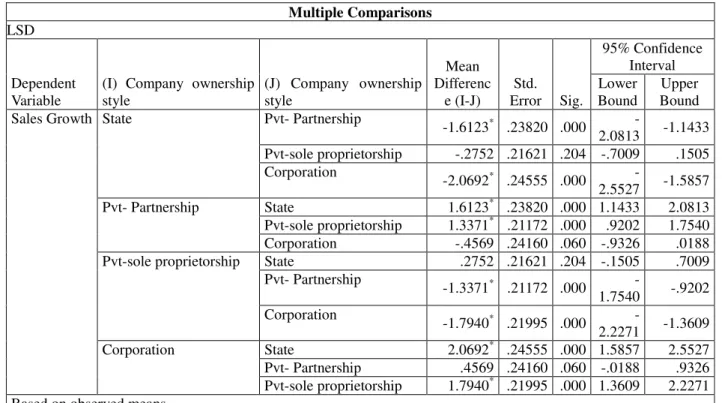
Stepwise regression was done to find out the affect of company size and ownership structure on the performance of the firms. It was found out that only company size has a significant relationship with the profit growth with t value of 4.302 and beta coefficient of 0.255 and company ownership style significantly affect the sales growth with t value of 4.709 and beta coefficient of 0.086. The results indicate that company size has stronger influence on profit growth as compared to the influence of ownership structure on the sales growth. The post hoc tests for the company size on profit growth and company owner ship style on sales growth is represented in the tables 6 and 8, with the descriptive statistics being displayed in the tables 5 and 7 respectively. Post hoc tests determined that smaller firms are statistically significantly different from larger firms in their profit growth. The smaller firms have lesser profit growth but as the firms size increases there is a correspondent increase in the profit growth as well, which eventually starts decreasing when the firm size exceeds more than 250 employees. Similarly different ownership styles yield significantly different sales growth. The state owned firms recorded the lowest sales growth and corporate style owned firms registered the highest sales growth.
Table 5: Company size
Descriptive Statistics
CompanySize Mean Std. Deviation N
SalesGrowth up to 50 4.1739 2.18782 23 51-100 5.2152 .82696 79 101-150 4.8088 1.38497 68 151-200 3.4583 1.38247 24 201-250 4.6250 2.18130 32 251-300 5.5000 .97183 10 301-350 5.4167 1.56428 12 351-400 5.3333 1.21106 6 401-450 4.7857 1.52812 14 Total 4.7948 1.53573 268 ProfitGrowth up to 50 1.4348 .50687 23 51-100 3.0000 .00000 79 101-150 3.9559 .20688 68 151-200 4.7917 1.28466 24 201-250 4.1562 1.05063 32 251-300 2.9000 1.10050 10 301-350 3.2500 .96531 12 351-400 3.3333 .51640 6 401-450 3.1429 1.09945 14 Total 3.4291 1.07692 268
Table 6: Multiple Comparisons LSD Dependent Variable (I) CompanySize (J) CompanySize Mean Difference (I-J) Std. Error Sig. 95% Confidence Interval Lower Bound Upper Bound Profit Growth up to 50 51-100 -1.5652* .16053 .000 -1.8813 -1.2491 101-150 -2.5211* 16343 .000 -2.8429 -2.1993 151-200 -3.3569* .19770 .000 -3.7462 -2.9676 201-250 -2.7215* .18521 .000 -3.0862 -2.3568 251-300 -1.4652* .25664 .000 -1.9706 -.9599 301-350 -1.8152* .24127 .000 -2.2903 -1.3401 351-400 -1.8986* .31059 .000 -2.5102 -1.2869 401-450 -1.7081* .22967 .000 -2.1603 -1.2558 51-100 up to 50 1.5652* .16053 .000 1.2491 1.8813 101-150 -.9559* .11208 .000 -1.1766 -.7352 151-200 -1.7917* .15792 .000 -2.1026 -1.4807 201-250 -1.1562* .14197 .000 -1.4358 -.8767 251-300 .1000 .22741 .660 -.3478 .5478 301-350 -.2500 .20992 .235 -.6634 .1634 351-400 -.3333 .28691 .246 -.8983 .2316 401-450 -.1429 .19647 .468 -.5297 .2440 101-150 up to 50 2.5211* .16343 .000 2.1993 2.8429 51-100 .9559* .11208 .000 .7352 1.1766 151-200 -.8358* .16087 .000 -1.1526 -.5190 201-250 -.2004 .14525 .169 -.4864 .0856 251-300 1.0559* .22947 .000 .6040 1.5077 301-350 .7059* .21214 .001 .2881 1.1236 351-400 .6225* .28855 .032 .0544 1.1907 401-450 .8130* .19885 .000 .4215 1.2046 151-200 up to 50 3.3569* .19770 .000 2.9676 3.7462 51-100 1.7917* .15792 .000 1.4807 2.1026 101-150 .8358* .16087 .000 .5190 1.1526 201-250 .6354* .18296 .001 .2751 .9957 251-300 1.8917* .25501 .000 1.3895 2.3938 301-350 1.5417* .23954 .000 1.0700 2.0134 351-400 1.4583* .30925 .000 .8494 2.0673 401-450 1.6488* .22785 .000 1.2001 2.0975 201-250 up to 50 2.7215* .18521 .000 2.3568 3.0862 51-100 1.1562* .14197 .000 .8767 1.4358 101-150 .2004 .14525 .169 -.0856 .4864 151-200 -.6354* .18296 .001 -.9957 -.2751 251-300 1.2562* .24546 .000 .7729 1.7396 301-350 .9062* .22935 .000 .4546 1.3579 351-400 .8229* .30142 .007 .2294 1.4165 401-450 1.0134* .21711 .000 .5859 1.4409 251-300 up to 50 1.4652* .25664 .000 .9599 1.9706 51-100 -.1000 .22741 .660 -.5478 .3478 101-150 -1.0559* .22947 .000 -1.5077 -.6040 151-200 -1.8917* .25501 .000 -2.3938 -1.3895 201-250 -1.2562* .24546 .000 -1.7396 -.7729
301-350 -.3500 .29010 .229 -.9213 .2213 351-400 -.4333 .34988 .217 -1.1223 .2556 401-450 -.2429 .28053 .387 -.7953 .3095 301-350 up to 50 1.8152* .24127 .000 1.3401 2.2903 51-100 .2500 .20992 .235 -.1634 .6634 101-150 -.7059* .21214 .001 -1.1236 -.2881 151-200 -1.5417* .23954 .000 -2.0134 -1.0700 201-250 -.9062* .22935 .000 -1.3579 -.4546 251-300 .3500 .29010 .229 -.2213 .9213 351-400 -.0833 .33877 .806 -.7504 .5838 401-450 .1071 .26654 .688 -.4177 .6320 351-400 up to 50 1.8986* .31059 .000 1.2869 2.5102 51-100 .3333 .28691 .246 -.2316 .8983 101-150 -.6225* .28855 .032 -1.1907 -.0544 151-200 -1.4583* .30925 .000 -2.0673 -.8494 201-250 -.8229* .30142 .007 -1.4165 -.2294 251-300 .4333 .34988 .217 -.2556 1.1223 301-350 .0833 .33877 .806 -.5838 .7504 401-450 .1905 .33060 .565 -.4605 .8415 401-450 up to 50 1.7081* .22967 .000 1.2558 2.1603 51-100 .1429 .19647 .468 -.2440 .5297 101-150 -.8130* .19885 .000 -1.2046 -.4215 151-200 -1.6488* .22785 .000 -2.0975 -1.2001 201-250 -1.0134* .21711 .000 -1.4409 -.5859 251-300 .2429 .28053 .387 -.3095 .7953 301-350 -.1071 .26654 .688 -.6320 .4177 351-400 -.1905 .33060 .565 -.8415 .4605
Description:Post hoc test for company sizeBased on observed means.The error term is Mean Square(Error) = .459.
*. The mean difference is significant at the .05 level. Table 7:Descriptive Statistics
Descriptive Statistics
Companyownershipstyle Mean Std. Deviation N
SalesGrowth State 3.9123 1.77564 57 Pvt- Partnership 5.5246 .50354 61 Pvt-sole proprietorship 4.1875 1.54451 96 Corporation 5.9815 .65849 54 Total 4.7948 1.53573 268 ProfitGrowth State 4.3158 .94789 57 Pvt- Partnership 2.8525 .72655 61 Pvt-sole proprietorship 3.1979 1.22792 96 Corporation 3.5556 .50157 54 Total 3.4291 1.07692 268
Table 8: Post hoc tests for ownership structures
Multiple Comparisons LSD
Dependent Variable
(I) Company ownership style (J) Company ownership style Mean Differenc e (I-J) Std. Error Sig. 95% Confidence Interval Lower Bound Upper Bound Sales Growth State Pvt- Partnership
-1.6123* .23820 .000 -2.0813 -1.1433 Pvt-sole proprietorship -.2752 .21621 .204 -.7009 .1505 Corporation -2.0692* .24555 .000 -2.5527 -1.5857 Pvt- Partnership State 1.6123* .23820 .000 1.1433 2.0813 Pvt-sole proprietorship 1.3371* .21172 .000 .9202 1.7540 Corporation -.4569 .24160 .060 -.9326 .0188 Pvt-sole proprietorship State .2752 .21621 .204 -.1505 .7009
Pvt- Partnership -1.3371* .21172 .000 -1.7540 -.9202 Corporation -1.7940* .21995 .000 -2.2271 -1.3609 Corporation State 2.0692* .24555 .000 1.5857 2.5527 Pvt- Partnership .4569 .24160 .060 -.0188 .9326 Pvt-sole proprietorship 1.7940* .21995 .000 1.3609 2.2271 Based on observed means.
The error term is Mean Square(Error) = .904. *. The mean difference is significant at the .05 level. Description: Multiple comparison on ownership structures
Table 9. Multivariate analysis. Multivariate Testsc
Effect Value F Hypothesis df Error df Sig.
Intercept Pillai's Trace .968 1431.527a 5.000 235.000 .000
Wilks' Lambda .032 1431.527a 5.000 235.000 .000
Hotelling's Trace 30.458 1431.527a 5.000 235.000 .000 Roy's Largest Root 30.458 1431.527a 5.000 235.000 .000
CompanySize Pillai's Trace .422 2.751 40.000 1195.000 .000
Wilks' Lambda .619 2.982 40.000 1027.136 .000
Hotelling's Trace .550 3.211 40.000 1167.000 .000 Roy's Largest Root .414 12.369b 8.000 239.000 .000 Companyownershipstyle Pillai's Trace .389 7.060 15.000 711.000 .000
Wilks' Lambda .650 7.314 15.000 649.133 .000
Hotelling's Trace .480 7.483 15.000 701.000 .000 Roy's Largest Root .301 14.256b 5.000 237.000 .000
CompanySize *
Companyownershipstyle
Pillai's Trace .828 2.792 85.000 1195.000 .000
Wilks' Lambda .385 2.930 85.000 1140.448 .000
Hotelling's Trace 1.115 3.060 85.000 1167.000 .000 Roy's Largest Root .505 7.097b 17.000 239.000 .000 a. Exact statistic
b. The statistic is an upper bound on F that yields a lower bound on the significance level.
c. Design: Intercept + CompanySize + Companyownershipstyle + CompanySize * Companyownershipstyle Description: Multivariate analysis on Company Size, Companyownershipstyle
Table 10.Tests of Between-Subjects Effects Tests of Between-Subjects Effects
Source Dependent Variable Type III Sum of
Squares df Mean Square F Sig. CompanySize Budgetgoalclarity 159.570 8 19.946 5.230 .000 Formalbudgetingprocess 54.906 8 6.863 2.278 .023 Budgetsophistication 147.463 8 18.433 1.779 .082 Budgetgoaldifficulty 99.048 8 12.381 .953 .474 Budgetingcontrol 21.971 8 2.746 .294 .967 Companyownershipstyle Budgetgoalclarity 169.776 3 56.592 14.840 .000 Formalbudgetingprocess 204.052 3 68.017 22.577 .000 Budgetsophistication 42.945 3 14.315 1.382 .249 Budgetgoaldifficulty 48.292 3 16.097 1.239 .296 Budgetingcontrol 8.358 3 2.786 .298 .827 CompanySize * Companyownershipstyle Budgetgoalclarity 263.632 17 15.508 4.067 .000 Formalbudgetingprocess 289.492 17 17.029 5.652 .000 Budgetsophistication 373.636 17 21.979 2.122 .007 Budgetgoaldifficulty 179.441 17 10.555 .812 .678 Budgetingcontrol 229.331 17 13.490 1.445 .117 a. R Squared = .524 (Adjusted R Squared = .468)
b. R Squared = .574 (Adjusted R Squared = .524) c. R Squared = .187 (Adjusted R Squared = .091) d. R Squared = .114 (Adjusted R Squared = .010) e. R Squared = .116 (Adjusted R Squared = .012) Description: In this table test of between subjects effects Table 11:Regression analysis on sales growth
Coefficients Model Un standardized Coefficients Standardized Coefficients t Sig. B Std. Error Beta 1 (Constant) -1.614 .198 -8.134 .000
Budget goal clarity .201 .016 .351 12.811 .000
Formal budgeting process .405 .017 .664 24.258 .000
Budget sophistication .012 .008 .026 1.403 .162
Budget goal difficulty .007 .008 .017 .918 .360
Budgeting control -.010 .009 -.020 -1.126 .261
a. Dependent Variable: Sales Growth
Description:Budgeting process on sales growth
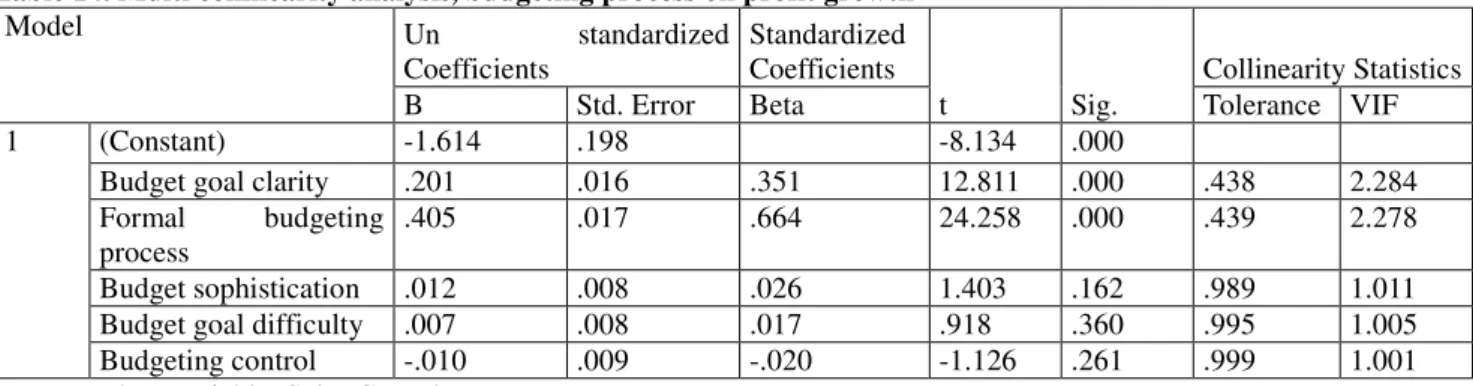
Hypothesis 2 was accepted as formal budgeting process has a significant relationship with sales growth with t value of 24.258and beta coefficient of 0.664 as shown in table 7. It suggests that more the formality in budgeting process of the firms better would be the sales growth of the firm. Formal budgeting process too has a significant relationship with profit growth with a negative t value that is -6.452 and beta coefficient of - 0.554 as shown in table 8. It suggests that more the formal budgeting process would have adverse affects on the profit growth of the firm. Hypothesis 4a was accepted as budget goal clarity had a significant relationship with sales growth with t value of 12.811and beta coefficient of 0.351.it suggests that more the budget goal clarity better would be the sales growth of the firm. Budget goal clarity has a significant relationship with profit growth with t value is high positive value that is 4.755and beta coefficient of 0.409. Hypothesis 3 was not accepted as budgeting control don’t have significant relationship with sales growth with t values of -1.126 and beta values of -0.020. Budgeting control don’t have significant relationship with the profit growth as shown by low t values of -1.050 and beta coefficient of -0.060 respectively. Hypothesis 4b was accepted as budget goal difficulty has a significant relationship with profit growth with a negative t value of -1.185 and beta coefficient of - 0.113. It suggests that more budget goal difficulty better would adversely affect the profit growth of the firm. Budget goal difficulty doesn’t have significant relationship with sales growth with t values of 0.918 and beta values of 0.017
respectively. Hypothesis 5 was rejected as budget sophistication doesn’t have a significant relationship with the sales growth, as evident in low t value of 1.403 and beta coefficient of 0.026.Budget sophistication doesn’t have significant relationship with the profit growth as shown by low t values of -1.314 and beta coefficient of -0.075.
Table 12. Regression analysis Coefficientsa Model Un standardized Coefficients Standardized Coefficients T Sig. B Std. Error Beta 1 (Constant) 4.277 .436 9.800 .000
Budget goal clarity .164 .035 .409 4.755 .000
Formal budgeting process -.237 .037 -.554 -6.452 .000
Budget sophistication -.024 .018 -.075 -1.314 .190
Budget goal difficulty -.034 .017 -.113 -1.985 .048
Budgeting control -.021 .020 -.060 -1.050 .294
a. Dependent Variable: Profit Growth
Description: Budgeting process on profit growth
Table 13. Multi collinearity analysis, budgeting process on profit growth Coefficientsa Model Unstandardized Coefficients Standardized Coefficients T Sig. Collinearity Statistics
B Std. Error Beta Tolerance VIF
1(Constant) 4.277 .436 9.800 .000 Budgetgoalclarity .164 .035 .409 4.755 .000 .438 2.284 Formalbudgetingprocess -.237 .037 -.554 -6.452 .000 .439 2.278 Budgetsophistication -.024 .018 -.075 -1.314 .190 .989 1.011 Budgetgoaldifficulty -.034 .017 -.113 -1.985 .048 .995 1.005 Budgetingcontrol -.021 .020 -.060 -1.050 .294 .999 1.001
a. Dependent Variable: ProfitGrowth
Description: Budgeting process on profit growth by Multi collinearity analysis Description:Budgeting process on profit growth by Multi collinearity analysis with coefficients
According to O’Brien (2007) tolerance of less than 0.20 or 0.10 and/or a VIF of 5 or 10(Variance inflation factor) and above indicates a multi collinearity problem. The values of VIF and tolerance are 2.284 and 2.278 for budget goal clarity and formal budgeting process with tolerance level of 0.438 and 0.439 respectively. The values show that multi collinearity was not a serious problem for the empirical values generated in this study.
Table 14. Multi collinearity analysis, budgeting process on profit growth
Model Un standardized Coefficients Standardized Coefficients t Sig. Collinearity Statistics
B Std. Error Beta Tolerance VIF
1 (Constant) -1.614 .198 -8.134 .000
Budget goal clarity .201 .016 .351 12.811 .000 .438 2.284
Formal budgeting process
.405 .017 .664 24.258 .000 .439 2.278
Budget sophistication .012 .008 .026 1.403 .162 .989 1.011
Budget goal difficulty .007 .008 .017 .918 .360 .995 1.005
Budgeting control -.010 .009 -.020 -1.126 .261 .999 1.001
5. Conclusion
The results of current studies indicate that small and medium enterprises working with unclear goals are faced with higher uncertainty in relations to goal achievement, while clear goals reduce uncertainties in the budgeting process, which, in turn, will improve performance of enterprises. When there is clarity on the tasks and goals it promotes a positive vibe throughout the organization. The formal budgeting process has a positive impact on the performance of Indian SMEs. Those firms engaged in more formal budgeting planning have achieved higher growth rate in sales and profit. Strong positive relationship existed between company size and profit growth rate. As the size of the firms increased their profit growth rate also increased. The reason is that firms in their initial years are smaller in size and their focus is more on sales growth rather than on profit growth with due time as their size increase the focus shifts to profit growth. Company size and ownership structure also significantly influence the formal budget planning and budget in the Indian SME’s. Sales and budgetary sophistication have a statistically insignificant relationship and budget sophistication relationship with profit is even negative. The underlying reason for this relationship might be that it is very costly for most of the firms in Indian Small and Medium Enterprise sector to achieve a budgetary sophistication level. The sophistication of budgetary tools includes acquiring and installation of costly financial modeling software, training and expensive training and follow up mechanism. This needs a huge investment which is difficult for Small and Medium Enterprises to acquire that much huge investment. If firm goes for these huge investments this increase in their expenses will decrease their net profit value. Budgetary goal clarity has a statistically insignificant relationship with the employee’s motivation level and further the budget goal difficulty and employee’s job involvement also shows a statistically insignificant relationship. So from these results it can be concluded that there are numerous other factors other than budget goal clarity and difficulty that can motivate and involve that employees in the attainment of budget goal in firms of Indian SMEs sector.
This study is limited in its scope as data was collected from only from the three districts of Maharashtra state. And another limitation was that only financial performance was included as an indicator of the firm’s performance while non financial performance measures were not included. For future studies the scope can be enriched by studying the SME’s in other states of India. And non financial performance measures like employee satisfaction, employee motivation and job involvement can be included to have a comprehensive understanding of the performance.
Acknowledgement
This research is supported by the National Natural Science Foundation of China (NO.71171031, 71471027), Banking Information Technology Risk Management Project of China Banking Regulatory Commission (CBRC) (No.2012-4-005), and Science and Technology Research Project of Ministry of Education of China (No.2011-10). We thank the organizations mentioned above.
References:
1. Anderson, S.W., &Lanen, W.N. (1999). “Economic Transition, Strategy and the Evolution of Management Accounting Practices: the Case of India.”, in: Accounting,Organizations and Society, Vol. 24(5/6), pp. 379-412.
2. Aram, J.D., & Cowen, S.S. (1990) “Strategic Planning for Increased Profit in the Family Owned Business”, in: Long Range Planning Vol. 23(6). pp. 76-81.
3. Bonn, I., & Christodoulou, C. (1996). “From Strategic Planning to Strategic Management”, in: Long Range Planning, Vol. 29(4), pp. 543-551.
4. Borcherding, Th.E.,Pommerehne, W.W., & Schneider, F. (1982). “Comparing the Efficiency of Private and Public Production: The Evidence from Five Countries”, In: Journal of Economics, Suppl. 2, pp.127-156.
5. Burns, T., & Stalker, G.M. (1961).The Management of Innovation, London: Tavistock.
6. Covaleski, M.A., Dirsmith, M.W., &Jablonsky, S.F. (1985). “Traditional and Emergent Theories of Budgeting: An Empirical Analysis”, in: Journal of Accounting andPublic Policy, Vol. 4(4), pp. 277-300.
7. Dugdale, D. (1994). “Theory and Practice: The Views of CIMA and Students”, in: Management Accounting (UK), Vol. 72(8), pp. 56-59.
8. Dunk, A. S. (1993). The effects of job-related tension on managerial performance in participative budgetary settings. Accounting, Organizations and Society, 18(7), 575-585.
9. Estrin, S., &Rosevear, A. (1999). “Enterprise Performance and Ownership: The Case of Ukraine”, in: European Economic Review, Vol. 43(4/6), pp. 1125-1136.
10. Ezzamel, M.K. (1990). “The Impact of Environmental Uncertainty, Managerial Autonomy and Size on Budget Characteristics”, in: Management AccountingResearch, Vol. 1(1), pp. 181-197.
11. Farragher, E.J., Kleiman, R.T., Robert, T., &Sahu, A.P. (2001). “The Association between the Use of Sophisticated Capital Budgeting Practices and Corporate Performance”, in: The Engineering Economist; Vol. 46(4), pp. 300-311.
12. Friedlob, G.T., &Plewa, F.J (1996).Understanding Return on Investment, New York: Wiley.
13. Firth, M. (1996). “The Diffusion of Managerial Accounting Procedures in the People’s Republic of China and the Influence of Foreign Partnered Joint Ventures”, in: Accounting, Organizations & Society, Vol. 21(7), pp. 629-654.
14. Fisher, C. (1996). “The Impact of Perceived Environmental Uncertainty and Individual Differentces on Management Requirements: A Research Note.”, in: Accounting,Organizations& Society, Vol. 21(4), pp. 361-369.
15. Garrison, R.H., Noreen, E.W., & Seal, W. (2003).Management Accounting, New York:McGraw-Hill Education, European Edition.
16. Gordon, L.A., Larcker, D.F., &Tuggle, F.D. (1978). “Strategic Decision Processes and the Design of Accounting Information System: Conceptual Linkage”, In: Accounting, Organization & Society, Vol. 3(3/4), pp. 203-313.
17. Hayes, D. (1977). “The Contingency Theory of Managerial Accounting”, in: The Accounting Review, Vol. 52(1), pp. 22-39.
18. Hirsch Jr., M.L. (1994). Advanced Management Accounting, Ohio: South-Western Publishing Co., College Division, 2nd ed.
19. Hirst, M.K. (1981). “Accounting Information and the Evaluation of Subordinate Performance: Situational Approach”, in: Accounting Review, Vol. 26(4), pp. 771- 784.
20. Hirst, M.K. (1987). “The Effects of Setting Budget Goals and Task Uncertainty on Performance: A Theoretical Analysis.”, In: The Accounting Review, Vol. 62(4), pp. 774-784.
21. Hirst, M.K., & Lowy, S.M. (1990). “The Linear Additive and Interactive Effect of Budget Goal Difficulty and Feedback on Performance”, In: Accounting,Organizations& Society, Vol. 15(5), pp. 425-436.
22. Hirst, M.K., &Yetton, P.W. (1999). “The Effects of Budget Goals and Task Independence on the Level of and Variance in Performance: a Research Note”, in: Accounting, Organization & Society, Vol. 24, pp. 205-216.
23. Hopwood, A.G. (1972). “An Empirical Study of the Role of Accounting Data in Performance Evaluation”, in: Journal of Accounting Research, Vol. 10(3), pp. 156- 182.
24. Horngren, C.T. (2006). Introduction to Financial Accounting, Upper Saddle River, NJ: Pearson/Prentice Hall, 9th ed.
25. Imoisili, O.A. (1989). “The Role of Budget Data in the Evaluation of Managerial Performance Evaluation”, in: Accounting, Organization & Society, Vol. 14(4), pp. 325-335.
26. Ivancevich, J. M., & McMahon, J. T. (1982). The effects of goal setting, external feedback, and self-generated feedback on outcome variables: A field experiment. Academy of Management Journal, 25(2), 359-372.
27. Joshi, P.L., Al-Mudhaki, J., &Bremser, W.G. (2003). “Corporate Budget Planning, Control and Performance Evaluation in Bahrain”, in: Managerial Auditing Journal, Vol. 18(9), pp. 737-750. 28. Kaplan, R.S., & Atkinson, A.A. (1998).Advanced Management Accounting, Prentice- Hall, USA, 3rded. 29. Kenis, I. (1979). “Effect of Budgetary Goal Characteristics on Managerial Attitudes and Performance”,
in: Accounting Review, Vol. 54 (4), pp. 707-721.
30. Knight, R.A. (1993). “Planning: The Key to Family-Owned Business Survival”, in:Management Accounting, Vol. 74(8), pp.33-34.
31. Koontz, H., &Weihrich, H. (1998).Management, McGraw-Hill, New York.
32. Lau, C.M., &Sholihin, M. (2005). “Financial and Nonfinancial Performance Measurement: How do They Effect Job Satisfaction?”, in: The British AccountingReview, Vol. 37(4), pp. 389-413.
33. Lauterbach, B., &Vaninsky, A. (1999). “Ownership Structure and Firm Performance”, in: Journal of Management of Governance, Vol. 3 (2), pp. 189-201.
34. Locke, E.A., &Schweiger, D.M. (1979). “Participation in Decision Making: One More Look.”, in: Research in Organizational Behavior, Vol. 1, pp. 265-276.
35. McWatters, C.S. (2008). Management Accounting: Analysis and Interpretation. Harlow: Financial Times/Prentice Hall.
36. Merchant, K.A. (1981). “The Design of the Corporate Budgeting System: Influences on Managerial Behavior and Performance”, in: Accounting Review, Vol. 56(4), pp. 813-829.
37. Merchant, K.A. (1985). “Organizational Controls and Discretionary Program Decision Making: A Field Study”, in: Accounting, Organizations & Society, Vol. 10(1), pp.67-85.
38. Mia, L. (1989). “The Impact of Participation in Budgeting and Job Difficulty on Managerial Performance and Work Motivation: A Research Note.”, in: Accounting,Organization& Society, Vol. 14(4), pp. 347-357.
39. Millward, R. & Parker, D. (1983).Public and Private Enterprises: Comparative Behaviour and Relative Efficiency, New York: Longman.
40. Murphy, G.B., Trailer, J.W., & Hill, R.C. (1996). “Measuring Performance in Entrepreneurship Research”, in: Journal of Business Research, Vol. 36(1), pp.15-23.
41. O’brien, R. M. (2007). A caution regarding rules of thumb for variance inflation factors. Quality & Quantity, 41(5), 673-690.
42. Peel, M.J., & Bridge, J. (1998). “How Planning and Capital Budgeting Improve SME Performance”, in: Long Range Planning, Vol. 31(6), pp. 848-856.
43. Qi, Y. (2010). The impact of the budgeting process on performance in small and medium-sized firms in China. University of Twente.
44. Reid, G.C., & Smith, J.A. (2000). “The Impact of Contingencies on Management Accounting System Development”, in: Management Accounting Research, Vol. 11(4), pp. 427-450.
46. Ross, A. (1994). “Trust as a Moderator of the Effect of Performance Evaluation Style on Job-Related Tension: A Research Note.”, in: Accounting, Organizations &Society, Vol. 19(7), pp. 629-635.
47. Steers, R.M. (1976). “Factors Affecting Job Attitude in a Goal-setting Environment”, in: Academy of Management Journal, Vol. 19 (1), pp. 6-16.
48. Weingart, L.R. (1992). “Impact of Group Goals, Task Component Complexity, Efforts and Planning on Group Performance”, in: Journal of Applied Psychology, Vol. 27(3), pp. 416-425.
49. Wijewardena, H., & De Zoysa, A. (2001). “The Impact of Financial Planning and Control on Performance of SMEs in Australia”, in: Journal of Enterprising Culture, Vol. 9(4), pp. 353-365. 50. Wijewardena, H., De Zoysa, A., Fonseka, T., &Perera, B. (2004). “The Impact of Planning and Control
Sophistication on Performance of Small and Medium-sized Enterprises: Evidence from Sri Lanka”, in: Journal of Small Business Management, Vol. 42(2), pp. 209-217.
51. Yuen, Desmond C.Y. (2004). “Goal Characteristics, Communication and Reward Systems, and Managerial Propensity to Create Budgetary Slack”, in: ManagerialAuditing Journal, Vol. 19(4), pp. 517-532.