END USER DATABASE MANAGEMENT: TRADE-OFFS
WHEN STORING MULTI-VALUED DATA IN
SPREADSHEETS
Theresa McLennan and Clare ChurcherApplied Computing Group Lincoln University, Lincoln 7647
New Zealand
[email protected], [email protected]
(Published in Proceedings of the IADIS International Conference Applied Computing 2007, Feb 2007, Salamanca, Spain.)
ABSTRACT
Many end users still take advantage of the immediacy and simplicity of spreadsheets as a medium for storing simple data. It is not always clear which is the best way to arrange the data in a spreadsheet. We have identified a number of arrangements that can be used for storing multi-valued data. In particular we look at the ease of data entry and validation, querying the data, and producing summaries and reports for each of the arrangements. Understanding these issues will allow users to decide on the most appropriate arrangement for their multi-valued data.
KEYWORDS
Spreadsheet design, multi-valued data, many-to-many relationships, end user database management.
1.
INTRODUCTION
For many end users spreadsheets are still the first choice tool to use for storing their data. Spreadsheets are principally designed for calculations, manipulations and analysis of data but frequently people use them as a simple substitute for a small database (Hernandez 2003, Churcher and McNaughton 1998, Churcher, McLennan and McKinnon, 2000). For example, auctioneers’ catalogues and scientists and marketers’ research data are frequently stored in a single spreadsheet range as a simple database. Entering the data is simple and it is immediately visible in the format in which it is entered. However as a project evolves problems do inevitably arise with inconsistent data, as well as with querying, summarizing and reporting.
It is easy to argue that data should be kept in a well designed database rather than in a spreadsheet. This is undoubtedly true for projects with many entities with complex relationships, large amounts of data, many transactions or complex querying requirements. Here we are considering projects involving modest amounts of data with only a few entities. Early spreadsheets had quite sophisticated facilities for data management so the practice of using spreadsheets for storing data was established well before good, easy to use, relational database management software was available on end users’ desk tops. In all likelihood, people will continue to use spreadsheets as a means of data storage convenient in many situations.
Typically a user will store the data in a layout that reflects the form on which it was collected or in the way they would like to see it reported. While this is fine in the short term, problems arise when the application evolves and additional querying, filtering or summarizing is required. This situation is not confined to spreadsheet applications as it also occurs in many databases where a user, inexperienced in analysis, will construct a single flat table to store data.
There is considerable literature on managing the computational aspects of spreadsheets (Panko 1998, Randolph, Morris and Lee 2002, Rajalingham et al. 1999). There are also well known websites such as the Spreadsheet Research website (Panko 1997-2005) which contains much useful material with the focus on preventing and detecting errors in spreadsheet formulas. Simkin (2004) has published an excellent overview of techniques and tools for removing errors from spreadsheets. Also useful are the Spreadsheet Development Methodology pages (Chadwick 1999-2005) from the Information Integrity Research Centre website and best practice guidelines for developing spreadsheet models to perform calculations (Read and Batson 1999).
However a literature search has revealed little on designing a spreadsheet to be used primarily for data storage and reporting, rather than for calculations, even though this practice is not uncommon (Hernandez 2003, Churcher, McLennan and McKinnon 2000, Churcher 2002).
We have identified a number of common approaches that users employ to deal with multi-valued data in a spreadsheet, each with its own strengths and weaknesses. We discuss the usefulness of each of them with respect to data validation, querying, reporting and summarizing. This will enable users to make informed decisions as to the most appropriate arrangement for storing their multi-valued data.
2.
MULTI-VALUED DATA
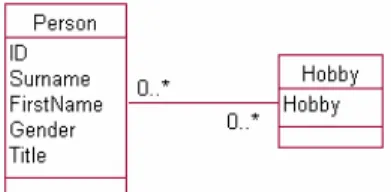
As soon as users need to store data about more than one quantity they will inevitably need to deal with multi-valued attributes or many-to-many relationships. Very simple examples include: club members having many skills; team members being available for several matches; employees working at many tasks; botanical plants having many landscaping uses; students enrolling in many courses or (the perennial) academics having many areas of expertise. We will illustrate many-to-many relationships with the simple example of people having many hobbies as it is self explanatory. A class diagram for this relationship is shown in Figure 1.
Figure 1: Many-to-many Relationship
In a relational database a many-to-many relationship such as that in Figure 1 would be represented by three tables. Figure 2 shows these as they might be set up in a product such as Microsoft Access. This schema allows attributes to be stored about people and hobbies and also, if required, about the relationship between them. Referential Integrity can be set up to ensure that only valid people and hobbies are entered in the PersonHobby (associative) table.
Person Table PersonHobby Table Hobby Table
Figure 2: Schema and some data for a many-to-many relationship in a relational database
2.1 common tasks using multi-valued data
In order to compare the different spreadsheet arrangements for multi-valued data we have determined a set of common tasks covering data validation, querying, summarizing and reporting. We will be using our example of people with many hobbies to illustrate the tasks.
Data Validation
If any querying, summarizing or statistics are to be performed on the data it is important that the hobbies are referred to and spelt consistently. For example we do not want to consider “snow boarding”, “snow-boarding” and “snow“snow-boarding” as three different hobbies. As we will see most, but not all, of the data arrangements allow for this to be reasonably easily achieved.
Queries
The majority of the data arrangements which we describe in the next section are biased towards one side of the many-to-many relationship; that is they are laid out to clearly display the hobbies a particular person is interested in. We consider how easy each arrangement is at giving the reverse perspective, i.e. how easy is it to find out which people are interested in a particular hobby. We also consider how each of the arrangements cope with queries involving simple Boolean operators. The queries we will consider are:
• Simple query: “Who is interested in photography?”
• AND query: “Who is interested in both photography AND reading?” • OR query: “Who is interested in either photography OR reading?”
There are of course many other queries that might be required for a particular problem. Where more complex querying is required users should be encouraged to move the data to a database.
Summaries
We consider two simple counts:
“How many hobbies does each person have?”,“How many people are interested in each of the hobbies?” Reporting
A very simple but useful report, based on this example, is to have the name of a person and each of their hobbies on a single line, e.g.
Bullock Quentin photography, reading
Donney Bryce orienteering, photography, skiing
Curiously this type of report is not readily produced from a relational schema (such as in Figure 2). Standard reporting tools, as found in relational database managers, will generally put each record (in this case hobby) on a separate row.
In the next section we identify the most common arrangements of data for managing multi-valued data in a spreadsheet and discuss the suitability of each for the tasks described above.
3.
ARRANGING MULTI-VALUED DATA IN A SPREADSHEET
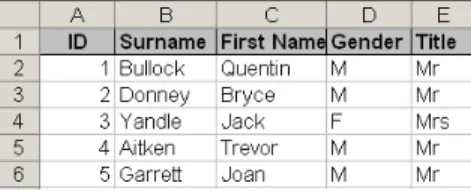
Often a spreadsheet will be set up by a researcher, club or small business to keep information about just one thing; in this case, perhaps, club members and their details. As an after thought they may add a column to keep another attribute such as hobby and in time realize that in fact one hobby is insufficient. It is at this stage that problems can surface.
There are a number of ways this situation can be addressed in a spreadsheet, each with its own strengths and problems. In this section we describe four ways of arranging the data for a many-to-many relationship: Multi-valued field; Repeated columns; Categories as columns; Normalized Ranges. We also discuss the usefulness of each of these arrangements in performing the tasks described in the Common Tasks section. All but the last of these arrangements stores all the data in a single worksheet range.
3.1 Multi-valued field
With this solution the user enters several values for Hobby in a single cell or field, separated by some sort of punctuation as in Figure 3.
Data Validation
Using standard spreadsheet features it is not possible to validate the data to avoid problems such as the inconsistent references to photography (rows 3 and 4).
Queries
At first consideration “Who is interested in photography?” seems to be a very difficult query for data in this format. It can however be achieved very simply in Excel by using a custom autofilter using the contains operator (equivalent to an *photography* expression).
Queries such as “Who is interested in both photography AND reading?” and “Who is interested in either photography OR reading?” can both be easily answered using Excel’s custom autofilter feature. In addition it is also possible to use advanced filters with the criteria tables shown in Figure 4. The advanced filter and criteria table have the advantage of allowing more complex combinations of several Boolean operators.
Figure 4: Criteria tables for OR (left) and AND (right) queries on multi-valued fields Summaries
While querying this arrangement is surprisingly simple, summaries are difficult. It is possible to answer simple queries about specific hobbies using COUNTIF functions or DCOUNT functions with criteria tables. The formula =COUNTIF(F2:…,"*knitting*") answers the question “How many people are interested in knitting?”. However, it is very hard to find summaries, such as the number of people interested in each hobby, except by using a cumbersome Excel data table with formulas referring to a criteria table. Features such as complex data tables can be very daunting for the typical end user especially if used irregularly. Unfortunately, finding the number of hobbies a particular person has is even more difficult.
Reporting
This data arrangement is already basically in the format of the simple report described in the Common Tasks section. If desired Excel’s Convert Text to Columns Wizard can be used to separate the field into separate columns. This is the arrangement we discuss next.
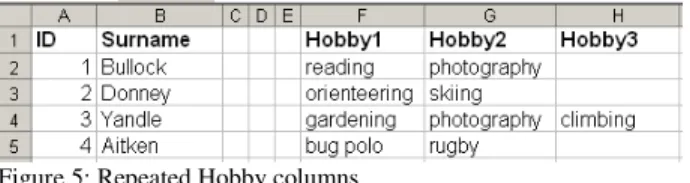
3.2 Repeated columns
In this layout the multiple values for the hobby attribute are in separate columns as in Figure 5.
Figure 5: Repeated Hobby columns Data Validation
Inconsistent spelling can be avoided by creating a separate list of hobbies and referencing this list in an Excel validation on each of the Hobby columns. This is more-or-less equivalent to the database situation (Figure 2) where there is a separate Hobby table and referential integrity can be applied to constrain the hobbies to valid values.
Queries
At first sight the query “Who is interested in Photography?” might be simply achieved by applying an autofilter to each column in turn. This will not be successful as it returns the result of the query “Hobby1 = photography AND Hobby2 = photography AND …etc”. As the same hobby should not be entered in two columns for a single person this will always give a null result. What we require is a query along the lines of “find rows where Hobby1 = photography OR Hobby2 = photography OR …etc” .We can perform this query using an advanced filter and a criteria table similar to that shown in Figure 6. This method suffers from the problem that whenever an extra column is added (e.g. Hobby4) the criteria table needs to be updated. The complexity of advanced filtering is starting to get beyond the comfort level of many end-users. With this level of skill the user would probably be well placed to move to a database and employ the more sophisticated querying capabilities available.
Figure 6: Criteria table for filtering repeated columns
In the repeated column arrangement there is the potential for a particular hobby to appear in any of the columns. It is possible to use advanced autofilters with criteria tables to perform a variety of combinations of AND and OR operations. However, having to allow for each hobby possibly occurring in each column, means that the criteria tables become unreasonably unwieldy. This makes this arrangement difficult to query in this manner.
Summaries
With the repeated columns arrangement it is easy to find how many hobbies each person has by summing simple counts for each person (e.g. =COUNTA(F2:H2) for Bullock). However, this method of counting is prone to errors when seemingly empty cells contain blanks or other non printable characters and considerable care and discipline is required to keep these summaries (as well as the data) accurate.
Problems similar to the multi-valued field exist for summarizing by hobby. Once again it is possible to use COUNTIFs or criteria tables and DCOUNTS for specific queries (e.g. How many people have knitting as a hobby?)but it is more difficult to get an overall summary by hobby.
Reporting
This data arrangement is already in the format of the simple report described earlier.
3.3 Categories as columns
A third option for representing a many-to-many relationship is to have a column for each possible value of Hobby and represent a person’s interest in a hobby with some entry in the appropriate cell as shown in Figure 7.
Figure 7: Hobby categories as columns Data Validation
As there is no need to enter the names of any hobbies there are no problems with data validation. Queries
This arrangement is the easiest for answering simple queries. “Who is interested in photography?” can be achieved simply by applying an appropriate autofilter to the photography column.
The categories as columns arrangement deals easily with an AND query by simply applying autofilters to two columns. An OR query for this arrangement requires Excel’s advanced filter and a criteria table as in Figure 8. In spreadsheet software other than Excel, the filtering options are a little different. For example the filter in OpenOffice.org’s Calc can also perform ORs between fields.
Figure 8: Criteria table for an OR query with categories as columns
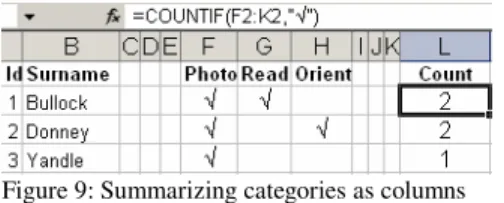
Figure 9: Summarizing categories as columns Summaries
The categories as columns arrangement can produce totals for rows and columns with simple formulas to count cells containing values. A reliable formula for computing the number of hobbies formula is shown in Figure 9. A similar formula can be used to find the number of hobbies each person has.
Reporting
This arrangement doesn’t easily produce the required report. However, the data is laid out in a format where all of a person’s hobbies are identifiable in one line. It is easy to see all of a person’s hobbies provided there aren’t too many hobby columns. For a large number of hobbies it is necessary to rotate the hobby column headings to make the report printable and to prevent considerable horizontal scrolling when viewing the data. For sparse data (i.e. many hobbies choices but few per person) it is probably not as easy to use as the report layout in the Common Tasks section.
3.4 Normalized ranges
The final data arrangement is similar to the normalized tables in a database and is shown in Figure 10. Each PersonHobby pair is entered on a separate row in one range while the data about each Person is kept in a separate range probably on another sheet. A third range, to be used to validate the hobby values, will also be created. In many respects this arrangement is now almost isomorphic to the database schema in Figure 2.
Person data PersonHobby data
Figure 10: Separate ranges for Person and PersonHobby data
By using a VLOOKUP function, it is possible to add additional columns to the PersonHobby range, in order to “see” related person information in one contiguous range. In Figure 11 both columns C and D contain lookup formulas referring to the Person data (range-named as PeopleLU). This is similar to creating a join in a relational database and it enables queries and summaries to be performed using filtering and pivot tables on the extended PersonHobby range.
Figure 11: Normalized range extended with look-ups
End users are unlikely to employ this method as it is conceptually more difficult than the single range solutions previously discussed. It offers few of the advantages (such as powerful querying) that relational database software can provide if data is stored in this way. However, the layout of data, as in Figure 10, makes it very simple to export each of the ranges to individual normalized tables in a database. This method also allows us to keep additional information about each hobby if that is required. This can be achieved by simply adding additional columns to the Hobby range. More details on this arrangement can be found elsewhere (Churcher, McLennan and McKinnon 2000).
Data Validation
This can be achieved in the same way as the multiple columns arrangement. The list of hobbies is kept in a separate range and an Excel validation (on Column B in Figure 11) can refer to this range.
Queries
If the PersonHobby range is expanded to include the Person details as in Figure 11, our simple query “Who is interested in photography?”, is very easily achieved with a simple autofilter on Column B. If a person has more than one hobby then there are multiple rows relating to this person in the PersonHobby range. An OR query can be performed using an advanced filter with a simple criteria table and extracting out unique values of just the Person details to a separate range. In our experience most users find this poorly implemented
Excel feature very difficult to use! There appears to be no simple way to perform an AND operation in a single step.
Summaries
With the normalized ranges it is again difficult to get summaries using simple formulas although COUNTIFs and DCOUNTs can again be used. A considerable advantage of this arrangement is that is the only one that allows us to easily summarize the data using pivot tables (simple cross-tabs). Figure 12 shows pivot tables for counts by hobby and by person.
Figure 12: Pivot tables produced from normalized ranges Reporting
It is not at all simple to take the data from this format and rearrange it with a name and all the hobbies on one row. However it is possible to produce a pivot table that rather clumsily provides this information.
4.
SUMMARY
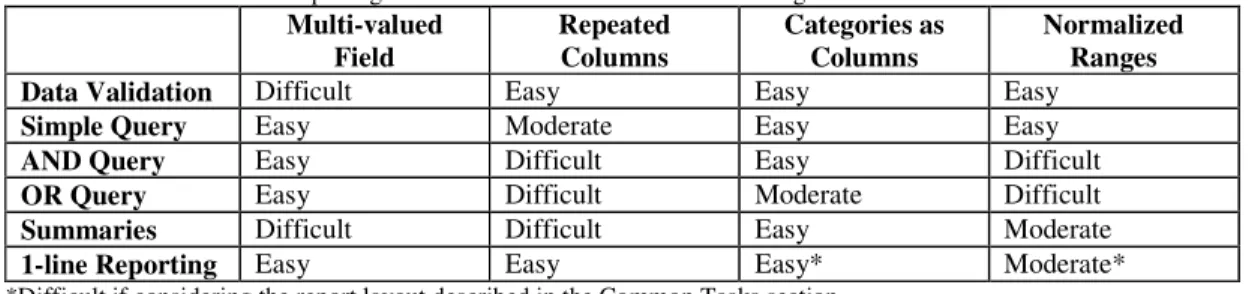
Each of the data arrangements we have identified has different strengths. In Table 1 we indicate how easily an end user with modest spreadsheeting skills could carry out the tasks described in the Common Tasks section for each of the different data arrangements. We class the use of autofilters, simple formulas and Excel validation facilities as being easy, advanced filtering with simple criteria tables and straight forward pivot tables as moderately difficult, and more complex advanced filtering and other Excel data features or macros as difficult. While this classification is perhaps debatable (and there is a need for more work in this area) we feel it is reasonable. In our experience most end users, even those who have received training, find more complex advanced filters and pivot tables very challenging. This is particularly the case for infrequent users of these tools.
The results in Table 1 are surprising in many respects. The unsophisticated multi-valued field arrangement turns out to be the only arrangement that allows our three queries to be carried out using simple custom autofilters. It also offers simple one line reporting but has the serious drawback that data validation is almost impossibly difficult. The lack of data validation means that although the queries might be simply performed the results will always be reliant on manual checking of the data.
Table 1. The Ease of Completing Common Tasks for the Different Arrangements Multi-valued Field Repeated Columns Categories as Columns Normalized Ranges
Data Validation Difficult Easy Easy Easy
Simple Query Easy Moderate Easy Easy
AND Query Easy Difficult Easy Difficult
OR Query Easy Difficult Moderate Difficult
Summaries Difficult Difficult Easy Moderate
1-line Reporting Easy Easy Easy* Moderate*
*Difficult if considering the report layout described in the Common Tasks section.
The repeated columns arrangement is one that often arises when a user originally expects a single value for a quantity but then finds that for some cases there are multiple values. The original data structure for the single values is then easily altered in hind-sight by adding additional columns. This arrangement has the advantage over the multi-valued field in having good data validation. However the querying for this arrangement requires cumbersome criteria tables which are beyond the patience threshold of many users.
The categories as columns arrangement is one that is often employed when there are a fixed number of categories when the spreadsheet is first designed. This design reflects how the users want to enter and view their data. It is particularly useful when counts of particular categories are required. This arrangement allows very good data validation, querying and summarizing. Reporting only becomes an issue when the number of categories is large. Overall it appears to be the most satisfactory solution.
The data arrangement which reflects a normalized database schema has easy data validation through the Excel validation facility. It is also the only arrangement which allows additional information to be maintained about both entities. For example we could keep additional information about each hobby (e.g. Club night or joining fee) by adding additional columns to the range containing the hobbies. Arguably in this situation the data is becoming too complex to be satisfactorily kept in a spreadsheet and careful consideration should be given to porting to a database (Churcher, McLennan and Spray 2005). With this arrangement the querying and reporting are mostly difficult however it is the only arrangement suitable for creating pivot tables (cross tabulations). With the normalized ranges it is easy to port data directly into database tables in a form suitable for exploiting all the power of SQL queries and report writers.
5.
CONCLUSION
End-users often use spreadsheets as a way of storing simple data. We have identified four arrangements which can be used for storing such multi-valued data. Many of these arrangements offer ease of inputting and reporting of the data which is generally foremost in a user’s mind at the outset of a project. Unfortunately as the application evolves it soon becomes apparent that many of these arrangements have severe problems when it comes to simple querying and summarizing the data. We have discussed the usefulness of each these data arrangement in carrying out a number of tasks commonly associated with managing data. Each
arrangement has its strengths and weaknesses and we present a summary of our findings. This summary will enable users to decide which arrangement might be most suitable based on the types of tasks they are most likely to be carrying out. Where a user finds that none of these arrangements will meet all their requirements it is probably a good indication that they should be using a relational database product for their project.
REFERENCES
Chadwick, D., (1999). A Spreadsheet Building Methodology, http://www.cms.gre.ac.uk/research/iirc/, Accessed October 17, 2005
Churcher, C (2002). Analysis Techniques for Database Design, Getting it Right First Time, Pearson Education New Zealand Limited, Auckland, NZ, 126-129.
Churcher, C., et al, (2000). Pragmatic Data Modeling and Design for End Users, Proceedings of Seventh Asia-Pacific Software Engineering Conference, Singapore, December, 120-126.
Churcher, C., et al, (2005). Managing Multi-Valued Attributes in Spreadsheet Applications, Proceedings of the Ninth Pacific Asia Conference on Information Systems, Bangkok, Thailand, July, 169-182.
Churcher, C. and McNaughton, P., (1998). There are Bugs in our Spreadsheet! Designing a Database for Scientific Data, Research Report No. 98/02, ACMS Group, Lincoln University,
Hernandez, M. (2003). Database Design for Mere Mortals, 2nd Edition, Addison-Wesley, Boston, MA,493-497. Panko, R., (1997). Spreadsheet Research (SSR), http://panko.cba.hawaii.edu/ssr/, October 17, 2005.
Panko, R., (1998). What we Know about Spreadsheet Errors, Journal of End User Computing, (10) 2, 15-21.
Rajalingham, K., et al, (1999). An Integrated Spreadsheet Engineering Methodology (ISEM). Proc. IFIP TC11 WG11.5 Third Working Conference on Integrity and Internal Control in Information Systems,” Kluwer academic publishers, Amsterdam, The Netherlands, November,41-58.
Randolph, N., et al, (2002). A Generalized Spreadsheet Verification Methodology, Proc. Twenty-Fifth Australasian Computer Science Conference (ACSC2002), Conferences in Research and Practice in Information Technology, Melbourne, Australia., January-February, 215-222.
Read, N. and J. Batson., (1999). Spreadsheet Modeling Best Practice, Institute of Charted Accountants for England and Wales, Great Britain.