Interest and minimum payment elasticities in
credit cards
(Preliminary)
Enrique Seira
∗Banxico & ITAM
Sara G. Castellanos
COFECE, Mexico
Abstract
There is little experimental evidence showing how clients new to formal banking respond to dierent credit contract terms. We measure how debt, purchases, payments and default change when interest rates change. A large sensitivity of debt and default to interest rates may limit bank prots and nancial inclusion. We also experimentally measure sensitivities of actual be-havior with respect to changes in the minimum payment for the rst time in the literature. We nd that interest paying debt is quite insensitive to interest rates, but responsive to minimum payments. Contrary to some recent litera-ture we nd that the correlation of default and interest rates is small, with an elasticity of about 0.14.
Keywords: Credit cards; household nance; consumer behavior; Mexico. JEL Classications: D12 , D14, D40, G02, G20, G28.
∗Corresponding author: enrique.seira@banxico.org, enrique.seira@itam.mx. We
would like to thank Diego J. Jiménez for his outstanding research assistance. All errors remain our own.
1 Introduction
Incorporating marginal borrowers into formal banking is both important and di-cult. It is important because it likely relaxes liquidity constraints for people who presumably have high marginal utilities of consumption. It is dicult because credit risk is high since, by virtue of being outside the nancial sector, little is known about these consumers and how to set contract terms for them.1
Credit cards are one of the main nancial products used to service clients new to the formal nancial sector. One reason for this may be that risk is limited by awarding initially very small credit limits, and taking advantage of the high frequency and detail of credit card transactions to learn about the client's risk. Furthermore credit cards require no collateral. Figure 1a shows that the percent expansion of credit cards in 2004-2010 in Mexico was concentrated in the lower three deciles of income, whereas1bshows that a very important point of entry into the formal credit market in Mexico is through credit cards, with over 60% of new entries.2
It is natural to expect marginal borrowers to be riskier than borrowers who are already served by the formal nancial sector. If one is concerned with increasing the costumer base and increasing bancarization, a natural question to ask is then: to what extent can contract characteristics inuence default risk? This question is not only of interest to card issuers, but also to authorities. Worried that the minimum payment was too low, the US congress required a study of credit card minimum payments in cards in the early 2000s (Smale 2005). The study found that minimum payment requirements had decreased markedly over time: in the 1970s the average card minimum payment was about 5% of the outstanding balance, but by 2000 it was down to 2%. In January 2003, US Federal regulators jointly issued interagency guidance on credit card lending that stated among other things that minimum pay-ments were too low. The concern is that consumers may get overindebted, leading
1Karlan & Zinman (2008) report default rates twice as big for new borrowers of a micro-nance
institution in South Africa for instance.
2This sample was taken from the credit bureau, conditioning on people who had a credit card
as od 2010. So it documents which was the rst nancial instrument among those that also have a credit card.
them to default. The US is not the exception. In 2010 authorities in Mexico estab-lished a oor on the minimum payment that credit providers can charge.3 Supporters
of increasing minimum payments say that low minimum payment leads unsophisti-cated or present biased consumers to incur in too much debt which leads to default.4
Detractors on the other hand say that consumers are not so unsophisticated and that the policy would limit the ability of households to smooth consumption, with little eect on default.
There is also concern with high interest rates leading to overindebtedness and default. Many governments have put (and kept) ceilings on interest rates in order to avoid exploitation of consumers by banks. The aftermath of the nancial crisis of 2008 has only increased these consumer protection concerns, but so far we know of no study that measures the eect of increasing credit card minimum payments, nor of an experimental study which varies interest rates as widely as ours and focuses on new-to-formal-banking clients.
This paper focuses on two issues: First, we examine data from a randomized experiment with clients new to formal banking (NTB) and measure elasticities of debt, payments, purchases, default and voluntary account closings with respect to both interest rates and minimum payments. Second, we show that giving credit to NTB clients is risky indeed: returns are very heterogeneous and many clients leave the bank in a short span of time; in fact about 40% in two years.
We nd that as a percentage of their respective means, increasing the minimum payment from 5% of debt to 10% leads to an increase in payments of 12.6% one year later and an associated reduction in debt of 11.8% a year later and of 24.1% two years later. So the minimum payment policy does aect leverage. However it has a much smaller eect on default5 with only a 9% dierence in cumulative6
3The minimum payment has to be the maximum of 1.5% of the balance plus the amount of
interest due and corresponding VAT or 1.25% of the credit limit.
4Meier & Sprenger (2010) and Laibson, Repetto & Tobacman (2003) provide some evidence
consistent with present-biased preferences driving variation in credit card borrowing, and Stewart (2009) shows that payments seem to anchor at the minimum payment.
5Default is dened as 3 months past due payments, this is the legal denition in Mexico.
6Because a large fraction of the cards leave the sample, measuring default as cumulative even for
default as a percentage of its mean or 2.2pp overall; driven mostly by an increase in default at the time of the minimum payment increase, which likely caught them o-guard. Voluntary account closings increase by 1.6pp out of a base of 16.3pp for the control group. There is no dierential eect in default two years later out of surviving accounts. Since the lower revenues from lower debt are not oset in a big way by reduced default, the net-of-default revenue of the bank decreases by 4% in net present value.
We also estimate debt-interest elasticities and nd, for instance, that decreasing the yearly interest rate from 45% to 15% causes purchases to increase by 9%, pay-ments to fall by 5%. These estimates imply elasticities of about 0.13 and 0.07 respec-tively. Debt in fact decreases by about 18% because of lower interest compounding. Default decreases by 2.8pp overall and revenues fall by 46%, while voluntary closings are 3.7pp lower (out of a baseline of 19pp). Note that since we estimate intensive margin elasticities and consumers have already selected in, a low interest rate-default correlation suggests that moral hazard is not very prevalent in this population, even when information asymmetries are presumably large.
The rest of this article is organized as follows. Section 2 describes the context, data and the experiment. We present elasticities with respect to minimum payment policy in Section 3 and with respect to interest rates in Section 4. Section 5 con-cludes. The Appendix, section A studies whether there is selective attrition related to treatment status.
2 The experiment and the empirical strategy
A. Context and Data
We study a sample of 144,000 clients with no bank records (i.e. new to the formal nancial system) that were awarded a card by a commercial bank. These clients were brought in by sales eorts of the bank in supermarket chains, a com-mon practice in Mexico. They typically have low/medium incomes around 15,000
pesos per month (about 1,300 USD) and are initially awarded low credit card limits, uctuating around 7,000 pesos.
This population is of interest in itself since they are borrowers who are at the bancarization margin. That is: they did not have formal credit but the bank con-sidered them just protable enough to be eligible for a credit card. If we want to understand why is credit penetration low in Mexico7 and (likely) in other countries
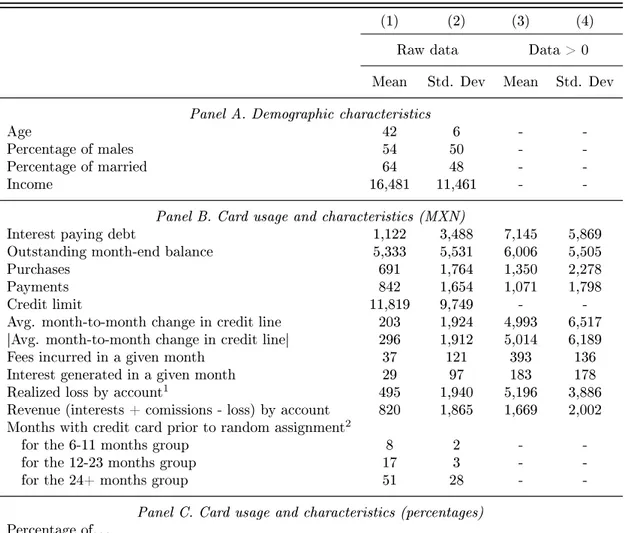
we have to study the diculties and risks of giving loans to precisely this population. Table 1 contains the descriptive statistics of the main variables for our sample as well as some demographics. We were able to obtain demographic data on 54% of the sample. On average cardholders are 42 years old, have 16,481 pesos of monthly income and 64% are married. Regarding the use of the card, Panel B shows that the average credit line is 11,819 pesos and average interest paying debt is almost a tenth of this at 1,122 pesos. Most borrowers are actually non-revolvers, 17% of observations incur interest. Payments and purchases are 842 and 691 pesos on average; 33% have less than 1 year with the card at the start of the experiment.
Note also that standard deviations which are about twice as large as the means reect substantial heterogeneity. We are told that this heterogeneity is typical of pools of new borrowers which have not undergone the natural selection process. As expected, default risk is high: 30% of accounts missed a payment at least once and 27% accounts defaulted at least once during the 26 months of the sample. Retention risk is also high: 18% of clients voluntarily close their card and another 23% are forced out by the bank due to default. Finally use, default and retention show up in net-of-default (NDR) revenue8, which has a mean of 820 pesos and a standard
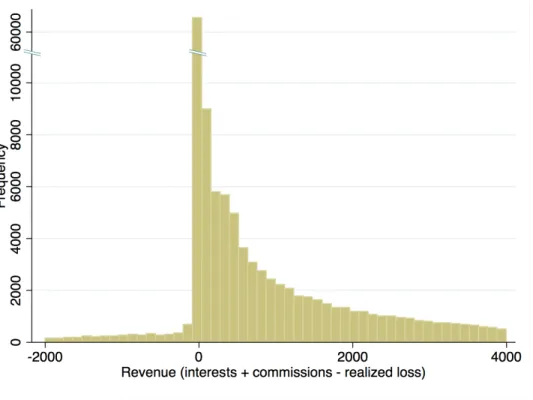
deviation 2.25 times as large. Figure 3shows the distribution of NDR. B. The Experiment
7Private Credit to GDP is about 27% as of 2012, while in the US for instance it is above 180%
of GDP.
8We calculate interest and fee income for each month and subtracts a rough measure of expected
loss of the account if it actually defaulted. Since we do not observe severity of loss so we assume based on talks with the bank that severity is half of the outstanding balance at the time of default. We then compute the present value of this ow of payments and losses using an interest rate of 3%.
The experiment was implemented on a random sample of 144,000 NTB clients in one Mexican bank. The sample was stratied by months with the card9 and
by how close they paid to the minimum payment.10 The bank randomized these
cards orthogonally into 8 treatment groups of 18,000 accounts each. The treatment groups are dened by the interest rate and the minimum payment rate11 as follows:
{interest rate, minimum payment} ∈ {45%, 35%, 25%,15%} × {5%, 10%}. After
these cardholders were assigned to their respective treatment, they were told that these new conditions applied to their credit card. Since interest rates were decreased rather than increased, there were no complaints about this or exceptional account closings at the time.
The terms were eective for 26 months between March 2007 and May 2009 when the experiment ended. No promotions were given to these cardholders during this period, but the size of the credit line was allowed to vary normally, according to the protocols of the risk department and independently of treatment status.12 Table 2 provides evidence that randomization did balance the sample across treatment groups.
C. Empirical Strategy
The econometrics are greatly simplied when treatment is randomized. Here we will simply estimate causal eects by the parameterβin the following equation which
is estimated by OLS:
Yitk =α+X
k
βkTik+ikt (2.1)
Where βk measures the eect of treatment k on outcome Y with respect to the
omitted group (45% interest rate and 5% MP respectively); The subscripti indexes
credit cards and t indexes months. We will provide cross-sectional estimates after
9Between 6m and 11m; 12m and 23m, and more than 24m
103 categories: within 5%, twice the minimum payment, more than twice the minimum payment.
11As a proportion of debt.
12We actually checked and found that treatment status is uncorrelated with credit limit levels or
one year of treatment and at the very end of our experiment 26 months later. We decided to use only the cross-section in the regression for simplicity, as our large sample gives us substantial statistical power without having to pool the data.
For dependent variables we use interest paying debt, purchases, payments, net-of-default bank revenue, whether there was any late payment (delinquency) or net-of-default in the periods since the experiment started (and also a measure conditional on survival), and whether the card was voluntarily canceled. An account is delinquent in this denition when it has had at least one late payment in the sample period up to the month of consideration, and is in default when it has been delinquent for 3 consecutive months in the past.
In our case the main threat to the validity of the estimates as estimators of causal eects is attrition. Attrition is of interest in itself as it reects retention risk of NTB clients. We report results for attrition as a dependent variable. However it potentially introduces a selection problem which makes causal interpretation of our estimates problematic. The Appendix presents evidence showing that quantitatively attrition is quite similar across the experimental groups, both in terms of the the number of accounts that we lose and in terms of the characteristics of those accounts. We also deal with attrition by presenting results after one and two years separately, as attrition increases with time, and by providing Lee (2009) bounds on the estimates that account for attrition.
3 Eect of variations in the minimum payment
A. The discussion about minimum payment regulation
In many countries minimum payment policy is an issue of contempt between nancial authorities and banks. It is possible that market equilibrium is not Pareto optimal if for example one of the following two cases apply: (a) if banks do not take into account that a larger client's debt may induce default in other banks (externalities); (b) if clients have present biased preferences which leads them to have too much debt from the perspective of their long run self. In these cases the minimum
payment set by banks may be too low, giving rise to higher debt and higher default. The concern is genuine given that minimum payments in Mexico often generated negative amortization of debt in the past, before authorities established a oor to minimum payments.13
The social welfare case for increasing minimum payment as a consumer protection device depends on whether consumers are overindebted and at risk of default. It is very dicult to calculate optimal indebtedness and therefore overindebtedness, especially so without knowledge of the income generating process and wealth. We do not attempt to assess if higher minimum payments corrects the overindebtedness. Instead we answer a much simpler question: Are changes in minimum payments reected in changes in debt and default?
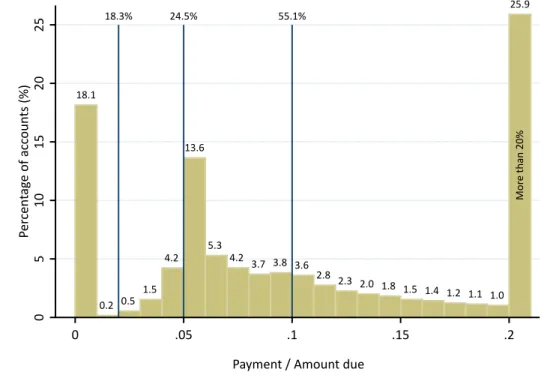
Figure 2 shows a histogram of minimum payment amount/outsanding debt as a proxy of the minimum payment due in percentage terms, a month before the experiment began. The aim is to assess roughly whether a 5% and a 10% MP would bind.14. The Figure suggests that the experimental minimum payments were binding
the month before the experiment started for a substantial fraction of clients: about 25% clients paid less than 5% of debt and 56% paid less than 10% of debt.15
B. The results
Minimum payment policy can aect protability of the bank through two main channels. The rst is selection: it may be that risky clients are the ones that want more leverage and less interested in credit cards with larger minimum payments. Existing risky clients may therefore close their account. The minimum payment may play a screening role as in Adams, Einav & Levin (2009). A second channel is that a higher minimum payment may lead to lower debt through higher payments. This
13See Circular 34/2010 from Banco de Mexico. This experiment was done before this regulation
came into being.
14This is only a rough approximation since the minimum payment formula is more complex than
this ratio, as it includes several fees not in our data.
15In unreported analysis we did not nd evidence of minimum payments inuencing those people
who already pay much more than the minimum. This is evidence against the anchoring explanation of minimum payments, which states that people us the minimum payment as part of the rule of how much to pay, even when it does not bind.
may reduce prots, unless expected loses by the bank decrease substantially. All in all it is not possible to a priori gauge how an increase in minimum payments will impact prots, it is an empirical question we address in what follows for our sample.16
To summarize our ndings, we estimate large eects on debt from higher min-imum paymenbts but much smaller (and temporary) ones in default. In the very short run a higher minimum payment did increase delinquency as some cardholders where caught o guard and suddenly had to pay more. We expected that riskier clients would select out of the higher MP card, either voluntarily or by not being able to pay, such that in the long run surviving account in the high MP would be less risky. This does not seem to be the case.
Table 3 shows the estimates of equation 2.1, comparing debt, purchases, pay-ments, voluntary cancelations, cumulative delinquency, cumulative default, default of surviving accounts, and NDR for the group of consumers who were assigned to pay minimum payments of 10% of debt versus those that only had to pay 5%. Panel A reports results 13 months after treatment and Panel B reports results 26 months after treatments.
Note rst that increasing MP from 5% to 10% causes debt to decrease substan-tially: 133 pesos by April 2008 and 334 pesos by May 2009. This is a large reduction in debt with respect to the 5MP group, almost 24% after 2 years. Payments increase by 97 pesos, which is equivalent to 13% of average payments in the 5MP group. Somewhat surprisingly purchases also increase by 101 pesos 1 year after. We don't know how to explain this. One possibility is that paying more actually liberates credit line and allows consumers to buy more.17 Another possibility is that the higher MP
acts as a commitment device to pay more, and anticipating this clients purchase more knowing that they will have to pay o a larger share of their purchases. All eects are statistically signicant and Lee bounds that take into account attrition still nd eects greater than zero in purchases and payments, unfortunately not for debt.18
16Given that banks do experiment with contract terms and given that MP are actually lower in
reality, we may infer that higher minimum payments will likely hurt prots.
17We found this eect is present however for consumers with less than 50% line utilization.
Delinquency and default increase by about 10% of their respective means, and voluntary cancelations about 7%; i.e. about 1.6pp for voluntary closings and close to 2pp for delinquency and default. Dierential attrition is about 1.5pp in one year and 2.6pp in two years, from a baseline of 38.2pp.
The dynamics of the eects are interesting. Figure 4a shows that initially there is a jump in average debt of the 10MP group. This seems to be the result of the accumulation of late payment fees. By September 2007 however 6 months after the start of the experiment debt is lower in the 10MP group. Payments (Figure4c) also show a sudden increase, whereas in purchases the increase is smoother.
In spite of a inducing a large decrease in debt, the 10% minimum payment treat-ment has a rather small eect on default and delinquency. Moreover, the eect is transitory as reected in Figure 4h: as percentage of surviving accounts there is no dierence in delinquency between the two groups in May 2009. This is also reected in column 8 of Table 3. If bad risks selected out as a result of higher minimum payment, the dotted line in Figure4h should cross the solid line from above and lie below it afterwards. This does not happen.
Finally, cancelations are 16.3% for the 5MP group compared to 18% for the 10MP group. Since higher MP induces substantially less borrowing and has minor impacts on defaults and cancelations, revenue suers. The decrease in net-of-default revenue is close to 4%.
All in all, it seems that higher minimum payments reduce debt but its eects in delinquency and default are short lived, arising from the higher minimum payment surprise.
4 Eect of interest rate variations
There is a growing literature measuring the price elasticity of demand for credit products. Karlan & Zinman (2008, KZ) and Dehejia, Montgomery & Morduch (2012, DMM) are two prominent recent examples. They study take-up elasticities
since debt is a stock variable which is a function of cumulative previous payments and purchases, interest rates (including interest compounding), and fees.
for micronance in South Africa and Bangladesh respectively. While the former uses randomized variation in interest rates, the later use across branch price variation. DMM nd elasticities between -0.7 and -1 while KZ's elasticities are in the order of -0.28. Our paper complements this literature by studying intensive margin responses and by studying credit cards. Gross & Souleles (2002) is the paper most similar to ours in this regard. The main dierence is that we use randomized variation and that we focus on NTB clients in a developing country. It seems that these dierences are not trivial as our elasticity estimates are almost two orders of magnitude smaller.
A. The results
Table4shows our estimates of the eect of interest rates on purchases, payments, delinquency, default, account closings and attrition. We estimate a regression equa-tion analogous to 2.1 but with three treatment dummies indicating 15%, 25%, 35% interest rate treatment groups. We omitted the 45% interest rate category, so eects are measured with respect to this group.
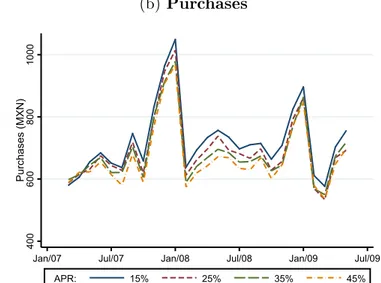
The estimates of purchase elasticities form a change of 45% interest rate to 35%, 25% and 15% interest rate respectively are -0.14, 0.01, -0.13 (measured in May 2009). Payment elasticities are 0.02, 0.12, 0.08 respectively. These relatively low elasticities may reect that NTB clients have limited access to alternative sources of credit.
Note also that debt is positively correlated with interest rates. This is an artifact of interest compounding, as today's interest is tomorrow's debt, and therefore debt accumulates at a faster pace at higher interest (in spite of lower interest rates inducing more purchases and less payments).
The eect on default is not large at all either. Going from 45% to 15% interest reduced the probability of ever defaulting by 2.7pp, which is equivalent to about 10% of mean default. This implies an elasticity of 0.14, relatively small in our view. Large changes in interest rates 19 and their associated incentive and repayment burden
eects are translated into small impacts on default. In other words, we do not nd
19Previous studies of default and interest rates like Adams, Einav & Levin (2009) and Karlan &
Zinman's (2009) relied on a much smaller range of variation to measure eects of interest rates on default.
strong evidence of moral hazard20 even for this population of new borrowers where
asymmetric information is presumably an important part of the context.
This result complements Karlan & Zinman's (2009) in two interesting ways. First our sample is about 25 times as big and aords more statistical power. This is important since most of Karlan & Zinman's (2009)'s estimates of adverse selection and repayment burden are relatively large but not statistically dierent from zero. Second, they work with borrowers who have borrowed from their bank before. This may explain why they do not nd strong evidence of informational asymmetries. In contrast we work with rst time borrowers and still only nd small eects on default, consistent with their results.
Even if there were large asymmetries of information, it may not be worthwhile for NTB borrowers to default on their loans if they are liquidity constrained and have a high marginal utility of consumption, as defaulting closes their current and future access to formal lending. Note also that since credit cards are open-ended loans, and since interest rates were randomized downwards, keeping the card in good status has the option value of accessing cheap credit in the future, as in KZ moral hazard treatment.
5 Conclusions
This paper documents three issues of importance. First, it provides a rare window into bancarization and its perils in a developing country. It shows that the search for credit worthy borrowers is costly since many accounts default and many borrowers leave. Actually net-of-default revenues are not that big. The present discounted value is only 820 pesos on average in the rst two years.
Second, it shows that consumer protection for new borrowers in the form of increases in minimum payments leads only to relatively small eects on default, although it does lead to lower debt and lower bank revenues. Results also show that purchase, payments and debt elasticities are small in the wide range of interest rates
we considered.
Thirdly, we nd only weak evidence moral hazard even for this sample of new and risky borrowers, as the correlation between randomly allocated interest rates and default is small economically.
A Attrition
This appendix asseses the evidence in favor of selective attrition. One problem with giving cards to new (marginal) borrowers is that many of them close their account either voluntarily or by the bank as a result of delinquent behavior. This is certainly present in our data as about 18% of accounts are closed by the borrower and about 23% are closed by the bank.
Attrition can invalidate the causal inference when it is dierential across treat-ments, although Tables 3 and 4provided Lee bounds that are valid in the presence of attrition and we still nd signicant eects. In this appendix we show that the amount of attrition in terms of number of accounts and in terms of the character-istics of the accounts that leave is not signicantly related to treatment status. We also show that debt, payment and purchase behavior are very weak predictors of attrition; 3 months before leaving the sample the accounts behave in the same way as stayers. Dierences are statistically signicant but economically minuscule. This is encouraging because it means that selection at least on observables is not a big threat to validity.
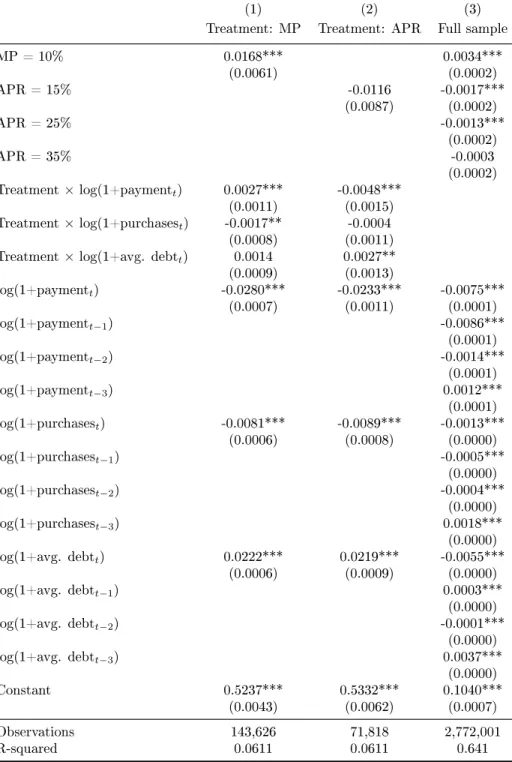
Results are reported in Table 5. Column 1 regresses a dummy variable equal to 1 if the account ever attrited against the 10MP dummy, and regressor of log purchases, log payments, log debt. In this regression we only use observations for the rst month of the experiment as we want a measure of behavior uncontaminated by treatment. Note that although the 10MP dummy is statistically dierent from zero, economically the coecient is small, at 0.01% more attrited accounts in the 10MP treatment compared to the 5MP control. Note also that the interactions of purchases, payments and debt with treatment are quantitatively small: leavers in the 10MP group had 0.2% less payments, 0.1% less purchases, and no signicant dierence in debt than leavers in the 5MP group at the beginning of the experiment. Column 2 repeats the analysis for the interest rate treatments, but focusing only on those with 45% and 15% interest. The dummy for 15% interest rate is not signicant and interactions with previous behavior economically small.
extent account behavior is dierent a three months before leaving the sample. We use a distributed lag of 3 months to capture dierences 1 to 3 months before leaving the sample. The semi-elasticities are tiny for all predictors, less than 0.3%. This means that accounts that leave the sample are very similar in term of purchases, payments and debts to accounts that stayed.
This analysis complements the results using bounds and give more credibility to the main ndings of the paper. Attrition is unlikely to be driving the results we found.
B Tables
Table 1: Summary statistics of key variables
(1) (2) (3) (4)
Raw data Data > 0
Mean Std. Dev Mean Std. Dev
Panel A. Demographic characteristics
Age 42 6 -
-Percentage of males 54 50 -
-Percentage of married 64 48 -
-Income 16,481 11,461 -
-Panel B. Card usage and characteristics (MXN)
Interest paying debt 1,122 3,488 7,145 5,869
Outstanding month-end balance 5,333 5,531 6,006 5,505
Purchases 691 1,764 1,350 2,278
Payments 842 1,654 1,071 1,798
Credit limit 11,819 9,749 -
-Avg. month-to-month change in credit line 203 1,924 4,993 6,517
|Avg. month-to-month change in credit line| 296 1,912 5,014 6,189
Fees incurred in a given month 37 121 393 136
Interest generated in a given month 29 97 183 178
Realized loss by account1 495 1,940 5,196 3,886
Revenue (interests + comissions - loss) by account 820 1,865 1,669 2,002
Months with credit card prior to random assignment2
for the 6-11 months group 8 2 -
-for the 12-23 months group 17 3 -
-for the 24+ months group 51 28 -
-Panel C. Card usage and characteristics (percentages) Percentage of. . .
cards whose limit changes at least once 78 42 -
-months for which limit changes in a given card 6 5 8 4
months in which a fee is paid 10 17 24 19
accounts that pay commissions at least once 44 49 -
-months in which interest is incurred 18 25 33 26
accounts delinquent at least once 30 46 -
-accounts in legal default at least once 27 44 -
-months in default per account3 6 24 -
-accounts cancelled voluntarily 17 38 -
-Attrition 40 49 -
-Sample size (consumer×months) 3,888,000
Notes: Panel A gives demographics for the sample, which were calculated with a subsample for which we had
demographics (N'54 percent of the whole sample). Panel B elicits card usage and characteristics which are measured
in MXN pesos for the full sample. Panel C refers to card characteristics which are measured in percentages. Sample size
excludes the control group as it was not used for analysis. 1 Realized loss refers to the mean outstanding month-end
balance for the month before the account is closed due to default and sent to debt collection. Realized loss is zero if the
account was never closed or if it was closed for reasons dierent from defaulting. 2 Randomization took place in
December 2006. This variable refers to that timeframe. 3 This variable represents the mean number of months, across
Table 2: Baseline Orthogonalit y -M ean s & Standard Deviations in Marc h 2007 (1) (2) (3) (4) (5) (6) (7) (8) (9) (10) (11) In terest ra te : 15% 25% 35% 45% Complete sample P-V alue Sample size Minim um pa ymen t: 5% 10% 5% 10% 5% 10% 5% 10% Panel A. D emo gr aphics Age 42 42 42 42 42 42 42 42 42 0.5664 77,588 (5.55) (5.59) (5.59) (5 .55) (5.61) (5.60) (5.54) (5.58) (5.58) Male 54 55 54 54 54 54 55 54 54 0.5737 77 ,586 Married 65 63 65 64 63 64 63 65 64 0.131 5 38,959 Panel B. Car d char acteristics Avg. Balance 935 917 938 941 969 922 923 952 936 0.8016 143,626 (3,117) (3,061) (3,177) (3,225) (3,240) (3,125) (3,1 23) (3,233) (3,150) Purc hases 579 582 590 586 593 603 593 584 588 0.8720 143,626 (1,500) (1,529) (1,610) (1,573) (1,514) (1,635) (1,6 22) (1,473) (1,552) P ay m en ts 803 805 810 813 807 831 811 826 814 0.683 4 143,626 (1,537) (1,581) (1,655) (1,625) (1,546) (1,734) (1,6 42) (1,626) (1,616) Delinquen t 1.50 1.46 1.44 1.38 1.43 1.59 1.33 1.30 1.43 0.3573 143, 626 Notes: Standard deviations are rep or te d in paren thesis for variables that are not dummies. For dumm y variables, standard deviation can be computed by p p (1 − p ) . Eac h column from 1 to 8 represen ts a die re nt in terest, minim um pa ymen t str at um . Column 9 sho ws the va lues for the complete sample. P-V alue (column 10) represen ts the p-v alue for the null hyp othesis that all strata are equal. Sample size sho ws the num ber of non-missing observ ations for eac h variable in the full sample at the beginning of the exp erimen t.
Table 3: T reatmen t eect for minim um pa yme nt variation (1) (2) (3) (4) (5) (6) (7) (8) (9) Purc hases P aymen ts Debt Cance lled Delinquen t (ev er) Legal default A ttrited Delinquen t (rst) Rev en ue Panel A. Me dium term ee cts (April, 2008) MP = 10% 10 1*** 93.8*** -133** * .972*** 2.55*** 2.7*** 1.56*** -0.058 (9.80) (9. 12) (19.62) (0.16) (0.20) (0.19) (0.20) (.056) Constan t 635*** 742*** 1,123*** 9.04*** 13.6*** 12*** 16.8*** 0. 97*** (6.90) (6. 42) (13.81) (0.11) (0.14) (0.13) (0.14) (0.039) Lee Bounds [89, 109] [80, 96] [-154, 116] [0.88, 1.89] [2.44, 3.2 4] [2. 6, 3.39] -[-0.08, 0.43] Observ ations 118,743 11 8,743 118,743 130,835 128,626 128,549 144,000 118,743 R-squared 0.0009 0.0009 0.0004 0.0003 0.0013 0.0016 0.0004 0.0000 Panel B. Long term ee cts (May, 2009) MP = 10% 11 2*** 96.5*** -334** * 1.64*** 2.07*** 2.24*** 2.62*** -.056 (12.75) (11.01 ) (2 4.53) (0. 23) (0.27) (0.27) (0.26) (.08) Constan t 661*** 767*** 1,384*** 16.3*** 28.7*** 26*** 38.2*** 1. 49*** (8.92) (7. 70) (17.16) (0.16) (0.19) (0.19) (0.18) (0.06) Lee Bounds [83, 229] [63, 198] [-395, 205] [1.34, 3.2] [1.59, 3.2 6] [1.78, 3.52] -[-0.12, 1.12] Observ ations 87,093 87,093 87,093 108,362 112,830 112,301 144,000 87, 093 R-squared 0.0009 0.0009 0.0021 0.0005 0.0005 0.0006 0.0007 0.0000 Panel C. Pr esent value at the be ginning of the exp eriment (Mar ch, 2007) MP = 10% -29.5** (9.82) Constan t 835*** (6.95) Observ ations 144,000 R-squared .0001 Notes: This table sho ws the treatmen t estimates for purc hases, pa ymen ts, debt, cancelations, delinquen t cards, legal default, attrition and rev en ue. Pur chases, pa ymen ts and debt are m easured in 2007 MXN pesos. Cancelled represen ts the percen tage of cards cance lled un til the resp ectiv e mon th. Delinquen t (ev er) represen ts the percen tage of cards who become delinquen t at least once before the resp ectiv e mon th or cards that ha ve been rev ok ed. Deli nq ue nt (rst) represen ts the percen tage of cards who w ere not delinquen t the immediate mon th before and become delinquen t in that sp ecic mon th. Legal default represen ts the percen tage of cards that are delinquen t for more than three mon ths at least once before the resp ectiv e mon th. A ttrited represen ts the pe rcen tage of cards who are out of sample up to the re sp ectiv e mon th. Rev en ue represen ts the presen t value of in terests and commissions incurred min us the realized loss. Lee (2009) bounds are included for those variables a ected by attrition; these bounds are tigh tened using mo nths of credit card use, cardholder's pa ymen t be ha vior prior to the exp erimen t and in terest rate assigned. Standard errors are sho wn in paren thesis. ***, ** and * represen t statistical signicance at the 1, 5 and 10 percen t resp ectiv ely .
Table 4: T reatmen t eect for in terest rate variation (1) (2) (3) (4) (5) (6) (7) (8) (9) Purc hases P aymen ts Debt Cancelled Delinquen t (ev er) Legal default A ttrited Delinquen t (rst ) Rev en ue Panel A. Me dium term ee cts (April, 2008) Rate = 15 % 90.9*** -34** -239*** -1.51** * -1.16*** -.907*** -.931** -.256** (13.87) (12.91) (27.75) (0.23) (0.28) (0.27) (0.28) (.079) Rate = 25 % 53.9*** -32.2* -1 34*** -1.17*** -.654* -.551* -.811** -.077 (13.87) (12.91) (27.76) (0.23) (0.28) (0.27) (0.28) (.079) Rate = 35 % 26.4 -9.78 -36 -.62** -.361 -.231 -.156 -.063 (13.90) (12.94) (27.81) (0.23) (0.28) (0.27) (0.28) (.079) Constan t 643*** 808*** 1,160*** 10.3*** 15. 4*** 13.8*** 18*** 1.04*** (9.83) (9.15) (19.68) (0.16) (0.20) (0.19) (0.20) (.0561869) Lee Bounds [70, 99] [-51, -25] [-331, -229] [-1.62, -1.5] [-1.88, -1.03] [-1.58, -0.79] -[0.24, 0.4 6] Observ ations 11 8,743 118,743 118,743 130,835 128,6 26 128,549 144,000 118,743 R-squared 0.000 4 0.0001 0.0008 0.0004 0.0001 0.0001 0.0001 0.0001 Panel B. Long term ee cts (May, 2009) Rate = 15 % 59.2** -42 ** -238*** -3. 67*** -2.89*** -2.76*** -3.39*** -.006 (18.05) (15.58) (34.73) (0.32) (0.38) (0.38) (0.36) (.115) Rate = 25 % -3.46 -43.6** -167*** -2.8*** -2. 08*** -2.03*** -2.47* ** .001 (18.11) (15.64) (34.85) (0.32) (0.39) (0.38) (0.36) (.115) Rate = 35 % 21.9 -4.37 -46.3 -1.51*** -.678 -.585 -.989** .139 (18.22) (15.74) (35.06) (0.32) (0.39) (0.38) (0.36) (.116) Constan t 696*** 837*** 1,335*** 19.1*** 31. 2*** 28.5*** 41.2*** 1.43*** (12.94) (11.17) (24.90) (0.23) (0.27) (0.27) (0.26) (.082) Lee Bounds [-195, 103] [-243, 3.85] [-805, -175] [-4.49, -3.52] [-4.91, -2.1] [-4.94, -2.01] -[-.07, 1. 30] Observ ations 87,093 87,093 87,093 108,362 112,830 112,301 144,000 87,093 R-squared 0.000 2 0.0002 0.0007 0.0013 0.0006 0.0006 0.0007 .0000 Panel C. Pr esent value at the be ginning of the exp eriment (Mar ch, 2007) Rate = 15 % -490*** (13.83) Rate = 25 % -337*** (13.83) Rate = 35 % -170*** (13.83) Constan t 1070*** (9.78) Observ ations 144,000 R-squared .0097 Notes: TThis table sho ws the treatmen t estimates for purc hases, pa ymen ts, debt, cancelations, delinquen t cards, legal default, attrition and rev en ue. Pur chases, pa ymen ts and debt are m easured in 2007 MXN pesos. Cancelled represen ts the percen tage of cards cance lled un til the resp ectiv e mon th. Delinquen t (ev er) represen ts the percen tage of cards who become delinquen t at least once before the resp ectiv e mon th or cards that ha ve been rev ok ed. Deli nq ue nt (rst) represen ts the percen tage of cards who w ere not delinquen t the immediate mon th before and become delinquen t in that sp ecic mon th. Legal default represen ts the percen tage of cards that are delinquen t for more than three mon ths at least once before the resp ectiv e mon th. A ttrited represen ts the pe rcen tage of cards who are out of sample up to the re sp ectiv e mon th. Rev en ue represen ts the presen t value of in terests and commissions incurred min us the realized loss. Lee (2009) bounds are included for those variables a ected by attrition. In this case, the bounds represen t upp er and lo w er bounds for the rate = 15% treatmen t; these bounds are tigh tened using mon ths of credit card use, cardholder's pa ymen t beha vior prior to the exp erimen t and minim um pa ymen t assigned. Standard errors are sho wn in paren thesis. *** ,** and * represen t statistical signicance at the 1, 5 and 10 percen t resp ectiv ely .
Table 5: Attrition results
(1) (2) (3)
Treatment: MP Treatment: APR Full sample
MP = 10% 0.0168*** 0.0034*** (0.0061) (0.0002) APR = 15% -0.0116 -0.0017*** (0.0087) (0.0002) APR = 25% -0.0013*** (0.0002) APR = 35% -0.0003 (0.0002) Treatment×log(1+paymentt) 0.0027*** -0.0048*** (0.0011) (0.0015) Treatment×log(1+purchasest) -0.0017** -0.0004 (0.0008) (0.0011)
Treatment×log(1+avg. debtt) 0.0014 0.0027**
(0.0009) (0.0013) log(1+paymentt) -0.0280*** -0.0233*** -0.0075*** (0.0007) (0.0011) (0.0001) log(1+paymentt−1) -0.0086*** (0.0001) log(1+paymentt−2) -0.0014*** (0.0001) log(1+paymentt−3) 0.0012*** (0.0001) log(1+purchasest) -0.0081*** -0.0089*** -0.0013*** (0.0006) (0.0008) (0.0000) log(1+purchasest−1) -0.0005*** (0.0000) log(1+purchasest−2) -0.0004*** (0.0000) log(1+purchasest−3) 0.0018*** (0.0000) log(1+avg. debtt) 0.0222*** 0.0219*** -0.0055*** (0.0006) (0.0009) (0.0000) log(1+avg. debtt−1) 0.0003*** (0.0000) log(1+avg. debtt−2) -0.0001*** (0.0000) log(1+avg. debtt−3) 0.0037*** (0.0000) Constant 0.5237*** 0.5332*** 0.1040*** (0.0043) (0.0062) (0.0007) Observations 143,626 71,818 2,772,001 R-squared 0.0611 0.0611 0.641
Notes: Regressions (1) and (2) take only the information from the rst month of the experiment. Both regressions have, as the dependent variable, a dummy that is equal to one when the account disappears from the sample at any point of time through the experiment for any reason. For these two columns, treatment is indicated above the column number. Sample size varies from column (1) to column (2) since, for the latter, only two interest rate groups are considered while in the former all interest rates are considered. Regression (3) predicts attrition for the next month taking into
consideration the information from the past three months. The dependent variable is a dummy that is equal to one when the account closes in the following month. For all regressions, standard errors are in parenthesis. In column (3) standard errors are clustered at the individual level and time xed-eects are used. ***, ** and * represent statistical signicance at the 1, 5 and 10 percent respectively.
C Figures
Figure 1: Credit cards are the main bancarization instrument
(a) Growth in CC holdings by income decile (2004-2010) 0 50 100 150 200 250 G ro w th +(% ) 0 2 4 6 8 10 Income+decile
(b) Entry into formal credit by type of loan (2011) 0 20 40 60 Pe rce nt ag e (% )
Auto Bank Dept. stores Other Personal/Payroll Phone
All New clients
Source: Banco de México: ((a) ENIGH and (b) Credit bureau.)
Figure 2: Payment / Current amount due at the beginning of the experiment
18.1 0.2& 0.5& 1.5& 4.2& 13.6 5.3&
4.2& 3.7& 3.8& 3.6&
2.8& 2.3& 2.0& 1.8&1.5& 1.4& 1.2& 1.1& 1.0& 25.9 Mo re &th an &2 0% 18.3% 24.5% 55.1% 0 5 10 15 20 25 Pe rc en tag e& of &ac co un ts &(% ) 0 .05 .1 .15 .2 Payment&/&Amount&due
Notes: This histogram shows consumers distributed by their payment / amount due at March 2007, which was when the experiment began. Blue lines show the amount of consumers who are at most at that specic payment/amount due. The last bar groups all of those people whose quotient of payment / amount due is more than 20.
Figure 3: Bank revenue from the complete sample
Notes: This histogram shows the present value of interests and commissions incurred in the sampling period minus a measure of realized loss whenever the account defaulted and later on attrited from the sample. Figure has both tails trimmed to exclude outliers. The present value was computed using a 3 percent rate.
Figure 4: Minimum payment variations: Results (a) Debt 900 1000 11 00 1200 1300 1400 A ve ra ge b al an ce (MXN )
Jan/07 Jul/07 Jan/08 Jul/08 Jan/09 Jul/09 MP: 5% MP: 10% (b) Purchases 400 600 800 1000 1200 Pu rch ase s (MXN )
Jan/07 Jul/07 Jan/08 Jul/08 Jan/09 Jul/09
MP: 5% MP: 10% (c) Payments 700 800 900 1000 11 00 Pa yme nt s (MXN )
Jan/07 Jul/07 Jan/08 Jul/08 Jan/09 Jul/09
MP: 5% MP: 10%
(d) Accounts (%) with positive average balance
12 14 16 18 20 Acco un ts (% )
Jan/07 Jul/07 Jan/08 Jul/08 Jan/09 Jul/09
MP: 5% 10%
Figure 4: Minimum payment variations: Results (2)
(e) Accounts in delinquency at least once
0 10 20 30 Acco u n ts (% )
Jan/07 Jul/07 Jan/08 Jul/08 Jan/09 Jul/09
MP: 5% MP: 10% (f) Cancelled accounts 0 5 10 15 20 Acco u n ts (% )
Jan/07 Jul/07 Jan/08 Jul/08 Jan/09 Jul/09
MP: 5% MP: 10%
(g) Accounts in legal default at least once
0 10 20 30 Acco u n ts (% )
Jan/07 Jul/07 Jan/08 Jul/08 Jan/09 Jul/09
MP: 5% MP: 10%
(h) Month of rst delinquency after being OK
.6 .8 1 1.2 1.4 1.6 Acco u n ts (% )
Jan/07 Jul/07 Jan/08 Jul/08 Jan/09 Jul/09
Fecha
MP: 5% MP: 10%
Notes: Debt (4a), purchases (4b) and payments (4c) are measured in March 2007 MXN pesos. Accounts in delinquency
(4e) refers to the percentage of accounts that are delinquent or that have fallen in delinquency at least once before the
given month; cancelled accounts (4f) refers to the cumulative percentage of accounts that are cancelled up to the given
month. Finally accounts in legal default (4g) refers to the accounts who are in legal default or that have been once in
legal default before the given date and (4h) plots a dummy equal to one if the account falls in delinquency and yesterday
Figure 5: Annual percentage rate variations: Results
(a) Average Balance
900 1000 11 00 1200 1300 A ve ra ge b al an ce (MXN )
Jan/07 Jul/07 Jan/08 Jul/08 Jan/09 Jul/09
APR: 15% 25% 35% 45% (b) Purchases 400 600 800 1000 Pu rch ase s (MXN )
Jan/07 Jul/07 Jan/08 Jul/08 Jan/09 Jul/09
APR: 15% 25% 35% 45% (c) Payments 700 800 900 1000 11 00 Pa yme nt s (MXN )
Jan/07 Jul/07 Jan/08 Jul/08 Jan/09 Jul/09
APR: 15% 25% 35% 45%
(d) Accounts (%) with positive average balance
12 14 16 18 Acco un ts (% )
Jan/07 Jul/07 Jan/08 Jul/08 Jan/09 Jul/09
APR: 15% 25% 35% 45%
Figure 5: Annual percentage rate variations: Results (2)
(e) Accounts in delinquency at least once
0 10 20 30 Acco u n ts (% )
Jan/07 Jul/07 Jan/08 Jul/08 Jan/09 Jul/09 APR: 15% 25% 35% 45% (f) Cancelled accounts 0 5 10 15 20 Acco u n ts (% )
Jan/07 Jul/07 Jan/08 Jul/08 Jan/09 Jul/09 APR: 15% 25% 35% 45%
(g) Accounts in legal default at least once
0 10 20 30 Acco u n ts (% )
Jan/07 Jul/07 Jan/08 Jul/08 Jan/09 Jul/09 APR: 15% 25% 35% 45%
(h) Month of rst delinquency after being OK
.6 .8 1 1.2 1.4 1.6 Acco u n ts (% )
Jan/07 Jul/07 Jan/08 Jul/08 Jan/09 Jul/09
Fecha
APR: 15% 25% 35% 45%
Notes: Debt (5a), purchases (5b) and payments (5c) are measured in March 2007 MXN pesos. Accounts in delinquency
(5e) refers to the percentage of accounts that are delinquent or that have fallen in delinquency at least once before the
given month; cancelled accounts (5f) refers to the cumulative percentage of accounts that are cancelled up to the given
month. Finally accounts in legal default (5g) refers to the accounts who are in legal default or that have been once in
legal default before the given date and (5h) plots a dummy equal to one if the account falls in delinquency and yesterday
References
Adams, William, Liran Einav, and Jonathan Levin. 2009. Liquidity Constraints and Imperfect Information in Subprime Lending. The American Economic Review,
99(1): pp. 4984.
Dehejia, Rajeev, Heather Montgomery, and Jonathan Morduch. 2012. Do interest rates matter? Credit demand in the Dhaka slums. Journal of Development Economics, 97(2): 437 449.
Gross, David B., and Nicholas S. Souleles. 2002. Do Liquidity Constraints and Interest Rates Matter for Consumer Behavior? Evidence from Credit Card Data. Quarterly Journal of Economics, 117(1): 149185.
Karlan, D., and J. Zinman. 2008. Credit Elasticities in Less-Developed Economies: Implications for Micronance. American Economic Review, 98(3): 10401068. Karlan, Dean, and Jonathan Zinman. 2009. Observing Unobservables: Identifying
Information Asymmetries with a Consumer Credit Field Experiment. Econometrica, 77(6): pp. 19932008.
Laibson, David, Andrea Repetto, and Jeremy Tobacman. 2003. A Debt Puzzle. In Knowledge, Information, and Expectations in Modern Economics: In Honor of Edmund S. Phelps. , ed. Philippe Aghion, Roman Frydman, Joseph Stiglitz and Michael Woodford. Princeton University Press.
Lee, David S. 2009. Training, Wages, and Sample Selection: Estimating Sharp Bounds on Treatment Eects. The Review of Economic Studies, 76(3): 10711102.
Meier, Stephan, and Charles Sprenger. 2010. Present-Biased Preferences and Credit Card Borrowing. American Economic Journal: Applied Economics, 2(1): 193210. Smale, Pauline. 2005. Credit Card Minimum Payments: RS22352. Congressional
Research Service: Report, 1.
Stewart, Neil. 2009. The Cost of Anchoring on Credit-Card Minimum Repayments. Psychological Science, 20(1): 3941.