Automated Software Testing of Memory
Performance in Embedded GPUs
Sudipta Chattopadhyay
Petru Eles
Zebo Peng
Link¨oping University{sudipta.chattopadhyay,petru.eles,zebo.peng}@liu.se
Abstract
Embedded and real-time software is often constrained by several temporal requirements. Therefore, it is important to design embed-ded software that meets the required performance goal. The incep-tion of embedded graphics processing units (GPUs) brings fresh hope in developing high-performance embedded software which were previously not suitable for embedded platforms. Whereas GPUs use massive parallelism to obtain high throughput, the over-all performance of an application running on embedded GPUs is often limited by memory performance. Therefore, a crucial prob-lem lies in automatically detecting the inefficiency of such software developed for embedded GPUs. In this paper, we propose GUPT, a novel test generation framework that systematically explores and detects poor memory performance of applications running on em-bedded GPUs. In particular, we systematically combine static anal-ysis with dynamic test generation to expose likely execution scenar-ios with poor memory performance. Each test case in our generated test suite reports a potential memory-performance issue, along with the detailed information to reproduce the same. We have imple-mented our test generation framework using GPGPU-Sim, a cycle-accurate simulator and the LLVM compiler infrastructure. We have evaluated our framework for several open-source programs. Our experiments suggest the efficacy of our framework by exposing nu-merous memory-performance issues in a reasonable time. We also show the usage of our framework in improving the performance of programs for embedded GPUs.
1.
Introduction
Embedded and real-time software is often required to satisfy sev-eral timing constraints. Therefore, validating the performance of embedded software is a critically important problem. Performance validation methodologies aim toautomaticallydetect corner sce-narios that capture poor performance behaviour of embedded soft-ware. In the absence of such validation techniques, an embedded software may suffer from serious performance failure at runtime. As a result, performance validation methodologies are required early during the design process of the software. In this way, the reported performance issues can be fixed to avoid runtime failure.
Graphics processing units (GPUs) have gained popularity as a flexible and efficient solution for parallel processing. During the
[Copyright notice will appear here once ’preprint’ option is removed.]
last decade, researchers have shown significant performance gains that could be achieved using mainstream GPUs. Consequently, many embedded devices (e.g.smartphones) are now equipped with programmable GPUs. A few examples of such embedded GPUs include graphics processing cores designed by Vivante, ARM and AMD. As primarily targeted for power-constrained devices, em-bedded GPUs often have very restricted features compared to main-stream GPUs. Such restrictions include small caches, limited or no support of low-latency shared memory, among others. Therefore, careful design choices are required to develop high-performance embedded software on embedded GPUs [23].
One appealing feature of general-purpose GPU (GPGPU) pro-gramming is the availability of powerful propro-gramming abstrac-tions. For instance, to perform a certain computation by GPU, a programmer writes the code for only oneGPU threadand spec-ifies the number of threads to execute. On one hand, such pro-gramming abstractions provide developers tremendous flexibility in writing parallel modules. On the other hand, due to such layer of programming abstractions, the execution pattern of a GPGPU application remainscompletely hiddenfrom the developer. As a result, it becomes potentially impossible for a developer to detect and understand the hidden performance problems in an embedded GPGPU application. As pointed out by existing literature, memory subsystems may significantly limit the performance gain from par-allelism offered by GPUs [17, 18]. Accessing the global-memory (DRAM) in embedded GPUs is several magnitudes slower than ac-cessing on-chip memories (e.g.caches). Although such slow mem-ory accesses are partially overlapped by computations, an applica-tion launched in the GPU may suffer from performance problems due to the congestion in the memory controller or caches [18]. In embedded GPUs, such performance problems might be critical due to limited on-chip memories. Moreover, detecting such problems is challenging due to the presence of a huge number of possible exe-cution scenarios (e.g.different inputs and thread schedules) and it is potentially infeasible to run an application for all such scenarios. Therefore, it is highly desirable that such performance problems are systematically detected and highlighted to the developer via auto-mated software testing.
In this paper, we propose GUPT, an automated test generation framework to systematically detect performance problems in em-bedded GPGPU applications. In particular, our framework system-atically explores execution scenarios which may create substantial interferences from different threads in the memory subsystem (e.g. memory controller and on-chip caches) and prolong the overall ex-ecution time of the respective application. We generate a test suite where each test case highlights a specific execution scenario (i.e. inputs and thread schedules) that leads to such inefficiencies in the GPGPU program. Systematically detecting such performance issues is challenging for several reasons. First of all, application code is, in general, not annotated with any extra-functional
proper-ties (e.g.time). Besides, a GPGPU program has a potentially large number of execution scenarios. As a result, any naive test genera-tion strategy is eitherinfeasiblein practice (e.g.exhaustive testing) or it may lead to an extremely low coverage of the potential per-formance problems. In our framework, we solve these challenges by first producing a summary of all GPU threads via static analy-sis. Subsequently, this summary is used to guide the test generation to produce memory-performance stressing test cases. Although tar-geted for embedded GPGPU applications, we believe that such a test generation strategy is also useful for other embedded software, such as applications running on embedded multi-core processors.
To guide a test generation that stresses memory-performance, it is critically important to identify the causes of memory perfor-mance issues. In this work, we primarily focus on perforperfor-mance is-sues that arise due to the interferences created by different threads. We broadly classify such interferences intodirect interferencesand indirect interferences. Adirect interferencecan be described as a scenario where a substantial number of threads access the DRAM, creating memory congestion and affecting the overall execution time. Anindirect interferenceis caused when GPU threads replace each others content in on-chip caches, resulting in substantial traf-fic to the DRAM. To systematically explore such scenarios, it is crucial to compute the potential locations of DRAM accesses and on-chip cache states of different GPU threads. We accomplish this by statically analyzing a GPGPU program. The static analyzer pro-duces a summary of different GPU threads. Such a summary does not take into account the possible interference among threads and it is computedonly once. Typical information in this summary in-cludes potential locations of DRAM accesses and cache states in GPU threads. Once this summary is computed, we invoke a guided test generation. The general strategy behind this guidance is to gen-erate appropriate interferences in the on-chip caches and DRAM which may affect the overall execution time.
Our test generation revolves around systematically exploring execution states using the summary generated by static analyzer. We first execute the GPGPU program under test with a random in-put and we comin-pute a symbolic state for each GPU thread. Such a symbolic state captures the set of all inputs that lead to the respec-tive execution scenario of the thread. In GPUs, threads are often scheduled in batches (e.g. warpsin CUDA terminologies). In such cases, we merge the symbolic states from different threads of the same group (e.g. warpin CUDA) and produce a symbolic state for each group. To generate a new execution scenario that is likely to lead to a memory-performance issue, we employ several strategies. We manipulate the symbolic state in such a fashion that the result-ing input is likely to lead to substantial DRAM traffic. For instance, we generate a new input that follows a control dependence edge (in the control dependence graph of the GPGPU program) which leads to potentially high DRAM accesses. Besides, while schedul-ing threads (or groups of threads), we select threads (or groups of threads) that may issue potentially high DRAM requests or create substantial on-chip cache conflicts. We monitor each execution to record the DRAM congestion or on-chip cache conflicts. We con-tinue exploring different execution scenarios in a similar fashion, as long as the time budget dedicated to testing permits or all execu-tion states with potential DRAM accesses are visited. As we target memory-performance, the quality of our generated test suite is pro-vided via the coverage of potential DRAM access locations in each thread.
Contribution In summary, we have proposed and developed a test generation framework to expose memory-performance bottlenecks in embedded GPGPU applications. Due to the limited availability of on-chip memories in embedded GPUs, such performance bot-tlenecks should be addressed in order to develop high performance embedded software. Our proposed framework uses the power of
L1 cache Shared memory ... Streaming multiprocessor
L1 cache memoryShared ... Streaming multiprocessor SIMD cores ... Global memory ... ... GPU Warps
Warp interferences detected by test generation framework Memory controller
Figure 1. An abstract view of the GPU targeted by our framework both static analysis and dynamic test generation to expose as many performance issues as possible for a given time budget. Each test case in our generated test report highlights a memory performance issue and the respective execution scenario (i.e. raw inputs and thread schedules) that leads to the same. The primary use of our framework is to help developer write efficient embedded applica-tions by reporting the existing performance issues. Besides, our generated test-suite can be run on a specific embedded GPU and the replicated problems can be investigated by existing GPU-based profilers. We have implemented our entire framework on top of GPGPU-Sim [8], LLVM compiler infrastructure [4] and GKLEE symbolic virtual machine [22]. Specifically, GPGPU-Sim is used to implement the static analyzer and monitor the execution of a GPGPU program. The LLVM compiler and GKLEE are used to compute the symbolic state for a specific execution scenario. Our evaluation with several CUDA SDK kernels [2] reveals that our framework uncovers memory performance issues early during the test generation. In particular, some of our evaluations reveal that algorithmically more efficient (low computational complexity) GPU implementation may lead to poor performance compared to a naive GPU implementation of the same functionality. This happens due to the inherent memory interferences at the micro-architecture level. Finally, we show the usage of our framework to improve the performance of some GPGPU programs.
2.
System Architecture
Figure 1 shows the relevant portions of a GPU architecture targeted by our test generation framework. The GPU contains a number of streaming multiprocessors (SM). Each SM contains several cores to execute batches of GPU threads. Besides, each SM contains an on-chip L1 cache and it may also contain an on-on-chip shared-memory. In this work, we do not consider the presence of an L2 cache. Therefore, the global-memory (DRAM) needs to be accessed for an L1 cache miss. The architecture shown in Figure 1 captures an abstract view of typical embedded GPUs. For instance, the embedded GPU designed by Vivante [6] has a similar architecture, except the presence of an on-chip shared memory.
The input to our test generation framework is the implemen-tation of a GPU kernel using CUDA1 [3]. Each SM in the GPU
fetches and schedules a batch of GPU threads (called warp in CUDA terminologies). At any instant, one or more warps might be active on the same SM. Finally, we assume that thewarp scheduler is invoked only if a running warp isblocked(e.g.due to DRAM transaction or synchronization barrier). The warp scheduler selects a warp from a pool of all warps ready for execution and issues the warp into an SM. It is worthwhile to note that the exact selection strategy of such a warp scheduler is typicallyunknownand it may
1Our framework is equally applicable for OpenCL kernels. However, our implementation currently supports only CUDA kernels.
also vary depending on the specific execution platform. Moreover, even for a specific execution platform, the warp scheduler may expose non-deterministic behaviour, as discussed in [19]. There-fore, without loss of generality, we shall only consider the non-deterministic behaviour in warp selection strategy.
Time Warp 1 Memory Computation Memory Warp 2 Wait Congestion Memory Warp 2 Time Warp 1 Cache conflict (Cache miss) Memory Memory Memory Congestion Time Wait Warp 2 Warp 1 (a) (b) (c)
Figure 2. (a) DRAM congestion, (b) inter-warp cache conflict, (c) congestion overhead does not affect the overall execution time
In this work, we specifically detect memory-performance issues due to inter-warp interferences. This might appear due to(i)DRAM congestion, or(ii)additional cache misses due to inter-warp con-flicts. As pointed out by recent literature [18], this is a critical is-sue which often limits the potential performance gain from GPU. Therefore, during the test generation process, we have overhead in the following two scenarios:
•A warp waits for a global-memory transaction due to other warps accessing the global-memory. We call this scenario a direct interference.
•A warp faces additional L1 cache misses due to the on-chip cache conflicts generated by other warps. We call this scenario anindirect interference.
Figure 2(a) and Figure 2(b) show examples of adirect inter-ference and anindirect interference, respectively, assuming that DRAM can service only one memory transaction at a time. Fig-ure 2(c) captFig-ures a scenario where the overall execution time is not affected even in the presence of inter-warp interferences. Our framework does not report such scenarios, as the overall execution time is unaffected by the memory interference.
3.
Overview
In this section, we shall illustrate our test generation framework via an example. For the sake of simplicity in this example, we shall generically describe a thread as the scheduling unit in a GPU. How-ever, our methodology is equally applicable where the scheduling unit is a group of threads and our current implementation considers awarp(in CUDA terminologies) as the scheduling unit.
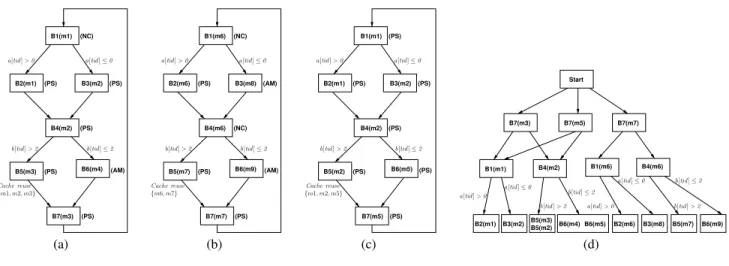
Figures 3(a)-(c) show the control flow graphs (CFGs) of three different GPU threadsT1,T2and T3from a GPU kernel. It is worthwhile to note that different GPU threads in a GPU kernel have the same CFG, which captures the static control flow of the GPGPU code. However, these threads may access different data. Figures 3(a)-(c) show three such GPU threads which access differ-ent memory blocks via their iddiffer-entitiesT1,T2andT3. These thread identifiers are captured viatid. For the sake of illustration, we shall assume a direct-mapped cache, a single-bank DRAM and the fol-lowing cache-mapping pattern: {m1, m4} 7→ S1, m2 7→ S2,
{m3, m5} 7→ S3, {m6, m8, m9} 7→ S4, m7 7→ S5.
There-fore, memory blocksm1andm4(and similarly, memory blocks
m3, m5andm6, m8, m9) can evict each other from the cache.
To generate memory-performance stressing test cases, we first perform a static analysis of the GPGPU code and extract asummary of each thread. This static analysis is light-weight in the sense that it analyzes each threadin isolationand therefore, it does not take into account any interference between threads. The interference be-tween threads is later considered during the test generation process. The primary purpose of the static analyzer is to extract relevant in-formation that can guide the test generation process. Specifically, the summary computed by the static analyzer contains three differ-ent information:(i)a set of locations in each thread where DRAM might be accessed,(ii)possible reuse of cache contents at differ-ent program locations, and(iii)cache conflicts generated by each thread. This summary is utilized to generate execution scenarios that may potentially exhibit direct and indirect memory interfer-ences (cf.Section 2). According to [25], we classify memory ref-erences as AH (always in the cache when accessed), AM (never in the cache when accessed) or PS (never evicted from the cache). If a memory reference cannot be classified as AH, AM or PS, it is categorized asnon-classified(NC). Figures 3(a)-(b) show this cat-egorization beside each memory reference. It is important to note that AM and NC categorized memory references are the potential locations for frequent DRAM requests. The reuse of cache contents and cache conflicts can be computed via backward data flow analy-sis. For instance, consider the exit point of basic blockB5. Thread
T1can reuse only{m1, m2, m3}from the cache, asm4isalways evicted bym1before being reused from the cache (cf.Figure 3(a)). However, for threadT3, all the memory blocks{m1, m2, m5}
might be reused (cf.Figure 3(b)). This is due to the absence of any intra-thread cache conflicts inT3.
We start our test generation process by executing the GPU ker-nel for a random input. Let us assume that we start with a ran-dom inputha[T1. . . T3] = 0, b[T1. . . T3] = 0i. Once the kernel finishes execution, we extract the symbolic state for each thread to capture the respective execution scenario. For instance, the fol-lowing three conditions capture the initial execution scenarios of
T1, T2andT3:(i)ΦT1 :a[T1] ≤ 0∧b[T1] ≤ 2,(ii) ΦT2 :
a[T2]≤0∧b[T2]≤2and(iii)ΦT3:a[T3]≤0∧b[T3]≤2.
Let us now assume that we want to stress memory-performance via indirect interferences (cf.Figure 2(b)). For each thread, we first choose an appropriate symbolic state that is likely to generate on-chip cache conflicts. To accomplish this, we manipulate the symbolic states from previous execution scenarios. For instance, consider threadT1. We observe that memory blockm3creates cache conflicts to threadT3and access tom3is control dependent on the branch conditionb[T1]>2(cf.Figure 3(d)). Therefore, we negate the branch conditionb[T1]≤2from the previous execution to generate the symbolic stateΦ0
T1≡a[T1]≤0∧ ¬(b[T1]≤2)
for threadT1. In a similar fashion, in T3, since memory block
m5 creates cache conflicts to m3 and access to m5 is control dependent on the branch conditionb[T3] ≤ 2(cf.Figure 3(d)), we use the symbolic stateΦT3 ≡a[T3]≤ 0∧b[T3] ≤2from
the initial execution. In general, we use the control dependence graph (CDG) to find a symbolic state that leads to the maximum inter-thread conflicts. For instance inT3(cf.Figure 3(d)), only the control dependence edgehB4(m2), B6(m5)ileads to inter-thread conflicts, due to the memory referencem5. As a result, forT3, we choose a symbolic state that satisfies the condition to execute hB4(m2), B6(m5)i(i.e.b[tid]≤2). ThreadT2does not create any inter-thread conflicts. Therefore, we choose a symbolic state that may potentially generate more memory traffic. Note thatm8
and m9are classified as AM. Since access to m8 and m9 are control dependent on the conditionala[T2]≤0andb[T2]≤2(cf. Figure 3(d)), respectively, we choose the symbolic stateΦT2 for
threadT2. Finally, to execute the kernel, we generate a concrete input satisfying the formulaΦ0
(PS) (PS) (PS) (PS) (AM) B1(m1) B2(m1) B3(m2) B4(m2) B5(m3) B6(m4) B7(m3) (PS) (NC) a[tid]≤0 a[tid]>0 b[tid]>2 b[tid]≤2 Cache reuse {m1, m2, m3} (PS) (PS) (AM) (PS) (NC) B1(m6) B2(m6) B4(m6) B5(m7) B7(m7) B3(m8) B6(m9) (AM) (NC) a[tid]≤0 a[tid]>0 b[tid]>2 b[tid]≤2 Cache reuse {m6, m7} (PS) (PS) (PS) (PS) (PS) (PS) (PS) B1(m1) B2(m1) B3(m2) B4(m2) B6(m5) B7(m5) B5(m2) a[tid]≤0 a[tid]>0 b[tid]>2 b[tid]≤2 Cache reuse {m1, m2, m5} B7(m5) B7(m7) B1(m1) B2(m1) B4(m2) Start B7(m3) B3(m2) B6(m4) B6(m5) B1(m6) B4(m6) B2(m6) B3(m8) B5(m7) B6(m9) B5(m3) B5(m2) a[tid]>0 a[tid]≤0 b[tid]≤2 b[tid]>2 a[tid]>0 a[tid]≤0 b[tid]≤2 b[tid]>2 (a) (b) (c) (d)
Figure 3. Control flow graphs (CFGs) of thread (a)T1, (b)T2and (c)T3. (d) Control dependence graph (CDG) of the GPU kernel. Variable
tidcaptures thread identity. The annotationBx(mx)captures the basic block identity asBxand the memory blockmxaccessed therein. In the preceding paragraph, we have outlined the technique to
generate new test inputs for stressing the memory-performance. Apart from generating new test inputs, it is also important to sys-tematically schedule threads, so that it is likely to lead to memory-performance problems. For instance, let us consider an execution scenario for a test inputθ∈Φ0T1∧ΦT2∧ΦT3and the time where
threadT1is blocked to fetchm3from DRAM. At this point, we schedule a thread which creates maximum cache conflicts to the reused cache content. Note thatT1may reuse{m1, m2, m3}from the cache (cf.Figure 3(a)) after it becomes ready for execution. ThreadT2does not create any conflict to the reused cache content {m1, m2, m3}, whereas accessing memory blockm5inT3 cre-ates conflict tom3. As a result, if bothT2andT3are ready for execution, we scheduleT3whenT1is blocked to fetchm3from DRAM. In a similar fashion, we scheduleT1whenT3is blocked to fetchm5from DRAM. Continuing in this way, for a test input
θ ∈Φ0
T1∧ΦT2∧ΦT3, threadsT1andT3keep replacing cache
contents and generate potentially high DRAM traffic. We continue to generate new test inputs and thread schedules in this fashion as long as the time budget dedicated to testing permits.
The overall intuition behind the generation of direct memory interferences is similar to the technique outlined in the preced-ing paragraphs. In this case, the cache access categorization (i.e. AH-AM-PS-NC categorization) guides the test generation process. Specifically, the symbolic states and thread schedules are generated in such a fashion that it leads to a substantial number of NC or AM classified memory references. For instance, we select the symbolic statesa[tid]≤0∧b[tid]≤2for bothT1andT2. This is because, memory referencesm4,m8andm9are categorized as AM and access tom4, m8, m9are control dependent on the branch con-ditionala[tid] ≤ 0andb[tid] ≤ 2(cf.Figure 3(d)). Besides, if bothT1(orT2) andT3are simultaneously ready for execution, we scheduleT1(orT2) to generate more DRAM traffic.
It is worthwhile to note that even for this simple example, it is non-trivial to systematically generate test inputs that expose memory-performance problems. For instance, consider any input that satisfies the symbolic condition V
t∈{T1,T2,T3}a[t] > 0∧ b[t] > 2. Such inputs do not generate any memory-performance problems. This is due to the absence of any inter-thread cache con-flicts and DRAM congestion. As a result, any ad-hoc test gener-ation strategy may lead to a poor coverage of the existing per-formance problems. In a similar fashion, consider any test input
θ∈V
t∈{T1,T2}(a[t]≤0∧b[t]>2)∧a[T3]≤0∧b[T3]≤2. If
we interleave the execution ofT1andT2(instead ofT1andT3),
GPU kernel Static analysis
Cache hit/miss classification Cache reuse information Cache conflict information Test suite explorer Program path Schedule explorer Thread−level summaries monitor Execution Potential memory bottleneck
(Memory congestion/on−chip cache conflicts affecting execution time)
Dynamic test generation
Figure 4. Overall test generation framework
the resulting schedule may not generate substantial cache conflicts to uncover a potential memory-performance issue. This is because
T2does not generate any cache conflict toT1. In our proposed framework, the summary computed by the static analyzer systemat-ically guides the test generation process and computes appropriate test inputs, along with pathological thread schedules.
Figure 4 captures our overall framework. Broadly, our frame-work contains the following components.
• Static analysis is used to compute a summary of each GPU thread. Specifically, the static analyzer computes the cache hit/miss classification of memory references, the information about cache reuse and the information about cache conflict. This will be discussed in Section 4.1.
• Test generation component (as shown by “Dynamic test
genera-tion” in Figure 4) uses thread-level summaries computed by the static analyzer and identifies appropriate program paths ( Pro-gram path explorer) and thread schedules (Schedule explorer) to expose potential memory-performance bottlenecks. This will be discussed in Section 4.2.2.
• Execution monitoris used within a cycle-accurate simulator to detect potential memory-performance bottlenecks. This will be discussed in Section 4.3.
The test generation process continues in an iterative fashion until the time budget for testing expires or all execution scenarios with possible DRAM accesses have been explored.
4.
Detailed Methodology
In this Section, we shall provide a more detailed description of our framework. For the sake of simplicity in the following discussion,
we shall generically use the termmemory blockfor both instruction memory blocks and data memory blocks.
4.1 Static analysis
In this section, we describe the static analyzer in our framework. It works on the CFG of a GPU kernel. This CFG is extracted from the kernel binary (in our implementation, we use CUDA binaries) and investigates different threadsin isolation. However, since all the threads share the same code, the static analysis can be performed si-multaneously for all the threads. Nevertheless, we maintain thread-level information to distinguish the data and control flow in differ-ent threads. Since all the threads are analyzed in an exactly same fashion, in the following, we describe the static analyzer only for a single thread.
4.1.1 Cache hit/miss classification
We use abstract interpretation (AI) based cache analyses [12, 25] to classify each memory reference asall-hit(AH),all-miss(AM), per-sistence(PS) or unclassified (NC). A memory reference is classi-fied as AH (AM), if the respective memory block is always (never) in the cache when accessed. A memory reference is categorized as PS, if the accessed memory block cannot be evicted from the cache. A PS-categorized memory reference can further be decom-posed into NC (for its first occurrence) and AH (for all next oc-currences). We already perform this decomposition in our frame-work by virtually unrolling each loop only once. Therefore, in the following discussion, we shall only talk about AH, AM and NC categorized memory references. Cache hit/miss classifications are used primarily to locate a potential global-memory access. Note that AM or NC categorized memory references exhibit potential global-memory accesses by a thread. For further details on cache analyses, readers are referred to [12, 25].
4.1.2 Cache reuse information
We compute the reuse information of caches to create appropriate inter-thread cache conflicts during the test generation. The reuse statistics of caches can be computed via abackward flow analysis on the CFG. During cache hit/miss classification, we compute abstract cache states at each location. Such an abstract cache state captures the set of memory blocks whichmight be cached(defined asmay-cache-statein [25]). We use abstract interpretation (AI) to compute the information about cache reuse. The abstract domainD
is all possible subsets of the set of accessed memory blocksM.
The transfer function τb of this AI-based analysis traverses each instruction through a backward control flow and updates the abstract stateD ∈D. Let us assume thatCp ∈ Ddenotes the set
of memory blocks which might be cached immediately before the program locationp. This was computed during the cache hit/miss classification. We can now formally defineτbas follows:
τb: 2M×P→2M
τb(D, p) = (D ∪Mgen)\(Mp\Mgen) (1) wherePdenotes the set of all program points,Mpcaptures the set of memory blocks accessed (by the thread under analysis) atp∈P
andMgen ={m|m ∈Mp∧m∈ Cp}(i.e.the set of possibly reused memory blocks from the cache atp).
The abstract join operation is employed at a control flow merge point. Specifically, the join operationJb is used to compute the abstract state at the exit of a basic block by combining all the abstract states at the entry of its successors. For this analysis,Jb is primarily a set union operation that merges all the abstract states. We aim to generate cache conflicts that might evict the set of reused memory blocks during the test generation.
We start our analysis with an empty set. Since CFGs usually contain loops, a fixed-point computation is applied to stabilize the
abstract state at each program location. For instance, in Figure 3(a), the analysis reaches a fixed-point on{m1, m2, m3}at the exit of basic blockB5. This is because, memory blockm4is evicted along all paths reaching the basic blockB5.
4.1.3 Cache conflict information
This component of the static analyzer is used to estimate the num-ber of cache conflicts generated by a thread between two consecu-tive blocking points. A thread might be blocked for several reasons, such as due to accessing DRAM or waiting at a synchronization barrier. From a given program location, we compute an estimate on the set of memory blocks that could be accessed by a thread till it goes into the waiting state. This information can also be computed via an AI-based backward flow analysis. The abstract domain of the analysis captures all possible subsets of the set of accessed mem-ory blocksM. The transfer functionτb0collects the set of accessed memory blocks in setMvia a backward control flow andτ0
bcan formally be defined as follows.
τb0: 2M×P→2M
τb0(M, p) =
(
M ∪Mp, ifp /∈Waiting;
φ, otherwise. (2)
wherePdenotes the set of all program points,Mpcaptures the set of memory blocks accessed by the thread at program pointpand
Waiting ∈ Pcaptures the set of potential locations in the thread
where it might go into the waiting state. In our analysis, we consider such waiting locations to be either global-memory references (i.e. AM or NC classified memory accesses) or synchronization barriers. The join operation simply performs a set union at control flow merge points. We start the analysis with the initial stateφand obtain a fixed-point solution at each program location by employing the transfer (i.e.τb0) and join operation. For instance, in Figure 3(a), the analysis computes a fixed point on{m3}at the exit of basic block
B5. This is due to the reason that{m3}is accessed atB7 and all paths starting fromB7has to access a potential global-memory reference (i.e.accessing NC-classifiedm1atB1) next.
4.2 Test generation
Algorithm 1 shows an outline of our test generation and test execu-tion process (cf.components “Dynamic test generation” and “Exe-cution monitor” in Figure 4). The basic idea behind this process is as follows. We first generate a random input and execute the GPU kernel under test. Once the kernel finishes execution, we construct a symbolic stateφt for each threadtto capture its execution. In particular, such a symbolic stateφtcaptures the set of all inputs for which threadtwill follow the respective execution path (com-monly known in literature aspath condition[15]). Note that the unit of scheduling in CUDA is awarp. Therefore, we compute a warp-level symbolic stateΨw by merging the symbolic states of different threads that are contained in the respective warp (line 16 in Algorithm 1). This is accomplished viaMergeprocedure (refer to Section 4.2.1 for details). We manipulate the warp-level symbolic states from previous executions to produce unexplored symbolic states in a listunex[w]. More importantly, we prioritize the un-explored symbolic states via procedureInsertWithPriority
(line 24 in Algorithm 1) using the information computed during static analysis (refer to Section 4.2.2 for details). Lines 9-27 in Al-gorithm 1 show the methodology to generate unexplored symbolic states and subsequently, prioritizing them after a specific execution of the GPU kernel. To execute the kernel with a new test input, we use the prioritized list of unexplored symbolic states and generate a concrete input from a symbolic state which is more likely to ex-pose memory-performance problem (lines 31-41 in Algorithm 1). Moreover, when the kernel executes with this test input, warps are
Algorithm 1 Performance-stressing test generation for a GPU-kernel
1: Input:
2: P:The GPU-kernel under test
3: Chmc:Cache hit/miss classification (cf.Section 4.1.1)
4: Reuse:Cache reuse information (cf.Section 4.1.2)
5: Conflict:Cache conflict information (cf.Section 4.1.3)
6: Output:
7: T: A set of test cases. Each test case is of the formhΩ,SH, ξi, where Ω is the symbolic input-condition, SH captures the warp-schedule andξis the set of inter-warp interferences.
8: Execute the kernelPon a random inputτ
9: Let symbolic stateφtis the path condition ([15]) for threadt 10: /* Compute warp-level symbolic state */
11: LetWis the set of all warps
12: foreach warpw∈ Wdo
13: unex[w] =all[w] =empty
14: Let{t1, t2, . . . , tn}is the set of threads inw
15: /* Merge thread-level symbolic states */
16: Ψw=Merge(φt1, φt2, . . . , φtn) 17: unex[w]S= {Ψw};all[w]S={Ψw} 18: LetΨw=ψ1∧ψ2∧. . .∧ψk 19: fori∈[1, k]do 20: Ψi w=ψ1∧ψ2∧. . .∧ψi−1∧ ¬ψi
21: /* prioritize symbolic states for effective testing */ 22: ifΨiwis satisfiableandΨiw∈/all[w]then
23: all[w]S= {Ψi w} 24: InsertWithPriority(unex[w],Ψiw) 25: end if 26: end for 27: end for
28: /* iterative test generation */ 29: repeat
30: /* Construct feasible symbolic state for testing */ 31: Ω =true
32: foreach warpw∈ Ws.t.unex[w]6=emptydo
33: Letunex[w]:={Ψ1
w,Ψ2w, . . . ,Ψnw−1,Ψnw}
34: LetΨi
whas priority overΨiw+1for alli∈[1, n−1] 35: FindΨkw∈unex[w]s.t.Ω∧Ψkwis satisfiable and 36: for allj∈[1, k),Ω∧Ψj wis unsatisfiable 37: if(Ψk wexists)then 38: Ω = Ω∧Ψk w;unex[w] =unex[w]\ {Ψkw} 39: end if 40: end for
41: Letτbe a concrete input satisfyingΩ
42: /* ExecutePby pathologically scheduling warps 43: and update unexplored symbolic states */
44: ExecuteAndMonitor(P, τ,Ω,T)
45: untilfor allw∈ W,unex[w]= empty ortimeout
46: ReportT for further investigation
scheduledon-the-flyin a fashion which is likely to lead to sub-stantial DRAM congestion or on-chip cache conflicts (refer to Sec-tion 4.2.2 for details). Each such execuSec-tion of the GPU kernel is also monitored to record DRAM congestion overhead and on-chip cache conflicts (cf.line 44 in Algorithm 1). This is accomplished via procedureExecuteAndMonitor(refer to Section 4.3 for de-tails). The recorded report is produced for the developer for further investigation. Once the kernel finishes execution, we construct un-explored symbolic states in a similar fashion by manipulating the symbolic state of the last execution. The process of test generation and test execution of a GPU kernel continues as long as the time budget for testing permits or all unexplored symbolic states are
vis-Algorithm 2Computing warp-level symbolic state
1: procedureMERGE(φ1, φ2, . . . , φn)
2: Letφi=ψi,1∧ψi,2∧. . .∧ψi,ρ(i)
3: LetBis the set of all control branches
4: k= 1 5: repeat
6: ∀b∈ B. α[b, k] =true
7: forj←1, ndo
8: ifk≤ρ(j)then
9: Letbjis the control branch respective toψj,k 10: α[bj, k]V=ψj,k
11: end if
12: end for
13: k=k+ 1
14: until∀x∈[1, n]. k > ρ(x) 15: /* set warp-level symbolic state */ 16: Ψw=Vi,jα[i, j]
17: end procedure
ited. In the following, we shall describe some critical components of our framework.
4.2.1 Merging symbolic states
In Algorithm 1, procedureMergeis used (cf.line 16 in Algorithm 1) to compute the symbolic state of a warp from the symbolic states of its constituent threads. By computing a symbolic state for the entire warp, we can substantially reduce the number of symbolic states to explore. Algorithm 2 outlines the procedure
Merge. The general intuition is to align the control branches in
the traces of different threads. If a branch can be aligned for a set of threads, the respective branch conditions are merged and treated as a single condition during the generation of test inputs. For instance, consider the set of threads in Figures 3(a)-(c) constitute a warp. If the threads execute fora[T1. . . T3] =b[T1. . . T3] = 0, we compute a warp-level symbolic stateΨ ≡ Ψ1∧Ψ2, where Ψ1 ≡a[T1]≤0∧a[T2]≤0∧a[T3]≤0andΨ2 ≡b[T1]≤ 2∧b[T2] ≤ 2∧b[T3] ≤ 2. As a result, we manipulateΨby negating eitherΨ1orΨ2to compute unexplored symbolic states.
4.2.2 Prioritizing symbolic states and warps
In Algorithm 1, the procedureInsertWithPriorityis used to create an ordered list of symbolic states (cf. the component “Program path explorer” in Figure 4). This ordering is guided by the static analyzer and it aims to expose as many performance issues as possible in a given time budget for testing.
To formalize the concept, let us assume two unexplored sym-bolic statesΨ≡ψ1∧ψ2∧. . .∧ψmandΨ0≡ψ01∧ψ20∧. . .∧ψ0n for warpw. The set of threads in warpwis captured byTw. We writeΨ 4d Ψ0 (Ψ 4i Ψ0) if Ψ0 has priority overΨ in terms of generating global-memory interferencesdirectly(indirectly). Fi-nally assume thatbΨ(bΨ0) is the control dependence edge in the
CDG (cf.Figure 3(d)) capturing the symbolic conditionψm(ψ0n). To expose DRAM-interferences directly, we choose a symbolic state which is likely to lead to the maximum number of unexplored DRAM requests. Therefore, we prioritizeΨandΨ0as follows.
Ψ4dΨ0⇔ X t∈Tw |Rmem(bΨ, t)| ≤ X t∈Tw |Rmem(bΨ0, t)| (3) Rmem(e, t) ={m∈ Rt|e m∧Chmc(m, t)6=AH} whereRt is the set of all memory references by thread t and
Chmc(m, t)is the AH/AM/NC categorization of min thread t
(cf.Section 4.1.1). The notation e mcaptures that memory referencemis reachable from CDG edgee.
To systematically generate cache conflicts, we choose a sym-bolic state for warpwthat may potentially lead to the maximum and unexplored cache conflicts to other warps. In particular, we prioritizeΨandΨ0as follows.
Ψ4iΨ0⇔ |Cmem(bΨ, w)| ≤ |Cmem(bΨ0, w)| (4)
Cmem(e, w) ={m∈ Rw|e m∧Intf(m,W \ {w})} where W is the set of all warps, Rw is the set of all memory references by warpwandIntf(m, W)captures whethermmay conflict with any memory block accessed in the set of warpsW. Once the symbolic states in individual warps are prioritized, we walk through the prioritized listunex[w]for each warpw. As an outcome, we create a feasible symbolic expressionΩand generate a concrete inputτsatisfyingΩto execute the entire GPGPU kernel. To systematically select schedules, we prioritize warps during the execution (cf.the component “Schedule explorer” in Figure 4). In particular, when a warp is blocked during the execution (e.g.due to DRAM transaction or barrier synchronization), we issue aready warp that is likely to lead to memory-performance issue. Such a priority function is guided both by the information computed during static analysis and the information available at runtime.
Let us consider two warps wx and wy which are ready to execute from program location px and py, respectively. We say
px 4d py (px 4i py), if warpwy is given priority over warp
wx to generate DRAM interferencesdirectly (indirectly). If we want to generate DRAM congestion, we attempt to create as many DRAM bank conflicts as possible. We assume thatB1, B2, . . . , Bs are the different DRAM banks of global-memory. Besides, we use the notationReq(Bi), whichdynamicallycaptures the set of outstanding requests in memory bankBi. To create global-memory bank conflicts, we try to maximize the potential DRAM accesses to thebusybanks (i.e.DRAM banks with outstanding requests). In particular, if a warpw executes from program locationp, we compute the potential conflicts GBi(p, w) to memory bank Bi
beforewis blocked. Assumingµ(m)captures the global-memory bank wheremis mapped,GBi(p, w)is formally defined as follows:
GBi(p, w) ={ m ∈/Req(Bi)|µ(m) =Bi∧ |Req(Bi)| 6= 0
∧ ∃t∈ Tw. m∈Conflict(p, t)
∧ Chmc(m, t)6=AH} (5)
where Conflict(p, t) denotes the cache-conflict-analysis fixed-point atpfor threadt(cf.Section 4.1.3). The priority function4d attempts to maximize the bank conflicts by issuing global-memory requests to thebusybanks and it is formally defined as follows.
px4dpy⇔ s X i=1 |GBi(px, wx)| ≤ s X i=1 |GBi(py, wy)| (6)
Finally, let us consider prioritizing warps to create cache pol-lution. We assume thatS1,S2, . . . ,Sqare the different cache sets andC(Si)dynamicallycaptures the content of cache setSi. We use the notationm7→ Si, if memory blockmis mapped to cache setSi. If a warpwexecutes from program locationp, we compute the potential cache conflictHSi(p, w)to cache setSibeforewis
blocked.HSi(p, w)is formally defined as follows.
HSi(p, w) ={ m ∈ C/ (Si)|Reuse(Si, w)∩ C(Si)6=φ
∧ ∃t∈ Tw. m∈Conflict(p, t)
∧ m7→ Si} (7)
Reuse(Si, w)captures the potentially reused cache content from setSiby warps other thanw. Note thatReuse(Si, w)can be com-puted from the cache reuse information (cf.Section 4.1.2). Intu-itively, we attempt to create cache pollution by replacing the reused cache content of waiting warps as much as possible. Therefore, we
can now formally define the priority function4ias follows.
px4ipy⇔ q X i=1 |HSi(px, wx)| ≤ q X i=1 |HSi(py, wy)| (8) In our evaluation, we observed that the partial order4iis more effective in exposing memory-performance problems compared to the partial order4d. This is primarily due to the small cache sizes configured for embedded GPUs. Therefore, in our framework, the partial order4iis given priority over the partial order4d. 4.3 Monitoring the execution of a GPU kernel
In Algorithm 1, procedureExecuteAndMonitor(cf.line 44 in Algorithm 1) monitors the execution of a GPU kernel, records the overhead due to DRAM congestion or on-chip cache conflicts and computes unexplored symbolic states for subsequent executions. In Figure 4, this component is shown via the label “Execution mon-itor”. It is important to note that for each warpw, the unexplored symbolic states are generated and prioritized in the listunex[w]
using the exactly same methodology as shown in lines 9-27 of Al-gorithm 1. Therefore, in the following, we shall only discuss the monitoring process to record overhead in a specific execution. If Rwcaptures the set of all dynamic memory references by warpw andTwdenotes the set of all threads contained inw, we compute the total overheadOwas follows.
Ow= X
m∈Rw
(
Tm−LAThit,if∀t∈ Tw.Chmc(m, t) =AH;
max(0, Tm−Tround),otherwise;
(9)
In Equation 9, Tm is the time taken to complete the memory request, Tround captures the total round-trip time to DRAM in the absence of DRAM congestion or DRAM bank conflicts and
LAThitis the cache hit latency. Two cases in Equation 9 capture the scenarios in Figure 2(b) and Figure 2(a), respectively.
Handling synchronization points and program exit In a GPGPU program, different threads within the same thread block may syn-chronize via barriers. Besides, we consider the exit location of the GPU kernel to be animplicit barrier. Since a thread block may con-tain many warps, a specific warp might be delayed by other warps at the synchronization barrier. Since we specifically aim to detect memory-performance issues, our computed overhead (i.e.Owfor warpw) requires adjustment at these synchronization barriers. Fig-ures 5(a)-(b) show two different scenarios when warpsw1andw2
suffer additional delay due to inter-warp interferences and synchro-nize at a barrier. Specifically, the adjustment depends on the timing behaviours of warps in the absence of inter-warp interferences.
To formalize, let us considern warps{w1, w2, . . . , wn}that need to synchronize at a barrier location. Besides, assume that warpwi takes time Twi to reach the barrier location and Owi
is the additional overhead (cf.Equation 9) suffered bywi before reaching the barrier location. Finally, consider two warpswmand
wm0satisfying the following constraints.
Twm≥ max
i=1...nTwi;Twm0 ≥ max
i=1...n(Twi− Owi) (10) Therefore,wm(wm0) is the final warp to reach the barrier location
in the presence (absence) of inter-warp interferences. The adjust-ment of the overhead can now be formally defined as follows.
Owi= Owm0+Twm−Twm0, if max j=1...n(Twj − Owj)> Twm− Owm; Owm, otherwise. (11)
The first case in Equation 11 captures the scenario in Figure 5(a), whereas the second case captures the scenario in Figure 5(b). Test suite property Upon the termination of Algorithm 1, we produce a set of test cases (the component “Test suite” in
Fig-Barrier w1 w2 Inter−warp overhead overhead Adjusted Inter−warp overhead Time Barrier w1 w2 Inter−warp overhead overhead Adjusted Time Inter−warp overhead (a) (b)
Figure 5. Adjusting overhead at a barrier whenw2is the final warp to execute the barrier and in the absence of inter-warp interferences (a)w1executes longer, (b)w2executes longer
ure 4) ranked by the magnitude of detected memory overhead (i.e. Ow in Equation 9). Each test case captures a potential memory-performance problem and it is a triplet of the formhΩ,SH, ξi. In a test case,Ωis a symbolic formula that captures the set of inputs that lead to a memory-performance problem,SHis a graph that captures the exact schedule during the respective execution andξ
is the set of memory interferences (i.e.DRAM congestion or on-chip cache conflicts) observed during the respective execution. A concrete inputθ can be obtained by solving the formulaΩ. The performance problem can be replicated by executing the program withθand strictly enforcing the scheduleSH.
Since we aim to uncover memory-performance bottlenecks, the coverage of our test suite is provided via the set of explored mem-ory references in each thread. However, we exclude memmem-ory ref-erences which are categorized AH during the static analysis and do not face anyinter-threadcache conflict. This is because, such memory references do not generate any DRAM transaction. Addi-tionally, our generated test suite satisfies the following property. PROPERTY4.1. Consider two test cases hΨw1 ∧Ψw2 ∧. . .∧
Ψwn,SH, ξiandhΨ0w1∧Ψw02∧. . .∧Ψ0wn,SH0, ξ0i ∈ T. For
anyi∈[1, n], we haveΨwi6= Ψ0wi.
Intuitively, Property 4.1 states that in each warp, any symbolic state is exploredat most onceduring the test generation process.
5.
Experimental evaluation
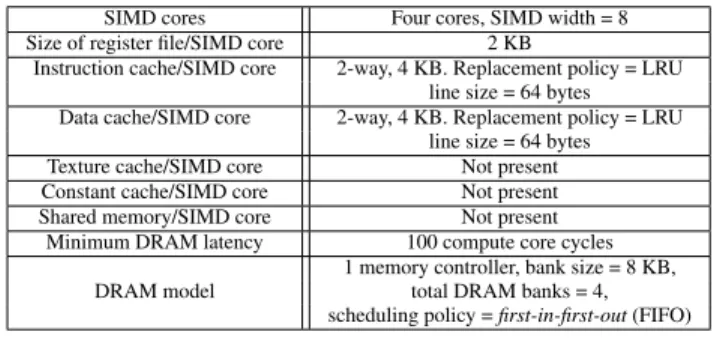
Experimental setup Our implementation is based on the GPGPU-Sim simulator [8] and the GKLEE symbolic virtual machine [22]. We use thenvcccompiler to compile GPU kernels into CUDA-compliant binaries. GPGPU-Sim is used to extract PTX-level2 con-trol flow graphs (CFG) from CUDA binaries. These CFGs are fed as inputs to our static analyzer. We execute each kernel us-ing GPGPU-Sim, while systematically generatus-ing warp schedules on-the-fly(cf. Section 4.2.2). To compute the symbolic state for each execution, we replay the respective traces using GKLEE. To generate concrete inputs from a symbolic formula, we use the STP constraint solver [5]. Our implementation iscompletely automated and it does not require any manual interventions. In our evaluation, we have used GPU kernels from CUDA SDK [2] (cf.Table 1). As our aim is to uncover memory-performance issues, we choose kernels which have substantial data accesses. Table 1 reports the salient features of all the evaluated CUDA kernels and the cover-age of potential DRAM access locations obtained by GUPT. Fi-nally, since embedded GPUs are primarily designed for low power consumption, they have small caches. Therefore, we configure the GPU platform (cf.Table 2) with 2-way, 4 KB instruction and data caches (cache sizes are similar to the configuration of the Vivante GC2000 embedded GPU [23]).
2Parallel Thread Execution (PTX) is a target-independent intermediate language used in CUDA programming environment
Program Lines Input Threads Coverage of code size / block
bitonic sort 145 1 KB 256 100% convolution 191 32 KB 128 100% column convolution row 188 32 KB 64 100% histogram 248 64 KB 64 100% 3840 bytes + matmult 151 3840 bytes 64 100% scan b 225 4 KB 1024 100% scan w 177 4 KB 1024 100% scan naive 158 4 KB 1024 100% transpose 144 16 KB 256 100% transpose naive 145 16 KB 256 100% scalar product 141 4 KB + 4 KB 256 100% nodes = 4096 BFS 218 edges = 28675 256 98% Fast-Walsh 234 8 KB 512 100% Clock 71 2 KB 256 100%
Table 1. Evaluated CUDA SDK kernels and obtained coverage SIMD cores Four cores, SIMD width = 8 Size of register file/SIMD core 2 KB
Instruction cache/SIMD core 2-way, 4 KB. Replacement policy = LRU line size = 64 bytes Data cache/SIMD core 2-way, 4 KB. Replacement policy = LRU
line size = 64 bytes Texture cache/SIMD core Not present Constant cache/SIMD core Not present Shared memory/SIMD core Not present
Minimum DRAM latency 100 compute core cycles 1 memory controller, bank size = 8 KB, DRAM model total DRAM banks = 4,
scheduling policy =first-in-first-out(FIFO)
Table 2. Micro-architectural configuration of the GPU platform Key result We demonstrate the key results from our test gen-eration framework via Figure 6. Figure 6 shows the number of memory-performance issues detected inbitonic sortwith re-spect to time. The kernelbitonic sorthas an exponential num-ber of input-dependent paths. As a result, it is potentially infeasible to test the application for all possible execution paths and schedul-ing decisions. To evaluate the efficacy of our test generation frame-work, we compare with two different strategies, namelypure ran-dom testingandsymbolic random testing. In pure random testing, we randomly generate inputs to execute the kernel. Moreover, when a warp is blocked, we randomly schedule a ready warp for exe-cution. Symbolic random testing is similar to our test generation framework, except thatwe do not use any guidance from our static analyzer. Therefore, we randomly choose an unexplored symbolic state and we randomly schedule ready warps for execution. But, as opposed to pure random testing, symbolic random testing guar-antees to execute different program paths for each generated test input. In Figure 6, we limit the maximum time budget for testing to 10 minutes. We make the following crucial observations from Figure 6. Since test inputs and schedules are generated randomly in pure random testing, the generated execution scenarios may not provide a good coverage of the potential performance problems. As a result, pure random testing reports relatively low number of performance issues. In symbolic random testing, program inputs are generated systematically by manipulating the symbolic states (cf.Algorithm 1). However, in the presence of a huge number of symbolic states and scheduling decisions, it is important to gener-ate relevant execution scenarios as early as possible. We accom-plish this by guiding the test generation via a static analyzer. As observed from Figure 6, we detect memory-performance problems early during the test generation, compared to symbolic random ing. When run long enough, the efficacy of symbolic random test-ing is slowly growtest-ing.
Test suite property Upon the termination of Algorithm 1, we produce a test suite (the component “Test suite” in Figure 4). Each test case in this test suite captures a potential memory-performance problem and it is a triplet of the formhΩ,SH, ξi. In a test case, Ωis a symbolic formula that captures the set of inputs that lead to a memory-performance problem,SHis a graph that captures the exact schedule during the respective execution andξis the set of memory interferences (i.e.DRAM congestion or on-chip cache conflicts) observed during the respective execution. A concrete inputθcan be obtained by solving the formulaΩ. The performance problem can be replicated by running the program with test inputθ and driving the respective execution that conforms to the schedule
SH. Additionally, our test suite ranks the test cases in decreasing order of detected memory overhead (i.e.Owin Equation 11).
Since we aim to uncover memory-performance bottlenecks, the coverage of our test suite is provided via the set of explored mem-ory references in each thread. However, we exclude memmem-ory ref-erences which are categorized AH during the static analysis and do not face anyinter-threadcache conflict. This is because, such memory references do not generate any DRAM transaction. Addi-tionally, our generated test suite satisfies the following property. PROPERTY4.1.Consider two test cases hΨw1 ∧ Ψw2 ∧. . . ∧
Ψwn,SH, ξiandhΨ′w1∧Ψw′2∧. . .∧Ψ′wn,SH′, ξ′i ∈ T. For
anyi∈[1, n], we haveΨwi 6= Ψ′wi.
Intuitively, Property 4.1 states that in each warp, any symbolic state is exploredat most onceduring the test generation process.
5.
Experimental evaluation
Experimental setup Our implementation is based on the GPGPU-Sim simulator [8] and the GKLEE symbolic virtual machine [22]. We use thenvcccompiler to compile GPU kernels into CUDA-compliant binaries. GPGPU-Sim is used to extract PTX-level3 con-trol flow graphs (CFG) from CUDA binaries. These CFGs are fed as inputs to our static analyzer. We execute each kernel us-ing GPGPU-Sim, while systematically generatus-ing warp schedules
on-the-fly (cf.Section 4.2.2). To compute the symbolic state for each execution, we replay the respective traces using GKLEE. To generate concrete inputs from a symbolic formula, we use the STP constraint solver [5]. Our implementation iscompletely automated
and it does not require any manual interventions. In our evaluation, we have used GPU kernels from CUDA SDK [2] (cf.Figure 7). As our aim is to uncover memory-performance issues, we choose kernels which have substantial data accesses. Finally, since em-bedded GPUs are primarily designed for low power consumption, they have small caches. Therefore, we configure the GPU platform with 2-way, 4 KB instruction and data caches (cache sizes are sim-ilar to the configuration of the Vivante GC2000 embedded GPU [23]). Cache replacement policy is set toleast recently used(LRU). Finally, we set the minimum DRAM latency to 100 cycles4. Key result We demonstrate the key results from our test gen-eration framework via Figure 6. Figure 6 shows the number of memory-performance issues detected inbitonic sortwith re-spect to time. The kernelbitonic sorthas an exponential num-ber of input-dependent paths. As a result, it is potentially infeasible to test the application for all possible execution paths and schedul-ing decisions. To evaluate the efficacy of our test generation frame-work, we compare with two different strategies, namelypure ran-dom testingandsymbolic random testing. Inpure random testing, 3Parallel Thread Execution (PTX) is a target-independent intermediate
language used in CUDA programming environment
4A comprehensive summary of the micro-architectural configuration and
characteristics of the evaluated CUDA kernels appear in the Appendix
0 2 4 6 8 10 12 14 16 0 100 200 300 400 500 600
Number of memory performance issues
Time (in seconds)
Pure random testing Symbolic random testing GUPT (our approach)
Figure 6. No. of detected memory-performance issuesw.r.t.time
0 10 20 30 40 50 60
bitonic_sort convolution_columnconvolution_rowhistogram64matmult scan_b scan_w scan_naive transpose transpose_naivescalar_productBFS Fast-Walsh Clock Geo. mean
Average memory overhead (%)
Pure random testing Symbolic random testing GUPT (our approach)
Figure 7. Evaluation with CUDA SDK kernels
werandomlygenerate inputs to execute the kernel. Moreover, when awarpis blocked, we randomlyschedule a ready warp for exe-cution.Symbolic random testingis similar to our test generation framework, except thatwe do not use any guidance from our static analyzer. Therefore, werandomlychoose an unexplored symbolic state and werandomlyschedule ready warps for execution. But, as opposed topure random testing,symbolic random testing guaran-tees to execute different program paths for each generated test in-put. In Figure 6, we limit the maximum time budget for testing to 10 minutes. We make the following crucial observations from Figure 6.Pure random testingis not suitable for detecting the memory-performance issues. This is expected, as the inputs are generated randomly, the generated inputs may not provide a good coverage of the program paths. Besides, randomly scheduling warps mayfail
to uncover scenarios that lead to memory-performance issues. As a result,pure random testingreports relatively low number of perfor-mance issues. Insymbolic random testing, program inputs are gen-erated systematically by manipulating the symbolic states (similar to [15]). However, in the presence of a huge number of symbolic states and scheduling decisions, it is important to generate relevant test inputs as early as possible. We accomplish this by guiding the test generation via a static analyzer. As observed from Figure 6, we detect memory-performance problems early during the test genera-tion, compared tosymbolic random testing. When run long enough, the efficacy ofsymbolic random testingis slowly growing. Evaluation Figure 7 outlines the results of our experiments. For our experiments, we limit the time budget for testing as ten min-utes. Recall that our framework records an overheadO(cf. Equa-tion 11) to capture the amount of DRAM congesEqua-tion or on-chip cache conflicts in a particular execution. To evaluate the magni-tude of this overhead, we use the ratio OE, whereE is the total execution time. However, note that we execute a kernel for differ-ent test inputs. Therefore, the final overhead is computed by tak-ing ageometric meanof the ratioOE over all tested inputs that de-tectnonzerooverhead. This final overhead is captured via the label “Average memory overhead” in Figure 7. We also use the average
Figure 6. No. of detected memory-performance issuesw.r.t.time
0 10 20 30 40 50 60
bitonic_sort convolution_columnconvolution_rowhistogram64matmult scan_b scan_w scan_naive transpose transpose_naivescalar_productBFS Fast-Walsh Clock Geo. Mean
Average memory overhead (%)
Pure random testing Symbolic random testing GUPT (Our approach)
Figure 7. Evaluation with CUDA SDK kernels
Evaluation Figure 7 outlines the results of our experiments. For our experiments, we limit the time budget for testing as ten minutes. Recall that our framework records an overheadO(cf.Equation 9) to capture the amount of DRAM congestion or on-chip cache con-flicts in a particular execution. GivenO>0, we capture the magni-tude of this overhead using the ratioOE, whereEis the total execu-tion time and report the geometric mean of this ratio (cf.“Average memory overhead” in Figure 7) over different executions. We also use the average memory overhead to compare different test gener-ation methodologies. This is because a high ratio indicates a sub-stantial amount of DRAM congestion or on-chip cache conflicts and such memory-performance issues should be fixed in order to efficiently execute a kernel. As shown in Figure 7, GUPT signifi-cantly outperforms pure random testing. This is expected, as pure random testing does not have any knowledge about program paths and micro-architectural states (e.g.caches). Symbolic random test-ing overall performs better than pure random testtest-ing, except for GPGPU programs that have very fewinput-dependentpaths (e.g.
matmult). However, since symbolic random testing does not
uti-lize any knowledge about micro-architectural states (as computed by our static analyzer), the detected overhead is smaller compared to the same detected by GUPT. Besides, we observed that most of the performance problems are detected early during our test gener-ation (e.g.in Figure 6). Therefore, we believe that the combination of static analysis and symbolic testing provides a promising direc-tion for performance testing GPU kernels.
Usage of the framework to compare different implementations We can use our test generation framework to compare different implementations of the same algorithm. For instance, we eval-uate different implementations of the parallel prefix sum algo-rithm (scan naive, scan w and scan b in Table 1) from CUDA SDK. scan naive is algorithmically inefficient, using
O(n·logn) add operations, whereas the other two kernels (i.e.
scan w andscan b) use only O(n) add operations. However,
by systematically generating execution scenarios, we observed that bothscan wand scan bmay executelongercompared to
scan naive for certain scenarios. From the generated test
re-Execution cycle
Program Original Refactored Refactoring method
Fast-Walsh 795007 494474 cache locking
transpose naive 3810 3251 changing cache layout
scan w 16457 15175 changing cache layout
matmult 25652 10686 changing cache layout
+ cache locking
BFS 7827 7204 changing DRAM layout
Table 3. Refactoring GPGPU programs based on test results port, we found that bothscan bandscan wface around 20% more memory-overhead compared toscan naiveand this over-head affects the overall execution time. Therefore, we conclude that an algorithmically more efficient code isinsufficientto ac-complish better performance in complex GPU architecture. This is primarily due to the reason that such corner-scenarios are hid-den via the programming layer and therefore, such scenarios are potentially impossible for the developer to detect manually. These performance problems can be highlighted to the developer via our proposed methodology.
Usage of the framework to optimize GPGPU programs Finally, we show the usage of our framework to generate efficient GPGPU code. Table 3 summarizes our evaluation.
The kernelFast-Walshoperates on input data fromshared memory. As embedded GPUs are targeted for power-constrained mobile devices, the availability of an on-chip shared memory is of-ten restricted or such an on-chip memory is unavailable altogether in embedded GPUs [1, 6]. As a result, our framework identified a number of scenarios generating substantial DRAM traffic and it highlighted the accesses to the input data facing inter-warp cache conflicts. To reduce these cache conflicts, welockedthe portion of input data that can fit into the L1 data cache (4 KB). This leads all other data accesses tocache misses. However, since the input data was reused substantially compared to any other variable, we observed around 30% reduction in overall execution time.
We studied the naive implementation of matrix-transpose (i.e.
transpose naive) and the kernel scan w to improve their
memory-performance. For these kernels, our framework generates execution scenarios that highlight inter-warp cache conflicts be-tween two variables (idata,odatafortranspose naiveand
ai,bi forscan w). To reduce such cache conflicts, we
manu-ally change the layout ofidataandodata(aiandbi, respec-tively) so that they map to contiguous locations in the data cache. These changes improve the overall execution time by 14.6% (7.8%)
fortranspose naive(scan w). However, it is worthwhile to
point that the kerneltranspose naivealso suffers from unco-alescedmemory accesses, which we ignore in our framework.
Inmatmult, we observed the efficacy of both cache locking
andlayoutchanging. Our framework highlighted inter-warp cache conflicts between matrix blocksAsandBs. We changed the mem-ory layout ofAsandBsto map them into contiguous locations in the L1 data cache. This modification did marginal improvements to the execution time, as our framework highlighted execution sce-narios whereAsandBsconflict with other data variables in the kernel. To resolve this, we locked the contents ofAsandBs be-fore they are reused and unlocked them at the exit of each GPU thread. These changes reduce the overall execution time by 58.3%. In our experiments with theBFSkernel, our framework high-lighted a substantial DRAM bank conflicts between two variables
g graph nodesandg cost. We change the DRAM addressing
layout of these two variables to avoid DRAM bank conflicts. We obtained an improvement of around 8% via this modification.
In summary, preceding examples motivate that our framework can be used by a developer to improve the overall performance of a GPGPU program, manually or automatically via a compiler.
6.
Related work
To understand the performance behaviour of a program, a signif-icant research has been performed onprogram profilingover the last few decades [9, 13, 20, 21, 26]. Such techniques require in-puts to run a program. Additionally, the works in [13, 26] extend traditional profiling techniques to compute aperformance pattern over different inputs via empirical models. Our work complements program profiling by systematically finding performance-stressing test inputs. Besides, our work does not suffer from approximations incurred in empirical models and we also provide a coverage of memory-access locations to qualitatively evaluate our test suite. The performance characteristics of mainstream GPUs have recently been studied via analytical models [7, 16]. Our goal is orthogonal in the sense that we automatically generate test cases to uncover poor memory-performance. Therefore, our work has a significant testing flavour compared to the approaches proposed in [7, 16]. Be-sides, our framework does not rely on analytical models and detect memory-performance issues by monitoring program executions.
Existing works onconcolic testinghave mostly concentrated on sequential applications to detect functionality bugs [11, 15] and more recently, to detect poor cache performance [10]. Effective testing of parallel software has also emerged to be a critical prob-lem. For parallel applications, an additional challenge is to system-atically detect thread scheduling patterns that may lead to software bugs [14, 24]. The choice of such scheduling patterns has primarily focused on functionality bugs. In contrast, we aim to detect per-formance problems. Finally, the work in [22] has investigated the detection of functionality bugs and a few performance bugs (e.g. shared memory bank conflictsanduncoalesced memory accesses) for GPGPU applications. All such bugs can be detected by examin-ing a specific schedule, as calledcanonical schedulein [22]. Since different thread scheduling patterns may generate different mem-ory traffic, memmem-ory performance problems might not be exposed via the canonical schedule. To detect such performance problems, it is critical to select appropriate thread schedule and test inputs. We accomplish this by a test generation strategy which is guided via static analysis. Besides, we only report memory-performance issues that affect the overallexecution time.
In summary, our work extends the formal foundation of soft-ware testing via a test generation framework that systematically generates test inputs and thread schedules to detect memory-performance issues in embedded GPGPU applications, and in gen-eral, for embedded parallel applications.
7.
Conclusion
In this paper, we have proposed GUPT, a fully automated software-testing framework to uncover memory-performance issues in em-bedded GPUs. We leverage on dynamic test generation and sys-tematically guide the test generation process via a static analyzer. Our experiments with several GPGPU programs suggest that we can uncover a number of memory-performance issues early during the test generation. We show the usage of our framework in com-paring different implementations of the same functionality and in improving the performance of applications for embedded GPUs.
Since our approach is based on dynamic test generation, we do not generatefalse alarms, but we might miss some memory-performance issues. Besides, our test generation primarily focuses on exposing DRAM and cache interferences and ignores other performance problems due to warp interferences, such as long waiting-time at synchronization barriers.
In the future, we plan to extend our framework to automati-callylocalize the root cause (i.e.performance debugging) of per-formance issues. Subsequently, we plan to automatically suggest refactoring techniques to resolve such performance issues.
References
[1] ARM mali T600 series GPU OpenCL. http://infocenter. arm.com/help/topic/com.arm.doc.dui0538e/ DUI0538E_mali_t600_opencl_dg.pdf.
[2] CUDA SDK. https://developer.nvidia.com/ cuda-downloads.
[3] CUDA toolkit documentation. http://docs.nvidia.com/ cuda/cuda-c-programming-guide/index.html. [4] LLVM compiler infrastructure.http://llvm.org/.
[5] STP constraint solver. https://sites.google.com/site/ stpfastprover/.
[6] Vivante graphics core. http://www.vivantecorp.com/ index.php/en/technology/gpgpu.html.
[7] S. S. Baghsorkhi, M. Delahaye, S. J. Patel, W. D. Gropp, and W-m W. Hwu. An adaptive performance modeling tool for GPU architectures. InPPoPP, 2010.
[8] A. Bakhoda, G. L. Yuan, W. W. Fung, H. Wong, and T. M. Aamodt. Analyzing CUDA workloads using a detailed GPU simulator. In ISPASS, 2009.
[9] T. Ball and J. R. Larus. Efficient path profiling. InMICRO, 1996. [10] A. Banerjee, S. Chattopadhyay, and A. Roychoudhury. Static analysis
driven cache performance testing. InRTSS, 2013.
[11] C. Cadar, D. Dunbar, and D. R. Engler. KLEE: Unassisted and au-tomatic generation of high-coverage tests for complex systems pro-grams. InOSDI, 2008.
[12] S. Chattopadhyay and A. Roychoudhury. Unified cache modeling for WCET analysis and layout optimizations. InRTSS, 2009.
[13] E. Coppa, C. Demetrescu, and I. Finocchi. Input-sensitive profiling. InPLDI, 2012.
[14] D. Deng, W. Zhang, and S. Lu. Efficient concurrency-bug detection across inputs. InOOPSLA, 2013.
[15] P. Godefroid, N. Klarlund, and K. Sen. DART: directed automated random testing. InPLDI, 2005.
[16] S. Hong and H. Kim. An analytical model for a GPU architecture with memory-level and thread-level parallelism awareness. InISCA, 2009. [17] M. K. Jeong, M. Erez, C. Sudanthi, and N. Paver. A Qos-aware mem-ory controller for dynamically balancing GPU and CPU bandwidth use in an MPSoC. InDAC, 2012.
[18] A. Jog, O. Kayiran, N. C. Nachiappan, A. K. Mishra, M. T. Kandemir, O. Mutlu, R. Iyer, and C. R. Das. OWL: cooperative thread array aware scheduling techniques for improving GPGPU performance. In ASPLOS, 2013.
[19] H. Jooybar, W. WL. Fung, M. O’Connor, J. Devietti, and T. M. Aamodt. GPUDet: A deterministic GPU architecture. InASPLOS, 2013.
[20] S. Lagraa, A. Termier, and F. P´etrot. Scalability bottlenecks discovery in MPSoC platforms using data mining on simulation traces. InDATE, 2014.
[21] J. R. Larus. Whole program paths. InPLDI, 1999.
[22] G. Li, P. Li, G. Sawaya, G. Gopalakrishnan, I. Ghosh, and S. P. Rajan. GKLEE: Concolic verification and test generation for GPUs. InPPoPP, 2012.http://www.cs.utah.edu/formal_ verification/GKLEE/.
[23] A. Maghazeh, U. D. Bordoloi, P. Eles, and Z. Peng. General purpose computing on low-power embedded GPUs: Has it come of age? In SAMOS, 2013.
[24] S. Nagarakatte, S. Burckhardt, M. MK. Martin, and M. Musuvathi. Multicore acceleration of priority-based schedulers for concurrency bug detection. InPLDI, 2012.
[25] H. Theiling, C. Ferdinand, and R. Wilhelm. Fast and precise WCET prediction by separated cache and path analyses.Real-Time Systems, 18(2/3), 2000.
[26] D. Zaparanuks and M. Hauswirth. Algorithmic profiling. InPLDI, 2012.