Dynamic and post-dynamic recrystallization
under hot, cold and severe plastic deformation
conditions
Taku Sakai
a, Andrey Belyakov
b,⇑, Rustam Kaibyshev
b, Hiromi Miura
a,
John J. Jonas
ca
UEC Tokyo (The University of Electro-Communications), Chofu, Tokyo 182-8585, Japan b
Belgorod State University, Pobeda 85, Belgorod 308015, Russia c
McGill University, 3610 University Street, Montreal H3A 2B2, Canada
a r t i c l e
i n f o
Article history:
Received 8 February 2013
Received in revised form 14 September 2013 Accepted 23 September 2013
Available online 1 October 2013
a b s t r a c t
The evolution of the new microstructures produced by two types of dynamic recrystallization is reviewed, including those brought about by severe plastic deformation (SPD). The microstructural changes taking place under these conditions and the associated mechanical behaviors are described. During the conventional dis-continuous dynamic recrystallization (dDRX) that takes place at elevated temperatures, the new grains evolve by nucleation and growth in materials with low to medium stacking fault energies (SFE). On the other hand, new ultrafine grains can be produced in any material irrespective of the SFE by means of SPD at relatively
lowtemperatures. These result from the gradual transformation of the dislocation sub-boundaries produced at low strains into ultrafine grains with high angle boundaries at large strains. This process, termed in situ or continuous dynamic recrystallization (cDRX), is still not perfectly understood. This is because many SPD methods provide data concerning the microstructural changes that take place but little information regarding the flow stress
0079-6425/$ - see front matterÓ2013 Elsevier Ltd. All rights reserved.
http://dx.doi.org/10.1016/j.pmatsci.2013.09.002
Abbreviations: ARB, accumulative roll bonding; cDRX, continuous dynamic recrystallization; cSRX, continuous static recrystallization; EBSD, electron backscatter diffraction; ECAP, equal channel angular pressing; dDRX, discontinuous dynamic recrystallization; dSRX, discontinuous static recrystallization; DRV, dynamic recovery; DRX, dynamic recrystallization; DT, dynamic transformation; GBS, grain boundary sliding; HAB, high angle boundary; HPT, high pressure torsion; LAB, low angle boundary; MDF, multi-directional forging; mDRX, metadynamic recrystallization; MFS, mean flow stress; MSB, microshear band; OIM, orientation imaging microscopy; pDRX, post-dynamic recrystallization; RGS, relative grain size; SEM, scanning electron microscopy; SFE, stacking fault energy; SPD, severe plastic deformation; SRV, static recovery; SRX, static recrystallization; TEM, transmission electron microscopy; UFG, ultrafine grain.
⇑Corresponding author. Tel.: +7 4722 585457; fax: +7 4722 585417. E-mail address:[email protected](A. Belyakov).
Contents lists available atScienceDirect
Progress in Materials Science
behavior. By contrast, multi-directional forging (MDF) provides both types of data concurrently. Recent studies of the deformation behavior of metals and alloys under SPD conditions, carried out using MDF as well as other SPD methods, are synthesized and the links between the microstructural and mechanical observa-tions are examined carefully. Some models for grain formation under SPD conditions are discussed. Next, the post-dynamic recrystallization behavior, i.e. that of annealing after both dDRX and cDRX, is described. The differing annealing behaviors result from the differences in the natures of the deformed microstruc-tures. Finally, an integrated recrystallization model for these phe-nomena, i.e. dynamic and static recrystallization of both the continuous and discontinuous types, is presented and discussed.
Ó2013 Elsevier Ltd. All rights reserved.
Contents
1. Introduction . . . 132
2. Phenomenology of dynamic recrystallization. . . 132
2.1. Outline and terminology. . . 132
2.2. Flow stress behavior under hot working conditions . . . 135
2.3. Effect of structural factors and deformation conditions . . . 136
3. Conventional dynamic recrystallization . . . 137
3.1. Typical dynamic recrystallization flow curves . . . 137
3.2. The role of grain boundary bulging/sliding in nucleation of new dDRX grains. . . 138
3.3. Dislocation substructures in dDRX grains . . . 141
3.4. dDRX models . . . 142
3.5. Application to industry . . . 146
3.5.1. Rolling simulations . . . 146
3.5.2. Kinetics of dDRX and mDRX . . . 149
3.5.3. Effects of dDRX on ductility and texture. . . 151
3.6. Detection of the dDRX critical strain . . . 151
3.6.1. Dynamic transformation . . . 152
4. Continuous dynamic recrystallization and severe plastic deformation. . . 153
4.1. General characteristics of flow behavior and microstructures developed . . . 153
4.1.1. Historical development of severe plastic deformation . . . 153
4.1.2. Microstructural characteristics developed under SPD conditions . . . 155
4.2. Ultrafine grain microstructure development under SPD conditions . . . 156
4.2.1. Multi-directional forging . . . 156
4.2.2. UFG formation in low SFE materials . . . 157
4.2.3. UFG formation in high SFE materials . . . 162
4.3. Mechanisms of strain-induced UFG formation during SPD . . . 169
4.3.1. Models of strain-induced UFG formation . . . 169
4.3.2. A new model for the strain-induced formation of UFGs . . . 173
4.4. Effect of temperature and strain rate on the formation of strain-induced UFGs. . . 175
4.4.1. Low SFE materials. . . 175
4.4.2. High SFE materials . . . 176
4.4.3. Transient deformation behavior during changes in strain rate . . . 179
4.5. Mechanical properties of strain-induced UFG materials . . . 179
5. Post-dynamic recrystallization – Annealing behavior after dynamic recrystallization . . . 183
5.1. Post-cDRX . . . 183
5.2. Post-dDRX . . . 188
5.3. Concluding remarks . . . 193
6. Summary of dynamic and post-dynamic recrystallization . . . 194
6.1. Dynamic recrystallization . . . 194
6.3. Concluding remarks . . . 197
6.4. Topics for further investigation . . . 198
Acknowledgements . . . 198
References . . . 199
1. Introduction
The control of microstructure as well as of grain refinement through thermomechanical processing has been developed extensively since around 1970 and has been recognized as being both of technical importance as well as of scientific interest. The most developed method of grain refinement is based on plastic deformation at ambient temperatures followed by annealing at elevated temperatures
[1–5]. Another commonly employed approach involves the production of new grains directly during hot working by the process of dynamic recrystallization[3–5]. In both cases, the new microstructures result from the production of recrystallization nuclei, followed by the long-range migration of their boundaries. These processes occur in two steps and so are generally referred to as being discon-tinuous[4,5].
Over the past two decades, another method of new grain formation has been studied extensively; this takes place under conditions of severe plastic deformation. In this case, the ultrafine grained structures are developed at relatively low temperatures. This is one of the most promising topics in material science because it could lead to the production of submicron to nanometer sized crystallites in a wide variety of structural metals and alloys[4,5]. The mechanisms that produce grain refinement under these conditions, however, have not been as comprehensively studied as those of hot deforma-tion. One of the limitations associated with the large strain methods is that data concerning the micro-structural changes are readily obtained, whereas only limited data have been generated regarding the flow stress behavior under these conditions. This does not apply to multi-directional forging, which provides both types of data. The ultrafine grains formed in this way are considered to be produced in a single step and to develop uniformly over the entire volume. This mechanism of grain refinement is therefore referred to asin situor continuous dynamic recrystallization (cDRX)[4,5]and is only imperfectly understood.
The purpose of this review is to synthesize the recent work on all these types of grain refinement process. Some operate under hot and others under cold working conditions. The links between the microstructural and mechanical observations that have been gathered will be considered carefully. The high temperature processes are covered in Section3, which includes a discussion of the applica-tion of these phenomena to industry. The cold deformaapplica-tion processes are treated in Secapplica-tion4. Partic-ular attention is paid in this section to the data obtained by multi-directional forging because this procedure provides both microstructural and mechanical information regarding the grain refinement process. In Section5, the annealing behaviors of the as-deformed materials produced at both elevated and ambient temperatures are considered and interpreted in terms of the natures of the deformed microstructures. Finally, in Section6, an integrated recrystallization model of these phenomena is pre-sented, which involves both the dynamic and static processes and in which both continuous and dis-continuous reactions are covered.
2. Phenomenology of dynamic recrystallization 2.1. Outline and terminology
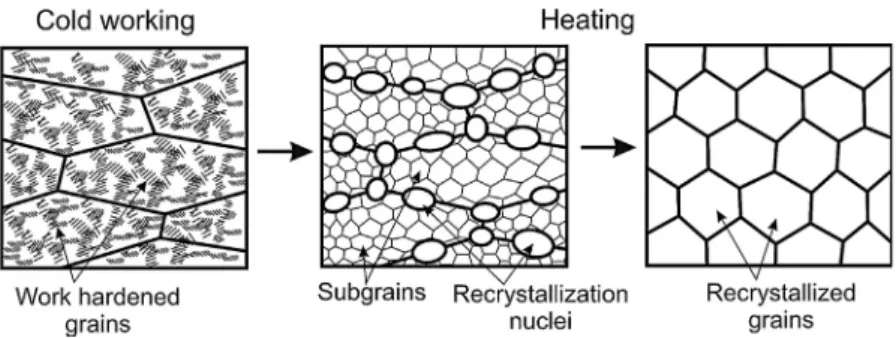
The term recrystallization is commonly used to describe the replacement of a deformation micro-structure by new grains during annealing; this is referred to as static recrystallization (SRX)[1–5]. One of the most studied and widely used recrystallization processes is primary recrystallization, during which new grains are produced by the nucleation and growth of new grains (seeFig. 1). Static recovery (SRV) takes place during the early stages of annealing and is responsible for the development of
recrystallization nuclei as fine dislocation-free crystallites. These grow by means of the long-range migration of the boundaries, which consume the strain hardened microstructure[1–6]. The driving pressure for the growth of such new grains is the stored energy associated with the dislocations and sub-boundaries produced during prior straining. In the early stages of SRX, the nuclei are outlined by low-angle boundaries, the misorientations of which gradually increase until they attain values typ-ical of high-angle boundaries (HABs)[4,5,7]. During annealing, the microstructure is characterized by a mixture of increasing amounts of recrystallized grains and decreasing amounts of strain hardened grains. Such a process is sometimes referred to as discontinuous static recrystallization (dSRX)[3–5]. In some strain hardened aluminum alloys containing dispersoids, on the other hand, the new microstructure develops homogeneously throughout the entire volume[8,9]. These new grains are the result of gradual subgrain growth accompanied by particle coarsening, as shown inFig. 2. Concur-rently the sub-boundary misorientationshincrease progressively until all the low-angle boundaries (LABs) are transformed into HABs. This process is characterized by a microstructure that remains homogeneous throughout and is therefore referred to asin situor continuous static recrystallization (cSRX)[4,5,8,9].
SRX takes place when strain hardened metals are heated above approximately half the melting point (in Kelvin), i.e. 0.5Tm; the temperature at which this can be accomplished in one hour is gener-ally referred to as the recrystallization temperatureTREX. The latter depends on material factors such as the type of lattice, concentration of alloying elements, and size distribution of second phases[1–5,10]. By contrast, conventional dynamic recrystallization (i.e. dDRX) takes placeduringstraining, as long as the temperature is above about 0.5Tm[11–16]. The new grains appear at the nucleation strain and then replace the initial microstructure completely at high strains. As in the case of SRX, there is a grad-ual transformation of the subgrains formed mainly in the vicinity of the grain boundaries into nuclei delineated by HABs. These dynamic processes, which involve a nucleation stage, are analogous to Fig. 1.Schematic representation of the discontinuous static recrystallization (dSRX) taking place during the annealing of strain hardened materials.
Fig. 2.Schematic representation of the continuous static recrystallization (cSRX) controlled by particle coarsening (after Hornbogen et al.[8,9]).
those taking place during dSRX and are sometimes referred to as discontinuous dynamic recrystalli-zation (dDRX)[4,5].
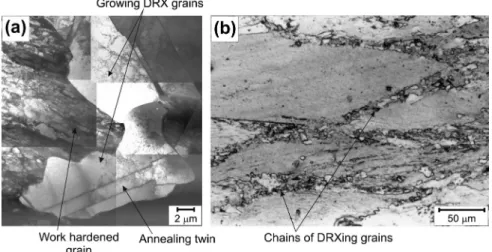
It has been recognized that the dynamic mechanism differs considerably from that operating dur-ing static recrystallization. The latter leads to the evolution of a uniform and dislocation-free grain structure after full annealing (seeFig. 1). High temperature plastic deformation, which promotes the bulging of corrugated grain boundaries, is described in more detail in Section3. As a result, dDRX grains initially have wavy boundaries and contain dislocation substructures that vary from grain to grain[13–20]. Even after dDRX is fully developed, i.e. during steady state flow, regions containing sub-structures continue to be present, in sharp contrast to the materials that have undergone dSRX. A typ-ical substructure developed during dDRX is shown inFig. 3a, and the necklaces of new grains that form along the boundaries inFig. 3b. The dynamic grain size produced depends sensitively on the deforma-tion condideforma-tions[21–25].
The mechanism of cDRX, on the other hand, is quite different. Here, the new grains form as a result of the increase in sub-boundary misorientation brought about by continuous accumulation of the dis-locations introduced by the deformation[25–36]. The formation of cDRX grains in an aluminum alloy during hot working is illustrated inFig. 4 [37]. The changes in the microstructure are associated with Fig. 3.Discontinuous dynamic recrystallization in pure Cu showing (a) growing grains during deformation at 623 K and (b) the necklace-like microstructure appearing during compression at 573 K[25].
Fig. 4.Development of new grains due to continuous dynamic recrystallization (cDRX) observed by OIM. The AA1421 aluminum alloy was processed by ECAP repeatedly to a strain of 12 at 673 K[37].
the continuous formation of HABs due to the accumulation of dislocations. The fraction of such bound-aries gradually increases during straining, until almost all the grains are bounded by HABs at
e
=12 for example.It should be noted that cDRX is characterized by much slower kinetics than those associated with DRX. This is because the formation of a cDRX microstructure requires remarkably large strains (e.g.
e
=12). By contrast, those produced by dDRX are propagated an order of magnitude more quickly (e.g.e
1)[25–27,29,33,37]. Curiously, cDRX may also produce a necklace microstructure at an inter-mediate stage, see Fig. 4. This is because of the rapid development of strain gradients near grain boundaries. The latter lead to the presence of large misorientations in the vicinities of the boundaries. Finally, it should be noted that, depending on the material and processing conditions, different mech-anisms of grain evolution can operate during SPD, as will be clarified in Section4.2.2. Flow stress behavior under hot working conditions
Two types of deformation behavior, resulting from dDRX and DRV, have been displayed by numer-ous metallic materials under hot working conditions, as can be seen inFig. 5 [38,39]. In the case of dDRX, new grains appear during straining. The new grains produce softening, decreasing the work hardening rate until eventually there is a clear stress peak. The flow stress then decreases with increasing strain until the level associated with steady state deformation is attained (Fig. 5a). The stea-dy state flow stress reflects the stea-dynamic equilibrium between strain hardening and strain softening due to the formation of new grains and the associated grain boundary migration. In some cases, sev-eral peaks of decreasing heights can be seen before the steady state behavior is achieved. Further de-tails of the structural changes taking place during dDRX will be described in Section3.
The second type of high temperature behavior is characterized by a continuous increase in flow stresses during plastic working, during which the rate of strain hardening gradually decreases with deformation and approaches zero at high strains, leading to a steady state of flow (Fig. 5b). Such behavior is attributed to the operation of DRV as the main restoration process[4,12,13]. In this case, steady state flow is attained when the rate of DRV has increased sufficiently to balance the rate of strain hardening. Such recovery-controlled steady state flow is generally observed at modest strains (
e
<1) during hot deformation at relatively low strain rates.Still a third kind of behavior is displayed during SPD experiments. Recent studies of the microstruc-tural evolution under these conditions have shown that the substructures developed by DRV during the early stages of straining progressively change their natures, not only at high temperatures, but also Fig. 5.Typical stress–strain curves obtained during the hot compression of steels accompanied by (a) discontinuous dynamic recrystallization (dDRX) in austenite[39]and (b) dynamic recovery (DRV) in ferrite[38].
at ambient temperatures[25,29,32,33,36,37]. In this case, the subgrain misorientations gradually in-crease until they attain HAB values at all homologous temperaturesT/Tmfrom 0 to 1. This type of pro-cess is referred to as cDRX and will be considered in Section4in detail.
2.3. Effect of structural factors and deformation conditions
The occurrence of dDRX on the one hand or cDRX on the other depends on the relation between the rate of DRV and the migration velocity (mobility) of the grain boundaries. dDRX generally takes place during the hot working of metals and alloys of low to medium stacking fault energy (SFE); these ex-hibit relatively low rates of DRV. The relationship between dDRX and DRV during hot deformation for representative metallic materials as it was understood around 1980 is summarized in Table 1 [13,15,20]. The fcc metals that undergo dDRX here are Ag, Au, Cu, Ni, Pb, Pt, and the austenitic steels
[11–20]. The critical strain for the operation of dDRX decreases with temperature increase and with decrease in strain rate as well as with decrease in the grain size[12–15,18–21,39,40]. On the other hand, the precipitation of second phase particles has the opposite effect on dDRX. When the pinning force due to the particles exceeds the driving force for boundary bulging, dDRX is suppressed and finer dDRX grains are formed at larger strains, if at all[41–43].
High SFE materials, in which DRV takes place with ease, are characterized, on the other hand, by the continuous transformation of subgrains into ultrafine grains; however, this requires the application of very large strains[29–33,36–38]. This takes place during SPD in metals such as Al,b-Ti, and ferritic steels. Enhanced dynamic recovery generally suppresses dDRX in high SFE materials, as the deforma-tion substructures produced are characterized by rather low dislocadeforma-tion densities and therefore low driving forces for dDRX. Exceptionally, dDRX-like behavior has been reported in such materials, but only in extra-high purity
a-iron and aluminum
[44,45]. At sufficiently large strains, which can only be applied by SPD, new fine grained structures form instead by the gradual transformation of sub-grains with LABs into UFGs with HABs. This is the process that is referred to as cDRX[46–48].During cDRX, geometrically necessary boundaries develop, which are gradually transformed into HABs [49]. The former separate microvolumes in which different combinations of slip systems are operating. As a result of the continuing deformation, these microcrystallites increase their misorientations and are gradually transformed into grains bounded by HABs. This process is observed during warm/cold SPD of both low and high SFE materials[25,46–48,50–53]. Also, cDRX takes place during SPD of high SFE materials at any value ofT/Tmfrom 0 to 1, as shown inTable 2 [4,25,30]. In two-phase materials, the development of HABs takes place more rapidly than in single phase materi-als. This leads to significant refinement of the original microstructure, as has frequently been observed
[54–58]. When SPD is carried out at cold and warm temperatures, strain localization occurs on a microscale and leads to the formation of microshear bands or MSBs. These play important roles in the development of UFG microstructures at large strains and their contributions will be discussed in Section4in detail.
Table 1
The dynamic restoration process (dDRX and DRV) operating during hot deformation and the metallic materials in which they have been observed (state of understanding around 1980)[13,15,20].
Restoration mechanism Materials Stacking fault energy (SFE) Dynamic recrystallization (dDRX) Au, Cu, Ni, Pb, austenitic Fe, and their alloys Low (to medium) Dynamic recovery (DRV) Al, Mg, ferritic iron, and their alloys High
Table 2
Ranges of operation of dDRX and cDRX during plastic deformation to very large strains[4,25,30]. Processing conditions (T/Tm) Stacking fault energy (SFE) of material
Low to medium High
Hot working (T> 0.5Tm) dDRX cDRX
3. Conventional dynamic recrystallization 3.1. Typical dynamic recrystallization flow curves
In materials subject to dDRX and at temperatures above 0.5Tm, the strain hardening produced by deformation is counteracted by this mechanism. It gradually reduces the work hardening rate until a flow stress maximum is reached after which there is strain softening (seeFigs. 5 and 6). In these materials (seeTable 1), the dislocation density increases to a high level and eventually some of the local differences in density reach a high enough level to permit the nucleation of new grains. This is followed by the long-range migration of HABs. As distinct nucleation and growth stages are induced, conventional dDRX is considered to be a two-step process.
In high SFE materials, by contrast, the rearrangement and annihilation of dislocations take place with ease, generally leading to the formation of equiaxed subgrains. Nevertheless, it has been shown recently that, even when only DRV is operating, new grain structures can be formed if very large strains are applied, for example by SPD processes [4,5,25,30]. The deformation microstructures appearing under the latter conditions differ appreciably from those produced by dDRX, as does the flow behavior. The DRV mechanisms operating under SPD conditions will be considered later and separately in Section4.
The flow curves appearing under dDRX conditions exhibit the characteristic shapes shown inFig. 6. The form of the curve changes from the multiple peak to the single peak type as the temperatureTis decreased or the strain rate
e
_ is increased, i.e. as the temperature compensated strain rate or the Zener–Hollomon parameterZexpressed by Eq.(1)is increased[11–15,20],Z¼
e
_expðQ=RTÞ ð1ÞHereRis the gas constant (8.317 kJ/mole K) and the apparent activation energy for deformationQis an experimental constant[4,11–20]. It generally takes values somewhat above those for self-diffusion, indicating that deformation under dDRX conditions is thermally activated and involves self-diffusion
[12,13].
Under dDRX conditions, the shape of the flow curve is also sensitively affected by the initial grain size.Fig. 6b illustrates a series of flow curves in the austenite of a plain carbon steel hot compressed at 1173 K[20]. The flow curve shapes change from the multiple peak to the single peak form as the initial grain sizeDois increased. In other words, multiple stress peaks appear when the initial microstructure Fig. 6.Typical stress–strain curves characteristic of dDRX in the austenite of plain carbon steels[20]. (a) A 0.4% C–1.5% Mn steel compressed at 1123 K and 1273 K at true strain rates between 105
and 101 s1
. (b) A 0.06% C–1.42% Mn steel with initial grain sizes of 60–375lm compressed at 1173 K and 1.4103s1.
is fine grained; in this case, grain coarsening takes place until the stable grain sizeDsis attained. By contrast, the single peak type of flow is associated with grain refinement in coarse grained starting materials. Thus whether the flow curve is of the multiple or single peak type is determined by the ratio Do/Dsof the initial to the final grain size and does not depend solely on the value ofZ, Eq.(1). These phenomena are discussed in more detail inSection 3.3.
3.2. The role of grain boundary bulging/sliding in nucleation of new dDRX grains
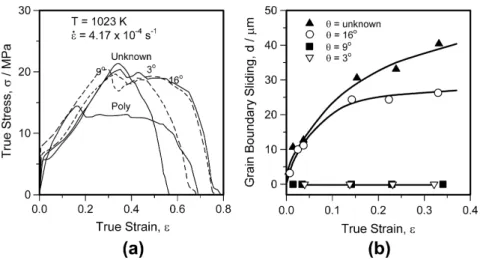
Miura et al. [59,60] have carried out at a systematic study of the effect of grain boundary character on dDRX using copper bicrystals. This has provided a fundamental understanding of the nucleation processes taking place during dDRX. Some typical flow curves for Cu–0.4% Si Fig. 7.Effect of grain boundary character on dDRX in copper bicrystals with differently misoriented [0 0 1] twist boundaries deformed in tension at 1023 K[59]. (a) True stress–true strain curves of the bicrystals and a polycrystal. (b) Relationship between grain-boundary sliding and tensile strain.
Fig. 8.(a) Dynamically nucleated grains at a 64°tilt boundary in copper bicrystals after deformation at 923 K and 4.2104 s1
[60]. T.A. is the tensile axis. (b) Schematic illustration of the twin variant selection caused by grain boundary migration. The tetrahedron at the top identifies the orientations of the active and inactive slip traces of the upper grain.
bicrystals, deformed in tension at 1023 K and 4104
s1
, are reproduced here in Fig. 7. The bicrystal boundaries were initially inclined at 45° to the tensile axis; the boundary types inves-tigated included [0 0 1] twist boundaries with misorientation angles of 3°, 9°, 16° and one that was unknown. The grain boundary character can be seen to affect the shape of the flow curve Fig. 9.Examples of dDRX grains nucleated at grain boundaries in polycrystalline copper compressed at 103
s1
to (a)e= 1.3 at 573 K (i.e. a highZ) and (b)e= 0.2 at 723 K (i.e. a lowZ)[61,62]. HABs with misorientations greater than 15°are delineated by thick black lines, LABs with misorientations in the range 4–15°by thin black lines and in the range 2–4°by thin grey lines. Twin boundaries are marked in yellow. The colors in the OIM micrographs correspond to the crystallographic orientations indicated in the inverse pole figure. (c) Schematic representation of the process of new grain formation during dDRX; here (1) boundary corrugation is accompanied by the evolution of dislocation sub-boundaries at low strains, (2) some grain boundary sliding is taking place, leading to the development of local strain gradients during further straining, and (3) the bulging out of parts of the serrated grain boundaries is accompanied by the formation of sub-boundaries at highZor twin boundaries at lowZ[59,61–63].
as well as the overall behavior. The stress peak
r
p and the strain at whichr
p appears,e
p, are considerably higher than those in polycrystals. This indicates that dDRX propagates more rapidly in polycrystals than in bicrystals.It can be seen fromFig. 7b that grain boundary sliding (GBS) took place in the 16°and ‘unknown’ bicrystals, while it hardly played a role in the low misorientation specimens. It is of interest to note that, in the latter bicrystals, dDRX was initiated in the grain interiors far from the usual sites at the boundaries. By contrast, nucleation took place at
e
0.15 at serrated boundaries in the 16°and un-known bicrystals. In this case, the development of serrations prevented further GBS, resulting in the development of high strain gradients at the boundary. It should be added in passing that metal form-ing operations are generally carried out at strain rates many orders of magnitude higher than those ofFig. 7. For this reason, GBS or shearing does not play a role under these conditions and nucleation takes place entirely as a result of the transformation of the bulges into nuclei. Miura et al.[60]also inves-tigated nucleation in bicrystals in which [0 0 1] tilt boundaries were aligned parallel to the tensile axis. Under these conditions, GBS cannot take place. It can be seen fromFig. 8 [60]that bulging followed by local boundary migration occurred and that this was accompanied by twinning. As a result, the new grains were twin-related (R3) to the matrix. Furthermore, as shown inFig. 8b, the primary twin traces were parallel to some of the inactive slip planes in the parent grains, indicating that these were annealing twins.
We turn now to nucleation in polycrystalline materials, which have been more frequently investigated. Here, nucleation occurs as a result of the fluctuations in boundary shape produced by straining, which develop into the serrations that are the actual nucleation sites[12–20,61–63]. Some typical microstructures of grains undergoing nucleation at the grain boundaries are illus-trated inFig. 9. These experiments were carried out on polycrystalline copper that had been com-pressed at
e
_103s1to (a)
e
= 1.3 at 573 K (i.e. at a highZ)[61] and (b)e
= 0.2 at 723 K (i.e. ata lowZ)[61,62]. It should be noted inFig. 9a that boundary bulging took place accompanied by the formation of sub-boundaries. In this case the strain was 1.3 and so appreciable strain and orientation gradients had developed at the boundaries. During compression at a lower value of Z, by contrast, new grains had already appeared at the lower strain of 0.2. In this case, as in that of the bicrystals of Fig. 8, a R3 twin boundary can be seen, as indicated by the yellow line in
Fig. 9b. The latter are frequently developed at higher temperatures because of the higher mobility of the grain boundaries.
Based on the observations described above, a nucleation model for dDRX can now be drawn up, as represented schematically in Fig. 9c[59–63]. First, dislocation density gradients are devel-oped near the original grain boundaries because of the incompatibilities between grains. This is accompanied by subgrain formation, leading eventually to the development of boundary corruga-tions or serracorruga-tions. At the lower strain rates, GBS can take place along the boundaries, leading to the development of additional inhomogeneous strains, further increasing the driving force for recrystallization. The condition for bulging to occur under dynamic conditions is expressed as follows [59]:
DE
>4K1c
B=L ð2ÞHereDEis the strain energy difference per unit volume across the boundary,
c
Bthe grain boundary energy per unit surface area, andLthe length of the boundary prior to bulging. The proportionality factorK1is generally less than one under dDRX conditions. This is because the grain boundaries arealways serrated before growth by bulging takes place. In the case of static recrystallization,K1is
usu-ally one, as originusu-ally proposed by Bailey and Hirsch[6].
It is of interest that nucleation takes place at triple junctions at much lower strains than along the boundaries[64]. Even when GBS is occurring, it is impeded at triple junctions, again adding to the strain gradients. In the case of polycrystalline copper, for example, nucleation at a triple junction took place at the remarkably low strain of about 0.01, which is only 1/10 to 1/20 of the peak strain[64]. On further straining to 0.04, nuclei were observed to be present at about 10% of the triple junctions. Irre-spective of the testing conditions, more than 80% of the grains nucleated at triple junctions were annealing twins in that investigation[64].
3.3. Dislocation substructures in dDRX grains
As in the case of ambient temperature deformation, the average cell size of high temperature dis-location substructures decreases during straining and the subgrain boundaries are sharpened. Finally, the nucleation of dDRX grains begins to take place at around 0.5
e
pwith the rate increasing to a max-imum at arounde
p. At large strains, where dDRX has been propagated through the entire volume, the substructure density varies from grain to grain. Such microstructures can be subdivided into the three categories illustrated schematically on the upper half ofFig. 10 [17]. Here the dislocation densityq
ois the initial fully annealed value,q
cis the critical value for nucleation, andDthe local dynamic grain size;q
candDdepend sensitively on temperature and strain rate viaZin Eq.(1). The current state is represented by the solid lines and earlier states by the dashed lines. The three types of grain in this model correspond to; (a) a dDRX nucleus, (b) a growing dDRX grain containing a dislocation density gradient, and (c) a critically strain-hardened grain after impingement.Some typical TEM micrographs of dynamic microstructures are represented in the lower half of
Fig. 10. Here (d), (e) and (f) correspond to the respective grain types introduced above. In this case, nickel was deformed in tension at 1073 K and 1.5101s1and hydrogen quenched[17]. In an actual
Fig. 10.Three types of dDRX grains and corresponding TEM micrographs[17]. Three types of dislocation density distribution develop in the microstructure: (a) a dDRX nucleus, (b) a growing dDRX grain, and (c) a critically strain hardened dDRX grain. Hereq0is the initial (annealed) dislocation density,qcis the critical value required for dynamic nucleation, andDis the current
dDRX grain size. The current state is represented by the full lines and one or more earlier states by broken lines. In the TEM micrographs at the bottom, the dislocation substructures identified as (d), (e) and (f) correspond to grains (a), (b) and (c), respectively. Here nickel was deformed in tension at 1073 K and 1.5101
s1
recrystallizing microstructure, regions belonging to each of these three types are distributed fairly uni-formly throughout.
The heterogeneous microstructures formed during dDRX display an annealing behavior that differs from that pertaining to cold worked materials. This topic is treated separately in Section5. Here the microtextures that develop during dDRX will be considered in terms of the microstructure model of
Fig. 10. A sample of pure copper was compressed to a strain of 1.3 at 723 K and 101s1. Under these
conditions, a fully developed dDRX microstructure is generated[62]. Inverse pole figures (IPFs) were determined on the recrystallizing grains by the electron backscatter diffraction (EBSD) method; these are displayed inFig. 11in the form of both contour (Fig. 11a) and discrete (Fig. 11b) plots. Here the compression direction is shown. Theh1 0 1ifiber can be seen in the left hand IPF ofFig. 11a; this is the conventional deformation fiber developed during cold compression, although it is very weak, However, the right hand IPF ofFig. 11b indicates that randomly oriented grains are also present. These result from the orientation randomizing effects of dDRX. According to the model ofFig. 10, strain-hardened grains (c) of various orientations only exist stably for a limited period of time until the next cycle of dDRX begins. During compression, although they develop the required deformation texture, which is theh1 0 1ifiber, many grains are rotated out of this orientation by dDRX, which acts to weak-en the fiber. Whweak-en the temperature is increased, dDRX takes place more rapidly, so that the intweak-ensity of theh1 0 1icomponent decreases with increasing temperature[62,65].
3.4. dDRX models
Typical dDRX flow curves exhibit regular oscillations in stress at low values ofZor a single stress peak followed by strain softening at highZvalues. At large strains, a steady state of flow is attained in both cases (Fig. 6). In the original descriptions of dDRX, much attention was paid to this changeover behavior[12–15,20,40]. For example, Luton and Sellars[40]took the view that the transition is asso-ciated with the different strain rate and temperature dependences of the peak strain
e
pon the one hand and the straine
xfor the completion of flow softening after the flow stress peak has been attained, i.e. of the first cycle of dDRX, on the other. The critical condition for this ‘‘critical strain-based’’ model can be expressed as:ep
¼ex
ð3ÞAt low values ofZ, when
e
p>e
x, dDRX is cyclic; conversely at higherZvalues, whene
p<e
x, dDRX operates continuously throughout the material.Although the critical strain-based model is in reasonable agreement with the data obtained in solid bar torsion investigations, it does not apply to tension or compression results or even to torsion tests result carried out on tubular samples [20]. More recently, a more physically based model was Fig. 11.Inverse pole figures of the deformation microtexture developed in pure Cu determined using EBSD. The sample was compressed to a strain of 1.3 at 723 K at a strain rate of 101
s1
[62]. The contour plots are on the left (a) and the discrete plots on the right (b).
proposed linking the shape of the flow curve to the initial grain size[14,18,20]. One of the results ob-tained was illustrated inFig. 6b above. Here it was shown that multiple stress peaks are observed when the initial grain sizeDois fine and conversely single peak curves are associated with the defor-mation of coarse grained material. Whether the flow curve is of the multiple or single peak type de-pends not only on the initial grain size, but is determined by therelativegrain size (Do/Ds), whereDsis the stable dynamic grain size established at large strains. This leads to the ‘‘relative grain size (RGS)’’ condition for the transition, which is expressed by[20,66].
Do¼2Ds ð4Þ
WhenDo>2Ds, grain refinement and single peak flow take place. Conversely, whenDo< 2Ds, multi-ple peak flow is accompanied by grain coarsening. AsDsis sensitively affected byZ,Do>2Dsand single peak flow correspond to deformation under highZconditions; conversely,Do<2Dsand cyclic flow cor-respond to lowerZconditions[12–15,20,66]. These two contrasting cases are closely related to the nature of dDRX and will be discussed in more detail below.
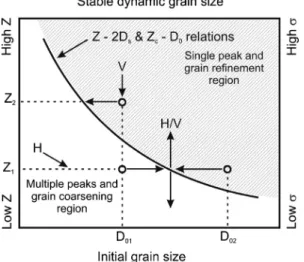
As outlined above, the changeover from multiple to single peak behavior occurs whenDo= 2Ds, so that the transition is also associated with a critical value ofZ, labeledZc. In other words, there is aZcvs. Dorelation that approximately overlaps theZvs. 2Dsdependence. The similarity between theZc–Do andZ–2Dsrelations can be seen to better effect inFig. 12, where the cross-hatching distinguishes the grain refinement from the grain coarsening region and the solid line represents the experimentally determined locusDo= 2Ds. According to this diagram, three different types of tests can be carried out in the laboratory, which have been referred to as vertical (V), horizontal (H) and combined V/H experiments.
V tests are carried out with a fixed initial grain sizeDobut at a series of different values ofZ. These correspond to the classical experiments depicted inFig. 6a. Testing carried out on samples with a range of initial grain sizes at a fixed value ofZ(seeFig. 6b), correspond to the H tests illustrated in
Fig. 12. The two types of behavior, i.e. multiple peak and grain coarsening or single peak and grain refinement, are readily represented on such diagrams. In Fig. 6b, a 0.06% C–1.43% Mn steel was austenitized at temperatures from 1173 to 1533 K selected to produce initial austenite grain sizes of 60–375
lm, respectively, and then compressed to
e
= 1.0 at 1173 K and 1.4103s1, for which2Ds150
lm. Cyclic
r
/e
behavior was observed whenDo< 2Ds; by contrast, single peak behavior was obtained whenDo> 2Ds[20].Fig. 12.Microstructure mechanism map for distinguishing between the two types of dDRX. The curves describing theZ–2Ds
andZc–Dorelations separate the single peak (grain refinement) and multiple peak (grain coarsening) regions. Three distinct
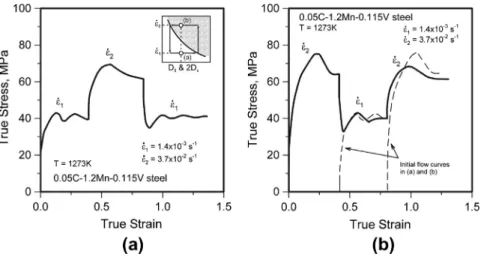
The third type of RGS experiment consists of H/V tests that involve strain rate changes during straining. An example is provided inFig. 13, which depicts the stress–strain curves determined on a 0.115% V steel deformed at 1273 K. InFig. 13a, the strain rate was increased from 1.4103 to
3.7102s1; inFig. 13b, the reverse change was performed[67]. When the strain rate was suddenly
increased to
e
_2after attainment of the stable microstructure ate
_1, grain refinement and single peakflow were expected to occur according to the RGS model. These predictions were confirmed by the re-sults displayed inFig. 13a. It is important to note that the transition behaviors produced in this way were completely reversible and so are consistent with dDRX being controlled by a thermally activated mechanism[66–68]. It should be underlined that the reversible dDRX phenomena just described stand in sharp contrast to those taking place under cDRX conditions. These phenomena will be considered in detail in Section4, whether the irreversible and athermal aspects of cDRX behavior will be described. Fig. 13.Examples of H/V tests involving strain rate changes carried out on a 0.115% V steel deformed at 1273 K; (a) the strain rate was cycled from 1.4103
to 3.7102 s1
and back to 1.4103 s1
at strain intervals of about 0.45; (b) the strain rate was cycled from the higher to the lower value and then back again[67].
Fig. 14.Effect of initial grain sizeDoon (a) average grain sizeDand (b) number of fine grainsNper unit area less than 10lm in
diameter. Here nickel samples were deformed in tension at 923 K at a strain rate of 2103 s1
and then hydrogen quenched
Finally, the development of dDRX microstructures will be examined in the light of the RGS model. Some changes in grain sizeDtaking place during the high temperature deformation of Ni are illus-trated inFig. 14a[66]. Here, samples with two different initial grain sizes (30 and 60
lm) were
de-formed in tension to several strains at 923 K and a strain rate of 2103s1 and then hydrogengas quenched. It is evident fromFig. 14a that the 60
lm sample displays continuous grain refinement
until the stable grain size of 38lm is attained. This experiment was associated with single peak flow
(not shown here). Conversely, the 30lm specimen underwent coarsening to the same final stable size.
In this case, the flow curve was of the multiple peak type (not illustrated).The dependence of the density of fine grains (<10
lm in diameter) per unit volume
Non strain in this experiment is illustrated inFig. 14b. It can be seen that the nucleus densityNoate
pin the 30lm
sample is much higher than the stable value (Ns) at high strains. These results indicate that the relative nucleus densityNo/Nsdetermines the shape of the dDRX flow curve. When the ratio is greater than one, the curve is of the multiple peak type. Conversely, when it is less than one, single peak behavior will be observed. HereNoandNscorrespond to the nucleus density at the start of dDRX (i.e. prior toe
p) and the stable value at high strain, respectively. The relationship betweenDandNis given approxi-mately byN= 2P/D(wherePis the probability of activation of a grain boundary site per unit surface area)[20,66,67]. In the fine grained material (Do< 2Ds),No>Ns, and the growth of each new dDRX grain is terminated by boundary impingement. This leads to the development of an intermediate grain sizeD0s, whereD
0
s<Dsbecause of the initial excess density of nucleation sites. The value ofD0sincreases with each cycle of recrystallization until it attains the stable valueDs. In the coarse grained material (Do>2Ds),No<Ns, and grain refinement occurs until the appropriate densityNsis attained.
Before terminating this section, the relation between the deformation conditions (i.e.Z) and the stable dynamic grain sizeDswill be discussed briefly because of its importance in understanding dDRX behavior. It was mentioned above thatDsdepends sensitively onTand
e
_, where the dependence can be expressed as a function of Z; there is a similar link between Ds and the steady state stressr
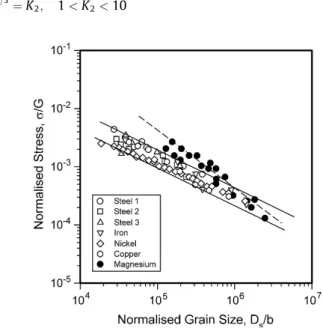
[12–23,40,61–63]. Some typical relationships between the normalized steady state flow stress and the normalized grain size are illustrated inFig. 15for various metallic materials. The original figure prepared by Derby[21]included minerals such as pyrite, halite, and olivine as well as metals. Derby found that all the data fell in a remarkably narrow range bounded by loci of the form
ð
r
=GÞðDs=bÞ 2=3¼K2; 1<K2<10 ð5Þ
Fig. 15.Relationship between flow stress normalized by the shear modulus and dDRX grain size normalized by the Burgers vector for metallic materials. (In the original figure prepared by Derby[21], the data included a number of minerals as well.) The solid line represents fcc metals undergoing dDRX and the broken line Mg undergoing cDRX.
He showed that such a relation can be derived by considering that a dynamic balance is achieved between the rate of formation of the dislocation substructure on the one hand and its removal on the other, as determined by the mean velocity of the dDRX grain boundaries. It can clearly be seen in
Fig. 15that when only the fcc metals are taken into consideration, the data fall in a much narrower range, as indicated by the solid lines. This is bounded by loci of the form:
r
=G¼K3ðDs=bÞ 2=3; 1<K3<2 ð6Þ
Such a relationship between
r
andDshas been reported by many researchers[12–23,40,61–63,66]. Finally it is of interest to note that the data for Mg inFig. 15are not well expressed by Eq.(6), but may be approximated by a dashed line with a slope of 0.9–1.0. Similar results have been reported for the AZ31 Mg alloy[69]. This indicates that new grain formation in Mg alloys probably does not result from the dDRX model discussed above. Some insight into the factors responsible for this atypical behavior can be gained from the work of Yang et al.[69,70]. They showed that new grain formation in Mg alloys is affected by a series of strain-induced reactions, such as grain fragmentation due to the formation of kink bands. As this type of process bears some resemblance to cDRX, it will be taken up again in Section4.3.5. Application to industry 3.5.1. Rolling simulations
Because of the link between structure and properties, it is essential to produce desirable micro-structures during industrial rolling, particularly in the case of steel. For this reason, there have been numerous studies in which rolling simulations have been carried out in order to characterize and opti-mize the types of structures that are likely to be produced in the plant. These simulations also provide estimates of the rolling load, separation force, and torque via the mean flow stress (MFS). Although dDRX is not always initiated during hot rolling, simulations can be used to predict the cases when it is expected to takes place.
The effect of interpass time on the conditions for the initiation of dDRX is described first. This is because the length of the interpass interval plays a huge role during industrial processing. When inter-pass times are very short, as in the finishing stages of rod rolling, there is insufficient time for static recrystallization (SRX) or for carbonitride precipitation. Under these conditions, strain accumulation takes place, leading to the initiation and propagation of dDRX. Conversely, when interpass times are long, as in plate rolling and when reversing mills are being used, there is ample time for SRX or, in microalloyed steels containing Nb, for carbonitride precipitation. The latter prevents the initiation of dDRX. In the case of strip rolling, the interpass times fall between those of rod and plate rolling. In this case, there is no or only limited SRX, leading to strain accumulation and the initiation of dDRX in the general case. The effect of interpass time on the nature of the softening processes taking place and, in particular, on whether dDRX has been initiated or not, has received considerable attention. Dis-cussions of this topic can be found in[71–75].
The finishing stages of seamless tube rolling have been studied in laboratory simulations and the results published in Refs.[76–78]. These have shown that strain accumulation takes place, leading to the initiation of dDRX. This is because of the short (0.5 s) interpass times in the finishing stages. The occurrence of dDRX under these conditions can be deduced from the shape of the envelope of the set of flow curves, as shown inFig. 16. In such cases, dDRX plays a large role in establishing the final aus-tenite microstructure and grain size (prior to transformation). Descriptions of rod rolling simulations are available in Refs.[79–84]and an example of a torsion simulation is provided inFig. 17. Here it can be seen that, as in the case of seamless tube rolling, SRX does not take place during the short interpass intervals (as short as 20 ms) applicable to the finishing stages of rolling. Instead, there is strain accu-mulation during the six finishing passes, leading to the initiation of dDRX. In the presence of Nb, there is an absence of SRX even at the relatively high temperature of 1100°C such that strain accumulation takes place, again leading to dDRX. As dDRX can be followed by rapid metadynamic recrystallization (mDRX) this may lead to sudden load drops, although this is not of particular concern in rod rolling as the process does not require careful control of reduction and rolling load.
Plate rolling simulations are generally concerned with determining theTnr, the temperature at which full SRX is no longer able to take place during rolling. This defines the point in the schedule at which strain accumulation begins, leading to the ‘pancaking’ of austenite (important for the produc-tion of fine grain sizes in high-toughness steels). A full descripproduc-tion of the most common (‘Boratto’) method of determining theTnris given in[85,86]. Examples of plate rolling studies can be found in
[87,88]. The results of a typical multi-pass simulation on a torsion machine are presented in
Fig. 18a, on which the change in the shape of the pass flow curve after pass 7 can be readily seen. The shape change indicates that static recrystallization is no longer taking place between passes. An example of a mean flow stress (MFS) vs. inverse absolute temperature (1/T) plot determined in such simulations is presented inFig. 18b. Here it can be seen that theTnrcan be readily identified from the Fig. 16.Torsion simulations of a sixteen pass rolling schedule applied to two V steels in a stretch reducing mill (SRM)[76]. (a) The experimental data; (b) after correction to a constant temperature of 905°C. Note that the flow curve envelope displays the characteristic ‘single peak’ curve indicative of dDRX.
Fig. 17.(a) Torsion flow curves determined on a plain C steel at 900°C[84]. The last six passes, which collectively exhibit the characteristics of dDRX, make up the finishing schedule. (b) Flow behavior of a Nb microalloyed steel at 1100°C; the envelope of the finishing passes is again indicative of dDRX.
change in slope, which defines the temperature below which SRX is no longer able to take place or go to completion. From this point onwards, there is strain accumulation, although it is important to note that this does not lead to dDRX in microalloyed steels because of the carbonitride precipitation that takes place during the interpass intervals.
Accounts of the physical simulation of strip rolling can be found in Refs.[89–95]. An example of the results obtained in torsion simulations is presented inFig. 19a. Here, interpass times of 1 and 3 s were employed and it can be seen that the rate of increase in MFS with 1/Tis much lower than in the case of Fig. 18.(a) Torsion simulation of an average schedule on a Steckel mill; microalloyed steel, 30 s interpass times, cooling rate – 1°C/s[85]. (b) MFS vs. 1/Tplot based on four sets of simulation flow curves. The change in slope identifies theTnrtemperature,
departures from linearity, the upper (Ar3) and lower (Ar1) critical temperatures[86].
Fig. 19.(a) Simulations of plate (30 s interpass times) and strip (1 s and 3 s interpass times) rolling[95]. The cooling rate in the strip rolling cases was 10°C/s. Note the low rates of increase in MFS with decreasing temperature in the four strip mill simulations. (b) The two sets of flow curves determined in the strip mill simulations with entry temperatures of 950°C; these have been corrected to a constant temperature of 950°C to show how increasing deformation produces increasing ‘‘softness’’ in the test specimens.
the plate rolling (30 s) simulations. The 950°C ‘entry temperature’ continuous-cooling flow curves of
Fig. 19a are shown replotted inFig. 19b after correction to a constant deformation temperature of 950°C. Here it can be seen that the corrected flow stress decreases continuously during continued straining. This is due, not only to the initiation of dDRX during rolling, but also to that of dynamic transformation (DT), a topic that is treated in Section3.6. The occurrence of dDRX followed by mDRX in combination with DT can lead to unexpected flow stress drops or reductions in rolling load. Some general reviews of the occurrence of dDRX under hot rolling conditions can be found in publications such as[96–99]while briefer accounts of the conditions under which dDRX is expected to take place are available in[100–108]. The phenomenon of dDRX in Cu-30Ni has been discussed in[109], in Mg alloys in[110], and in 304 stainless steel in[111–113]. Constitutive relations applicable to dDRX have been proposed in[114], while the application of self-consistent models to the development of torsion textures when dDRX is taking place is described in[115].
3.5.2. Kinetics of dDRX and mDRX
The Avrami formalism is generally used to quantify the kinetics of SRX[e.g. 4]. Nevertheless, it can also be employed to describe those of dDRX and mDRX. Examples of such studies can be found in
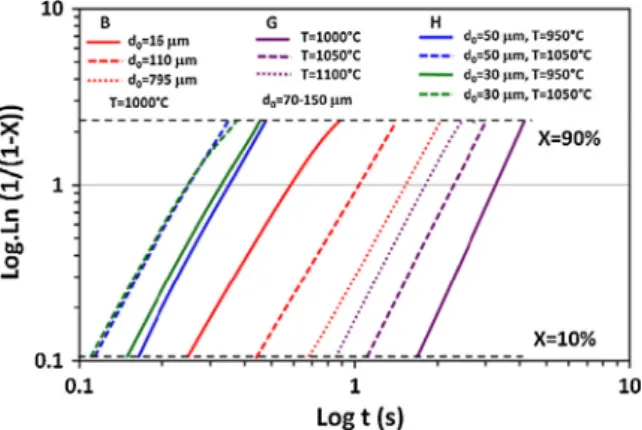
[116–122]. A recent improvement in Avrami models involves expressing the softening produced with respect to the austenite that has not yet been subjected to recrystallization, but is continuing to strain harden[123]. Here the work hardening behavior of the unrecrystallized component of the microstruc-ture is deduced from the initial part of the flow curve, which has not yet been affected by the initiation of dDRX; this behavior is then extrapolated beyond the critical strain[123–127]. Some examples of Avrami plots describing the progress of dDRX are presented inFig. 20 [126]. In this diagram, the extent to which coarse microstructures retard dDRX can be readily seen as well as the effects of deformation temperature and composition. The addition of alloying elements to steels and other metals is well known to retard recrystallization as a result of solute drag. Such solutes can modify the transformation behavior as well as retard recrystallization. In the case of boron addition, the latter effect is discussed in Ref.[128]. The influence of substitutional alloying elements on the rate of softening in nickel is trea-ted in[129–131]and solute retardation more generally in[132].
Once dDRX has been initiated, it is generally followed by mDRX. This is much more rapid than the conventional type of SRX that follows deformation in the absence of dDRX. The rapid kinetics are gen-erally explained in terms of the elimination of the time required to nucleate new grains (because of the prior occurrence of dDRX) so that onlygrowthof the new grains is involved. This topic is treated in detail in Section5. The occurrence of mDRX has been studied under simulated hot rolling conditions
Fig. 20.Avrami plots of the softening produced by dDRX during compression testing. The data were obtained on the following steels: B (C: 0.07, Mn: 0.62, Si: 0.01, Ti: 0.067, Nb: 0.034); G (C: 0.23, Mn: 0.74, Si: 0.22, Cr: 0.90, Mo: 0.08) and H (C: 0.03, Mn: 0.3) and show the effects of test temperature and initial grain size[125].
and described in Refs.[80,84,133–139]. The large differences in the rates of softening produced by SRX as opposed to mDRX are illustrated inFig. 21a (static) and b (metadynamic).
An interesting sidelight concerning mDRX is that the kinetics of this softening mechanism become strain independent once a certain prestrain is attained[140]. This topic has been explored in several publications[138,141]and a possible explanation has been put forward in Ref.[142]. An illustration of the strain at which the kinetics of softening become strain independent is given inFig. 22. This inves-Fig. 21.(a) Interrupted compression flow curves determined on a Nb microalloyed steel containing 0.28% Mo at 950°C[139]. After a prestrain of 0.22, the only softening observed on reloading after a 0.5 s unloading interval is due to static recovery (no SRX). (b) After a prestrain of 0.82 at 1000°C (where dDRX is well under way), there is very rapid and almost complete softening after only 0.5 s.
Fig. 22.Time of half-softening as a function of strain after deformation under a variety of conditions determined in torsion on a 304 stainless steel. dDRX is initiated atec, mDRX takes place on unloading at strains beyondec, and the time of half-softening
tigation was carried out on a 304 stainless steel, which permitted measurement of the volume fraction recrystallized as well as of the kinetics of softening. It can be seen from the diagram that strain-inde-pendence of the time of half-softeningt50is attained well after the peak in the flow curve (
e
p). It cor-responds instead to the moment (e
*) when the volume fraction recrystallized dynamically(determined metallographically) has attained 50%[142]. Thus, even if dDRX has progressed beyond the point where 50% of the volume of the material has been ‘transformed’, the rate of mDRX is not affected or increased.
3.5.3. Effects of dDRX on ductility and texture
Because dDRX removes dislocations and refines the grain size, it can improve the ductility as well as the toughness if it is initiated during deformation. This can also be of particular importance during continuous casting, when slab straightening is taking place and tensile stresses are induced locally. The effect of dDRX on ductility has been described in[143,144].
Texture control in industrial materials is of great importance because of the significant effect of texture on properties. In principle, it should be possible to use the occurrence of dDRX to produce im-proved textures. Conversely, in the case where its effect on the texture is harmful, it is essential to pre-vent dDRX from being nucleated. Unfortunately, there is a significant lack of suitable models that can be used to predict the effect of dDRX on texture, although a promising approach has been presented in
[115]. Furthermore, there is not a great deal of experimental evidence demonstrating its effect along the different industrial strain paths, such as extension, compression, plane strain deformation (i.e. roll-ing) or shear. Generally speaking, dDRX, when initiated, has the effect of somewhat randomizing the texture or at least rendering the deformation texture less intense, as was seen above inFig. 11. The results of an investigation of the effect of dDRX on torsion (shear) textures can be found in
[145,146]and on textures more generally in[147–151]. A model for the operation of oriented nucle-ation and selective growth during dDRX has been published as Refs.[115,152,153].
3.6. Detection of the dDRX critical strain
It is important to determine the critical strain for the nucleation of dDRX. Unfortunately, it is dif-ficult to employ metallography to establish the precise moment when dDRX is initiated, because of the instability of conventional austenite at room temperature. Fortunately, a very accurate method, known as the double-differentiation technique, was developed in 1996 [154]and is now in wide use. It involves measuring the slopeh=@
r
/@e
of a stress–strain curve, taking the derivative of thisFig. 23.Effects of (a) strain rate and (b) temperature on the flow stress dependence of@h/@rin nickel[154]. The stresses that correspond to the minima in these plots must then be located on the original flow curves in order for the critical strains to be identified.
slope with respect to stress, i.e. calculating the value of@h/@
r
, and then plotting the negative of the latter value against stress. A local minimum in this parameter identifies a point of inflection in the curve of slope vs. stress and therefore specifies the moment when a new softening process is initiated (in addition to dynamic recovery). Because ‘‘noise’’ in experimental stress/strain curves renders differ-entiation difficult, measured flow curves must first be smoothed using appropriate polynomials, usu-ally of order 8 or higher[154–157]. It is of interest that this technique does not require the test to be run at constant strain rate, but is also applicable to variable rate deformation[158]and to any testing mode, i.e. tension, compression, plane strain tension or compression, and shear (torsion)[155,157].Typical plots of the second derivative against stress taken from the original publication are shown inFig. 23 [154]. A modification of the double derivative method that leads to considerable simplifica-tion has been proposed in Ref.[159]. The minima illustrated inFig. 23pertain to the high temperature deformation of nickel; similar plots were derived from flow curves measured on a type 304 stainless steel and were also reported in Ref.[154]but are not reproduced here. These two metals do not under-go phase changes on cooling and so are not susceptible to dynamic transformation. The same condi-tions apply to fcc metals such as Ag, Au, Cu, Pb, and Pt. However, conventional austenite does transform into ferrite and cementite on cooling or into other metastable phases. Furthermore, as shown by Yada and co-workers in the 1980s[160,161], the transformation to ferrite can be induced at temperatures well above the Ae3when austenite is being deformed, whether in the laboratory or
in a rolling mill. The effect of dynamic transformation (DT) on dDRX-type flow curves will now be discussed.
3.6.1. Dynamic transformation
Because ferrite is softer than austenite at a given temperature, this property leads to a reduction in flow stress compared to that applicable to untransformed austenite. Such softening makes it also pos-sible to detect the initiation of the transformation by the double differentiation method[162,163]. However, care must be taken for the two critical strains (one for DT and one for dDRX) to be distin-guished from one another. When there are two possible minima, the use of polynomial orders (for smoothing) as high as 12 are required if theentireflow curve is being fitted; otherwise seventh or eighth order polynomials are usually sufficient[164].
Examples of two sets of double derivative minima are presented inFig. 24a. These curves were de-rived from compression tests carried out on a 0.038% Nb microalloyed steel with an orthoequilibrium
Fig. 24.(a) Dependences of the second derivative of the stress on stress in a 0.11% C–0.038% Nb steel derived from compression testing flow curves. (b) Dependences of the dDRX and dynamic transformation (DT) critical strains on deformation temperature. The DT critical strains decrease slightly with temperature, while the dDRX critical strains decrease more rapidly with temperature and decreasing strain rate in the usual way[164].
Ae3temperature of 848°C[164]. As can be seen, DT minima were observed right up to 1150°C, i.e. to
300°above the conventional upper critical transformation temperature. The critical strains deter-mined in this way are illustrated inFig. 24b, from which it can be seen that DT is initiated well before dDRX at strains of about 0.05–0.1. Under the high strain rate conditions applicable to industrial rolling, the dDRX critical strains are considerably higher than those shown here and the gap between the two strains is therefore greater than indicated in the diagram.
Similar results have been reported for four other steels deformed in torsion, where again the critical strains for the initiation of DT preceded those for dDRX[165]. These observations have two important implications. One is that the ubiquitous ‘‘single peak’’ austenite flow curve is a product oftwo soften-ing mechanisms (in addition to dynamic recovery), DT as well as dDRX. (This conclusion does not ap-ply to the other fcc metals mentioned above.) The other is that the unexpected drops in rolling load observed at temperatures above the Ae3actually have their origins in the operation of both the above
softening mechanisms (i.e. DT and dDRX) and not just dDRX followed by mDRX. The interested reader is referred to Ref.[166], where this topic is treated in more detail.
4. Continuous dynamic recrystallization and severe plastic deformation 4.1. General characteristics of flow behavior and microstructures developed 4.1.1. Historical development of severe plastic deformation
The development of severe plastic deformation (SPD) techniques was motivated by an interest in producing ultrafine grained (UFG) metallic materials. These were expected to possess beneficial com-binations of physical, chemical, and mechanical properties. It should be noted that plastic deformation accompanied by dDRX is a unique method for producing grain refinement in metals that do not under-go phase transformation. Since the dynamic grain size that is produced during working depends sen-sitively on the deformation conditions and in particular decreases as the temperature is decreased, as described in detail in Section3, superior grain refinement can be expected to involve the use of rela-tively low deformation temperatures. Unfortunately, the critical strain for the initiation of dDRX in-creases drastically as the deformation temperature is reduced. Methods for producing UFG
Fig. 25.Principles of (a) equal channel angular pressing (ECAP), (b) high pressure torsion (HPT), (c) multi-directional forging (MDF) and (d) accumulative roll bonding (ARB).
materials must therefore be based on a different mechanism, which must still involve relatively low temperatures, and will necessarily require the application of very large strains. Examples of represen-tative SPD techniques are illustrated inFig. 25and will now be described briefly in turn.
Following the principles outlined by Segal et al.[167], the equal channel angular pressing (ECAP) method was developed and has been used successfully for over three decades. It is particularly well studied for processing soft materials and has become quite popular[30,168–170]. The sample is pressed through two intersecting channels of the same shape and cross section and the equivalent strain is evaluated as follows[30]:
e
¼ f2 cot½0:5ð/þwÞ þwcosec½0:5ð/þwÞg=pffiffiffi3 ð7Þ Here/is the inner angle between the channels andw
is the outer or shear zone included angle of channel intersection (seeFig. 25a). Because the cross-section of the sample is kept constant, it can be passed repeatedly through the die, leading to the accumulation of large strains. The specimen can be pressed repeatedly in the same manner or it can be rotated between passes by 90°or 180°[30,170].
Another frequently used technique is torsion under high axial pressure, known as high pressure torsion (HPT)[171,172](Fig. 25b). The strain that is imposed on a disc-shaped sample depends on the thickness (t), radius (R) of the specimen, and rotation angle (h) in radians[171]:
e
¼ ðhRÞ=ðtpffiffiffi3Þ ð8ÞNote here that Eq.(8)above does not agree with Eq.(1)in[30]nor with Eq.(6)in[172], which are both in error, as explained in some detail in[171]. When the specimen thickness is reduced during HPT, an additional component of compressive strain must be added to the imposed shear strain. In comparison with ECAP, HPT does not require costly equipment and can be employed on a wide variety of metals and alloys, including hard-to-deform materials. One limitation is that it cannot be used on large samples.
In the early 1990s, multi-directional forging (MDF) was developed as a simple method for applying large strains that is particularly useful for the processing of bulk products[173]. True stress–true strain diagrams are readily obtained when this technique is used[46,48]. According to this method, a prismatic specimen is compressed sequentially along its three principal axes, as shown in
Fig. 25c. As long as the strain in each forging pass (determined by the ratio of the initial to the final dimension of the specimen, i.e.
e
= ln(Hi/Hf)), is well below 1, the shape of the specimen does not change appreciably as a result of multiple deformations.At the end of the last century, another promising SPD technique known as accumulative roll-bond-ing (ARB) was developed to produce large bulk semi-products usroll-bond-ing a conventional rollroll-bond-ing mill (Fig. 25d)[174,175]. According to this process, a sheet of material is rolled to 50% reduction and then cut into two portions; these are stacked together and rolled again. This procedure can be repeated many times so as to achieve the final total strain required. The latter is given by
e
¼ ð2=pffiffiffi3Þnlnð1rÞ, wherenandrare the number of ARB cycles and the fractional reduction in thickness per cycle, respectively. The ARB technique does not require any special equipment and can be used to apply very large strains as the initial dimensions of the sample do not change. A dis-advantage of the ARB technique is that it necessitates careful surface treatment, e.g. degreasing and wire brushing, before stacking so as to achieve good bonding and avoid delamination.The SPD methods described above are now widely used to study deformation behavior and micro-structure evolution during SPD as well as to produce samples for property determination. There are a number of additional techniques that also qualify as methods of SPD, such as mechanical milling, cyc-lic extrusion/compression, continuous cyccyc-lic bending, repetitive corrugation and straightening, and high pressure tube twisting[176–182]. Among these, mechanical milling has been the most exten-sively studied. During mechanical milling, individual powder particles receive very large strains, although the actual amount cannot be estimated. Another difficulty is that the samples require addi-tional consolidation. Thus mechanical milling is not well suited for the investigation of stress–strain behavior and microstructure development. The other techniques mentioned above are not frequently
used, although data are available on cyclic extrusion/compression[176]and/or other newly intro-duced methods[179–182].
4.1.2. Microstructural characteristics developed under SPD conditions
The plastic working of metals and alloys at relatively low temperatures produces a hierarchy of dis-location substructures[183–188]. The initial stages of straining introduce high dislocation densities, which are arranged in cellular substructures. An increase in strain is attended with localizations of plastic flow on a microscopic scale. The dislocation cells evolve into cell blocks that are subdivided by dense dislocation walls; these are essentially dislocation sub-boundaries whose misorientations are appreciably larger than those of common cell walls. Then, various deformation bands begin to appear at medium strains that introduce still larger misorientations. This leads to the subdivision of the original grains into small, heavily misoriented fragments. This process of grain subdivision during deformation is fundamental to the process of grain refinement by SPD.
In addition to the deformation bands, other structural elements are introduced during strain local-ization that depend on the material being processed and on the deformation conditions. These have been called microbands of the first and subsequent generations, S-bands, microshear bands, etc.
[49,187]. The formation of such large misorientation dislocation boundaries is associated with differ-ences in the strain states across the boundaries[49]. Such strain-induced sub-boundaries are, there-fore, referred to collectively as geometrically-necessary boundaries. This is in contrast to incidental boundaries, which are essentially low-angle boundaries consisting of statistically stored dislocations. During a unidirectional deformation process such as cold rolling, an increase in the total strain leads to the formation of layered microstructures and the alignment of the transition bands, grain boundaries and sub-boundaries. This has the result that the normals to the flattened units are rotated until they are approximately parallel to the normal direction of rolling. Thus, the microstructures present at large strains are characterized by ribbon-like subgrains and grains that are highly elongated in the direction of metal flow[168,185].
The normal dimensions of the elongated structural elements decrease with increasing strain and gradually approach some constant value at large strains. These directional features of the microstruc-ture have been observed and described in detail for such SPD methods as ECAP, HPT, and ARB. The employment of these techniques has shown that uniform microstructures composed of equiaxed grains well below a micrometer in diameter can be readily produced in this way[30,168–170]. The most impressive grain refinement results have been obtained using the HPT technique
[172,189,190]. Typical nanocrystalline structures developed using HPT methods are shown in
Fig. 26a[189]. The severely strained microstructure is composed of heavily misoriented nearly equi-axed crystallites ten to one hundred nanometers in diameter and characterized by large internal stres-ses estimated from the streaks in the diffraction data. Similar microstructures have only been observed after high energy mechanical milling, as seen inFig. 26b[191].
The mechanical behavior during SPD is usually evaluated by measuring the hardness of samples processed to various total strains. This is because the most frequently used SPD me
![Fig. 10. Three types of dDRX grains and corresponding TEM micrographs [17]. Three types of dislocation density distribution develop in the microstructure: (a) a dDRX nucleus, (b) a growing dDRX grain, and (c) a critically strain hardened dDRX grain.](https://thumb-us.123doks.com/thumbv2/123dok_us/909057.2617203/12.701.139.568.393.849/corresponding-micrographs-dislocation-density-distribution-microstructure-critically-hardened.webp)
![Fig. 17. (a) Torsion flow curves determined on a plain C steel at 900 °C [84]. The last six passes, which collectively exhibit the characteristics of dDRX, make up the finishing schedule](https://thumb-us.123doks.com/thumbv2/123dok_us/909057.2617203/18.701.112.597.96.352/torsion-curves-determined-collectively-exhibit-characteristics-finishing-schedule.webp)
![Fig. 19. (a) Simulations of plate (30 s interpass times) and strip (1 s and 3 s interpass times) rolling [95]](https://thumb-us.123doks.com/thumbv2/123dok_us/909057.2617203/19.701.105.586.96.382/simulations-plate-interpass-times-strip-interpass-times-rolling.webp)