Prediction of Voltage Collapse in Electrical Power System Networks using a
New Voltage Stability Index
Isaac A. Samuel1#, James Katende2, Claudius O. A. Awosope1 and Ayokunle A. Awelewa1
1 Department of Electrical and Information Engineering, college of Engineering, Covenant University, Canaan land,
P.M.B 1023, Ota, Ogun State, Nigeria. E-mail: [email protected]
2 College of Engineering and Technology, Botswana International University of Science and Technology, Palapye, Botswana.
#ORCID 0000-0001-8010-4835
Abstract
The numerous power system blackouts in the past decade and in recent times attest to the fact that more work still needs to be done to tackle the problem of voltage instability and the resultant voltage collapse. This research work proposes a new line stability index that is suitable for the prediction of voltage collapse in Power System Networks (PSNs). This index code-named the New Line Stability Index-1 (NLSI_1) was obtained by deriving from first principles equivalent expressions for the Line Stability Index (Lmn) and the Fast Voltage Stability Index (FVSI) and combining them through a switching logic based on the voltage angle difference since it can signal the imminence of voltage collapse. This new index (NLSI_1) was tested on the IEEE 14-bus system and it gives the same results as the other indices (Lmn and FVSI). For the base case, the IEEE 14-bus test system was found to be stable with all the three indices having approximately equal values (< 1) for all the lines. The contingency case reveals that bus 14 ranks as the weakest bus in the system with the smallest maximum permissible reactive load of 74.6 Mvar and the critical line with respect to bus 14, is the line connecting bus 13 to bus 14. The values of the three indices, Lmn, FVSI and NSLI_1, are approximately equal thereby further validating the accuracy of the new line stability index-1 (NLSI_1).
Keywords: voltage stability, voltage stability indices, new line stability index, voltage collapse, Lmn, FVSI, NSLI_1;
INTRODUCTION
In recent years, following the unbundling and privatization of power system networks, their management has become increasingly more challenging in the face of systems being operated close to their security limits due increasing load demand coupled with restricted expansion due to economic and environmental constraints and increasingly longer transmission lines[1], [2]. The number of system blackouts in the past decade attests to the fact that more work still needs to be done to tackle the problem of voltage instability and the resultant voltage collapse. A power system network is expected to remains in equilibrium state under normal conditions and it required that it react to restore the status of the system to acceptable conditions after a disturbance, i.e. the voltage after a disturbance is restored to a value close to the pre-disturbance situation.
Voltage instability in Power System Network (PSN) occurs when a disturbance on the network causes a gradual and uncontrollable decline in voltage[3]. Contingencies such as line or generator outage due to faults, sudden increase in load, external factors, or improper operation of voltage control devices are the causes of voltage instability [4]. Voltage instability can also surface where there is an incongruity between supply and demand of reactive power, that is, inability of the system to meet the reactive power requirements. If measures are not taken to check this voltage instability, it will leads to a decrease in system voltage and consequently voltage collapse resulting in a partial or total system blackout. This jeopardizes the essential service of delivering uninterrupted and reliable power supply to consumer [5], [6].
Voltage stability as defined by B. Kundur is “the ability of a power system to maintain steady and acceptable voltages at all buses in the system at normal operating conditions and after being subjected to a disturbance” [7] [8].
In real-time PSN operation, it is very important that voltage stability analysis is carried out and a stability index used to monitor the voltage stability proximity to collapse and to predict the eminent danger of collapse early enough. This is with a view to alerting system operators so that necessary action could be taken to avoid voltage collapse since it is highly catastrophic anytime it occurs. Some instances of power system collapse experienced in recent times across the world have been reported in Kundu, 1994; Onohaebi, 2009; Ali, 2005; Anyanwu, 2005; Kundur et al., 2004 and Taylor, 1994. [7], [9], [10] and [11] and [12]
VOLTAGE COLLAPSE INCIDENCES
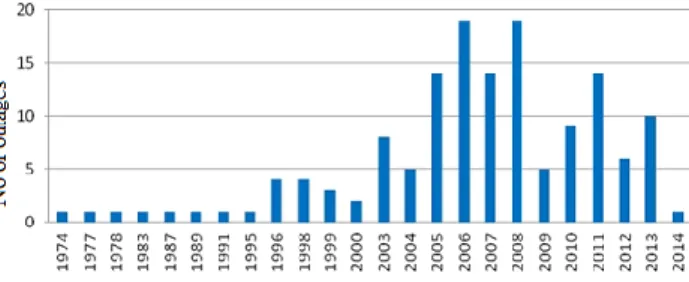
A voltage collapse incidence may be the resultant effect of voltage instability in a PSN. Voltage instability is the process by which the voltage falls to a very low value as a result of series of events. In [12] several voltage collapses across the world were reported and among this incidences that have drawn much attention includes the ones of Belgium (Aug 1982), Sweden (Dec. 1983), Tokyo (July1987), Tennessee (Aug. 1987) and Hydro Quebec (March 1989). The high number of blackouts caused by voltage instability shows how important this phenomenon is to power system network [8]. The bar chart of Figure 1 shows the total number of collapses
throughout the world and it also shows their growth and the increasing trend.
Figure 1: Worldwide voltage collapse up to February 2014 [14].
The blackouts that occur in the United States (U.S.) and in Canada on the 14th of August, 2003 have proven to be the
most severe and significant[13]. It was reported that during the blackout, about 50 million people were affected in eight states of the United States and two Canadian provinces. Approximately, 63 GW of load was lost, which is about 11 % of the total load. Also, in Southern Sweden, a major system collapse took place on 23rd of September, 2003, and impacted
up to 2.4 million customers[14]. Some other major blackouts began when a tree flashover caused the tripping of a major tie-line between Italy and Switzerland [15]. Research work in this area is aimed at predicting voltage collapse with a view to reducing its occurrence on PSNs
VOLTAGE STABILITY INDICES – A REVIEW
In view of the fact that voltage stability, to a very large extent, has to do with system load and transmission line parameters, voltage indices that reveal how close each transmission line is to voltage instability have increasingly become essential tools for voltage stability monitoring by power system operators. These indices may be used for online or offline monitoring of the PSN in order to predict proximity to voltage instability or collapse.
The monitoring of voltage stability for a power grid is an onerous function for the grid operator, hence the use of indices to determine and/or predict the system voltage stability state. These indices are scalar quantities that are observed as system parameters change. The operators use these indices to know when the system is close to voltage collapse and take corrective measures to avert the collapse thereby sustaining the continuous supply to consumers and to know the vulnerable line with respect to a bus for location of possible compensation devices to mitigate voltage instability (Chayapathi, Sharath, & Anitha, 20. [16]
i. Line Stability Index (Lmn)
The Line Stability Index (Lmn) is derived based on power transmission line concepts. Moghavvemi and Omar (1998) derived this line stability index to evaluate the stability of the line between two buses in an inter-connected system reduced to a single-line network as shown in Figure 2.
2 r V 1 s V s s s P jQ S Sr PrjQr 12 I 2 r V 1 s V s s s P jQ S Sr PrjQr 12 I
1
2
Figure 2: Typical one-line diagram of transmission line. where
Vs, Ps and Qs are respectively the sending-end voltage, real power and reactive power. Vr, Pr and Qr are respectively the receiving-end voltage, real power and reactive power. 1 is the sending-end voltage phase angle and
2 is the receiving-end voltage phase angle, I12 is the line
current.
The power flow through a transmission line using п (Pie) model representation for a two-bus system is used and the discriminant of the voltage quadratic equation is set to be greater than or equal to 0 (zero). If the discriminant is less than 0 (zero), the roots will be imaginary suggesting that there is instability in the system. The expression for the index is given as
𝐿𝑚𝑛 = 4𝑋𝑄𝑟
|𝑉𝑠| 2𝑆𝑖𝑛 2(𝜃− )≤ 1 (1)
where 𝜃 is the transmission line angle.
The line index is also directly related to the reactive power and indirectly related to the active power through the voltage phase angle . A line in the system is said to be close to instability when the Lmn is close to one (1). On the other hand, if the Lmn value is less than 1, then the system is said to be stable [17].
ii. Fast Voltage Stability Index (FVSI)
This index, proposed by Musirin (2002), is also based on the concept of power flow through a single line [18] as shown in Figure 2. It was developed based on the measurements of voltage and reactive power. FVSI is a line index derived from the general equation for the current in a line between two buses, labeled ‘s’ and ‘r’. Its mathematical expression is given as
FVSI = 4𝑍2𝑄𝑟
𝑉𝑠2 𝑋 ≤ 1 (2) where Z is the line impedance, X is the line reactance, Qr is the reactive power flow to the receiving end
and Vs is the sending-end voltage. The line whose stability index value closest to one (1) will be the most critical line connected to bus and may lead to the whole system instability [19], [20]. The evaluated FVSI also helps to determine the weakest bus in the system.
iii. Line Stability Factor (LQP)
The LQP index derived by Mohamed et al., (1989) [21] is obtained using the same concept as in [17] and [20] in which the discriminant of the power quadratic equation is set to be greater than or equal to zero. Figure 2 illustrates a single line
of a power transmission concept used in the derivation of the index. The line stability factor for this model is reproduced as
s r s sQ
p
V
X
V
X
LQP
4
2 2 (.3)where X is the line reactance, Qr is the reactive power flow to the receiving bus, Vs is the voltage at the
sending bus and Ps is the active power flow from the
sending bus.
For stable system, the value of LQP index should be maintained at less than 1, otherwise, collapse is imminent [21].
iv. Line Voltage Stability Index (LVSI)
This index is a line voltage stability index that brings to bear the relationship between line real power and the bus voltage [22]. The index fails if the resistance of the transmission line is very close to zero. The index is formulated as
1
cos
4
s rV
RP
LVSI
(4) where 𝜃 = 𝑇𝑎𝑛−1 𝑋𝑅 is the transmission line angle and R is line resistance.
LVSI is more sensitive to since cos(θ-) is faster than
sin(θ-) around 900 and a healthy line could be identified as a
critical line [23] .
v. Voltage Collapse Point Indicator (VCPI)
The VCPI uses maximum power transfer concept to investigate the stability of each line of the PSN. The expressions for the indices are stated as follows:
max
)
(
R RP
P
power
VCPI
(5) (max))
(
Losses LossesP
P
Losses
VCPI
(6)where PR is the power at the receiving end and Plosses is the
power loss.
As the transmission line experiences increase in power flow transfer, the value of each of the indices in equations (5) and (6) increases gradually and if it reaches 1, the voltage collapse occurs and if the index of any line in the PSN reaches that value, it is possible to predict the voltage collapse. The VCPI indices vary from zero (0) no-load condition to one (1), which is voltage collapse [24].
THE PROPOSED NEW LINE STABILITY INDEX-1 (NLSI_1)
The New Line Stability Index (NLSI-1) is hereby proposed for PSNs to monitor voltage stability conditions and/or for voltage collapse prediction. To derive the mathematical formulation for NLSI-1, we first derive the Line Stability
Index (Lmn) [17] and the Fast Voltage Stability Index (FVSI) [20] and combine them based on a consideration that the FVSI is an approximation of the Lmn under voltage angle conditions so that the NLSI-1 takes advantages of improved prediction accuracy and speed.
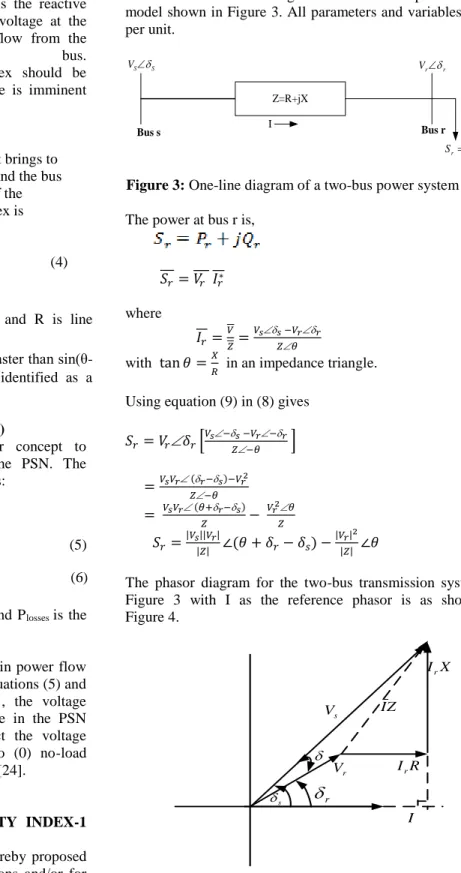
Consider the one-line diagram of a two-bus power system model shown in Figure 3. All parameters and variables are in per unit. Z=R+jX I Bus s Bus r S S V Vrr r r r P jQ S
Figure 3: One-line diagram of a two-bus power system model The power at bus r is,
(7) 𝑆𝑟= 𝑉𝑟 𝐼𝑟∗ (8) where 𝐼𝑟=𝑉𝑍=𝑉𝑠𝑍𝑠 −𝑉𝜃𝑟𝑟 (9) with tan 𝜃 =𝑋 𝑅 in an impedance triangle. Using equation (9) in (8) gives
𝑆𝑟= 𝑉𝑟𝛿𝑟[𝑉𝑠−𝑍𝑠 −𝑉−𝜃𝑟−𝑟 ] =𝑉𝑠𝑉𝑟 (𝑟−𝑠)−𝑉𝑟2 𝑍−𝜃 = 𝑉𝑠𝑉𝑟 (𝜃+𝑟−𝑠) 𝑍 − 𝑉𝑟2𝜃 𝑍 𝑆𝑟=|𝑉𝑠|𝑍|||𝑉𝑟|∠(𝜃 + 𝛿𝑟− 𝛿𝑠) −|𝑉𝑟| 2 |𝑍| ∠𝜃 (10)
The phasor diagram for the two-bus transmission system of Figure 3 with I as the reference phasor is as shown in Figure 4. r V I s
r Z I X Ir s V R IrFigure 4: The phasor diagram for the two-bus transmission system.
Expressing 𝑆𝑟in terms of its real and imaginary parts, then equation (10) becomes 𝑆𝑟=|𝑉𝑠|𝑍|||𝑉𝑟|𝑐𝑜𝑠(𝜃 + 𝛿𝑟− 𝛿𝑠) + 𝑗|𝑉𝑠|𝑍|||𝑉𝑟|sin(𝜃 + 𝛿𝑟− 𝛿𝑠) −|𝑉𝑟| 2 |𝑍| cos 𝜃 + 𝑗 |𝑉𝑟|2 |𝑍| sin 𝜃 (11)
Rearranging equation (11) gives
𝑆𝑟=|𝑉𝑠|𝑍|||𝑉𝑟|𝑐𝑜𝑠(𝜃 + 𝛿𝑟− 𝛿𝑠) −|𝑉𝑟| 2 |𝑍| cos 𝜃 + 𝑗 ( |𝑉𝑠||𝑉𝑟| |𝑍| sin(𝜃 + 𝛿𝑟− 𝛿𝑠) − |𝑉𝑟|2 |𝑍| sin 𝜃) (12) But 𝑆𝑟= 𝑃𝑟+ 𝑗𝑄𝑟
Then equating real and imaginary parts on both sides, gives
𝑃𝑟=|𝑉𝑠||𝑉𝑟 | |𝑍| 𝑐𝑜𝑠(𝜃 − 𝛿𝑠+ 𝛿𝑟) − |𝑉𝑟|2 |𝑍| cos 𝜃 (13) 𝑄𝑟=|𝑉𝑠|𝑍|||𝑉𝑟|sin(𝜃 − 𝛿𝑠+ 𝛿𝑟) −|𝑉𝑟| 2 |𝑍| sin 𝜃 (14)
Substituting 𝛿 = 𝛿𝑟− 𝛿𝑠 and finding a quadratic equation in terms of 𝑄𝑟 in (14) gives |𝑉𝑟|2
|𝑍| sin 𝜃 − |𝑉𝑠||𝑉𝑟|
|𝑍| sin(𝜃 − 𝛿) + 𝑄𝑟= 0 (15)
Therefore, the voltage quadratic equation is given as sin 𝜃
|𝑍| 𝑉𝑟 2− |𝑉
𝑟||𝑉𝑠| sin(𝜃−𝛿)|𝑍| + 𝑄𝑟= 0 (16)
Equation (16) is a quadratic equation. Therefore, solving for Vr gives
𝑉𝑟= |𝑉𝑠| sin(𝜃−𝛿) |𝑍| ±√((|𝑉𝑠| sin(𝜃−𝛿))|𝑍| ) 2 −4sin 𝜃|𝑍|𝑄𝑟 2sin 𝜃|𝑍| (17)
For stability, the discriminant of equation (17) should be greater than or equal to zero i.e.
(|𝑉𝑠|2sin2(𝜃−𝛿))
|𝑍|2 − 4
sin 𝜃
|𝑍| 𝑄𝑟≥ 0 (18)
Multiplying both sides with |𝑍|2, we have
𝑉𝑠2𝑠𝑖𝑛2(𝜃 − 𝛿) − 4𝑍𝑠𝑖𝑛𝜃 𝑄𝑟 ≥ 0 (19) But the reactance, 𝑋 from the relevant impedance triangle is given as
𝑋 = |𝑍|𝑠𝑖𝑛 𝜃 Substituting 𝑋 into equation (18) gives
𝑉𝑠2𝑠𝑖𝑛2(𝜃 − 𝛿) − 4𝑋𝑄𝑟 ≥ 0 (20)
Dividing both sides by |𝑉𝑠| 2𝑠𝑖𝑛 2(𝜃 − ), then equation (20) becomes
1 − 4𝑋𝑄𝑟
𝑉𝑠2𝑠𝑖𝑛2(𝜃−𝛿) 0 (21)
Therefore, for voltage stability we require that 4𝑋𝑄𝑟
|𝑉𝑠| 2𝑠𝑖𝑛 2(𝜃− )≤ 1 (22)
From equation (22) when δ ≈0, it can be inferred that 4𝑋𝑄𝑟
From the impedance triangle𝑋 = |𝑍|𝑠𝑖𝑛 𝜃 which implies: 𝑠𝑖𝑛𝜃 = 𝑋
|𝑍|. (23)
Substituting equation (23) into equation (22) and simplifying, yields an expression for voltage stability with negligibly small values of δ:
4𝑄𝑟(|𝑍|)2
|𝑉𝑠|2𝑋 ≤ 1 (24)
It is therefore proposed to combine equations (22) and (24) into a single equation to compute the proximity to voltage collapse according to a switching function, σ, as shown in equation (25). Each value of voltage angle, δ, computed from the load-flow program is tested against a threshold value, 𝛿𝑐, in order to determine whether σ is 1 or 0 according to the switching logic in equation (25).
Thus the NLSI_1 is given as:
𝑵𝑳𝑺𝑰𝟏=|𝑽𝟒𝑸𝒓 𝒔|𝟐[ (|𝒁|)𝟐 𝑿 𝛔 − 𝑿 𝐬𝐢𝐧𝟐(𝜽 − 𝜹)(𝛔 − 𝟏)] ≤ 𝟏 𝛔 = {𝟏 𝟎 𝜹 < 𝜹𝒄 𝜹 ≥ 𝜹𝒄 (25)
where ‘σ’ is a switching function whose value depends on whether the angle difference, δ, is very small or not. A large voltage angle difference between two load buses indicates a heavily loaded power system network with large power flows or increased impedance between the load buses. Ian Dobson, et al., [2010] reported that in a simulation of the grid carried out before the August 2003, Northeastern blackout showed increasing angle differences between Cleveland and West Michigan, revealing that large angle differences could be a risk signal to the occurrence of blackout or system collapse [25]. Therefore, the voltage angle difference, delta ‘’ cannot be totally ignored as assumed in the FVSI. When NLSI-1 is less than 1, the voltage is stable. The closer its value approaches one (1), the nearer the voltage is to collapse.
The switching function σ, is dependent on the voltage angle difference, . Therefore, to determine the point at which switching will take place, a study of the error percentage of the voltage stability indices with reference to the voltage angle difference, is considered. The base case results of the Lmn and FVSI are used. The error percentage is considered using the two techniques of specifying errors i.e. the absolute error of an approximation and the relative error of the approximation. The absolute error gives how large the error is, and the relative error gives how large the error is relative to the correct value [26].
The Lmn is taken as the base value. It is considered to be the true representation of the voltage stability index and the most accurate among them while the FVSI is an approximation of Lmn. It is important to note that the switching point is unique
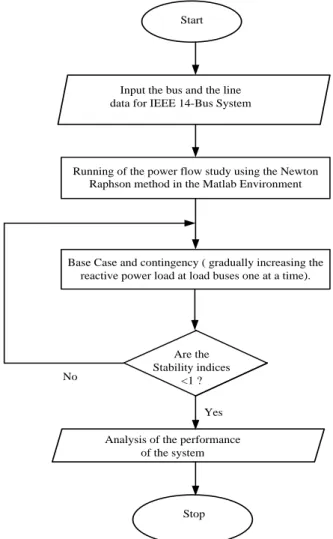
to individual power system networks. Figure 5 shows the flow chart for calculating the voltage stability indices being considered in this work.
Running of the power flow study using the Newton Raphson method in the Matlab Environment
Base Case and contingency ( gradually increasing the reactive power load at load buses one at a time).
No
Yes Are the Stability indices
<1 ?
Analysis of the performance of the system
Stop Start
Input the bus and the line data for IEEE 14-Bus System
Figure 5: Steps for calculating the voltage stability indices
RESULTS AND DISCUSSIONS
The new line stability index-1 (NLSI_1) combines two existing voltage stability indices: the Lmn and FVSI taking advantage of the accuracy of the Lmn index and the fastness of the FVSI index. In order to validate this new line stability index-1 (NLSI_1), it was used together with the Lmn and the FVSI to investigate the voltage stability of the IEEE 14-bus test system.
The IEEE 14-bus test system has 5 generator buses (PV), 9 load buses (PQ) and 20 interconnected lines or branches. Out of the generator buses, bus 1 is selected as the slack bus [27]. Figure 6 shows the single-line diagram of the system. The bus and line data used for the power flow analysis are as presented.
Figure 6: Single-line diagram of the IEEE 14-Bus System [27]
Simulation Results for IEEE 14-Bus System using line Indices :
The switching function σ was determined using the index Lmn which is more accurate than the FVSI index, as the base value for the determination of the percentage error. The switching function σ, chosen has percentage error of 2.384 corresponding to angle difference, , of 1.422 degree. The idea is to switch to Lmn index when voltage angle difference,
is greater than 1.422 degrees and then switch to FVSI when it is less than 1.422 degrees.
The simulation result for both scenarios: the base case and the contingency are here discussed.
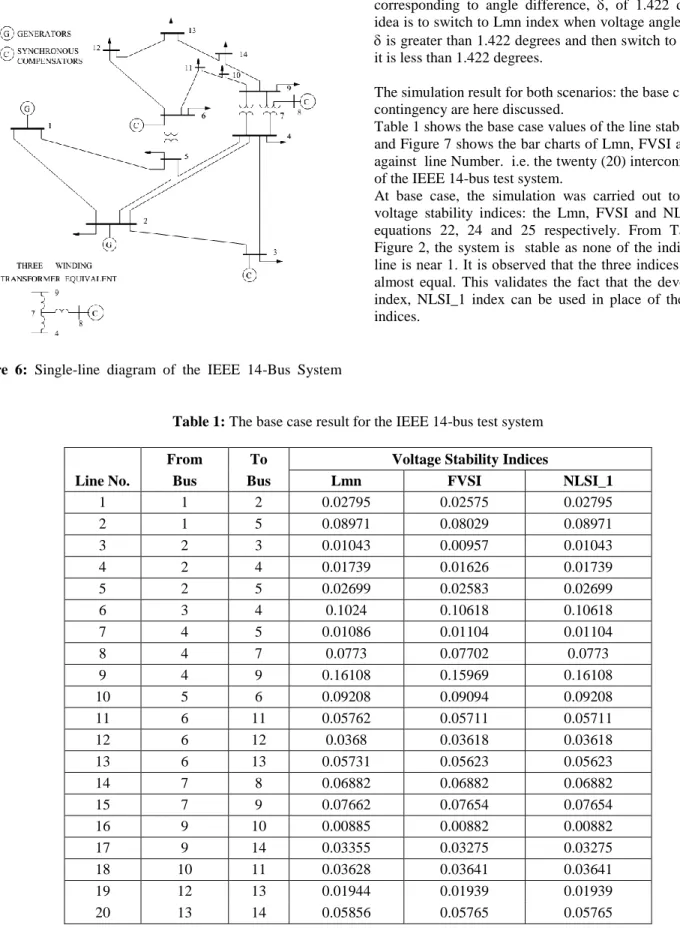
Table 1 shows the base case values of the line stability indices and Figure 7 shows the bar charts of Lmn, FVSI and NLSI_1 against line Number. i.e. the twenty (20) interconnected lines of the IEEE 14-bus test system.
At base case, the simulation was carried out to obtain the voltage stability indices: the Lmn, FVSI and NLSI_1 using equations 22, 24 and 25 respectively. From Table 1 and Figure 2, the system is stable as none of the indices of each line is near 1. It is observed that the three indices’ values are almost equal. This validates the fact that the developed new index, NLSI_1 index can be used in place of the other two indices.
Table 1: The base case result for the IEEE 14-bus test system
From To Voltage Stability Indices
Line No. Bus Bus Lmn FVSI NLSI_1
1 1 2 0.02795 0.02575 0.02795 2 1 5 0.08971 0.08029 0.08971 3 2 3 0.01043 0.00957 0.01043 4 2 4 0.01739 0.01626 0.01739 5 2 5 0.02699 0.02583 0.02699 6 3 4 0.1024 0.10618 0.10618 7 4 5 0.01086 0.01104 0.01104 8 4 7 0.0773 0.07702 0.0773 9 4 9 0.16108 0.15969 0.16108 10 5 6 0.09208 0.09094 0.09208 11 6 11 0.05762 0.05711 0.05711 12 6 12 0.0368 0.03618 0.03618 13 6 13 0.05731 0.05623 0.05623 14 7 8 0.06882 0.06882 0.06882 15 7 9 0.07662 0.07654 0.07654 16 9 10 0.00885 0.00882 0.00882 17 9 14 0.03355 0.03275 0.03275 18 10 11 0.03628 0.03641 0.03641 19 12 13 0.01944 0.01939 0.01939 20 13 14 0.05856 0.05765 0.05765
Figure 7: The bar chart of Lmn, FVSI and NLSI_1 Vs Line Number for the base case. The simulation of the contingency case considered, is the
variation of the reactive power demand. This reveals that load bus 14 is the weakest and most vulnerable bus since it has the lowest maximum permissible reactive load of 74.6MVAr as shown in Figure 8. This bus has two (2) lines connected to it and the critical line with respect to load bus 14 is the line
13-14. This implies that any addition of reactive load will lead to voltage collapse on the system. Bus 4 has the highest maximum load-ability and permissible reactive load of about 361MVAr.
Figure 8: Maximum reactive load (Q MVAr) on load buses.
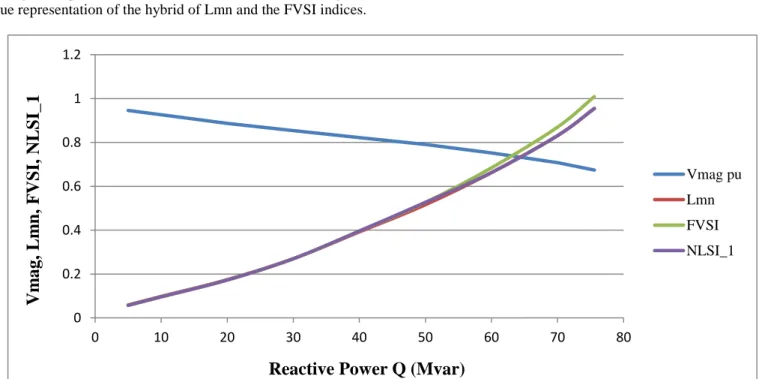
The reactive power variation on bus 14 was carried out to investigate the indices with reactive load and the voltage characteristics. The results of this simulation are as presented in Table 2 while Figure 9 shows the graph of voltage
magnitude and voltage stability indices (Lmn, FVSI and NLSI_1) against the reactive power Q (MVAr) variation for bus 14. It’s worthy to note that the graphs of Lmn and NLSI_1 coincide, this gives credence to the new index, NLSI_1 also
0 0.02 0.04 0.06 0.08 0.1 0.12 0.14 0.16 0.18 1 2 3 4 5 6 7 8 9 10 11 12 13 14 15 16 17 18 19 20
L
m
n
/F
VS
I/
NL
S
I_1
Line No
. Lmn FVSI NLSI_1 0 50 100 150 200 250 300 350 400 4 5 7 9 10 11 12 13 14M
axim
u
m
r
eac
tive
L
oad
(M
var
)
Bus No
for determining the maximum load-ability of the load buses. This will consequently guide the operator to take quick action to avert the voltage collapse when a particular bus is being
overloaded and where to place compensation devices is so revealed.
Table 2: Reactive power variations on bus 14. Bus 14 -1st weakest bus (13-14)
Q MVAr Vmag pu Lmn FVSI NLSI_1
5 0.946 0.05856 0.05765 0.05765 10 0.926 0.09758 0.09637 0.09637 20 0.887 0.17392 0.17287 0.17287 30 0.854 0.26946 0.26996 0.26996 40 0.822 0.39171 0.39623 0.39623 50 0.791 0.51545 0.52666 0.52666 60 0.752 0.66223 0.68451 0.66223 70 0.708 0.83048 0.86982 0.83048 75.6 0.674 0.95474 1.00942 0.95474
From Figure 9, for load bus 14, it is observed that the curve of the voltage magnitude drops as the reactive power is increased while the voltage stability indices value also increase till voltage collapse occurs. The NLSI_1, as could be seen, gives true representation of the hybrid of Lmn and the FVSI indices.
This result for the IEEE 14 bus system validates the accuracy of the new line stability index-1 (NLSI_1) as compared with the others found in the literatures [28].
Figure 9: The graph of load variation on Bus 14
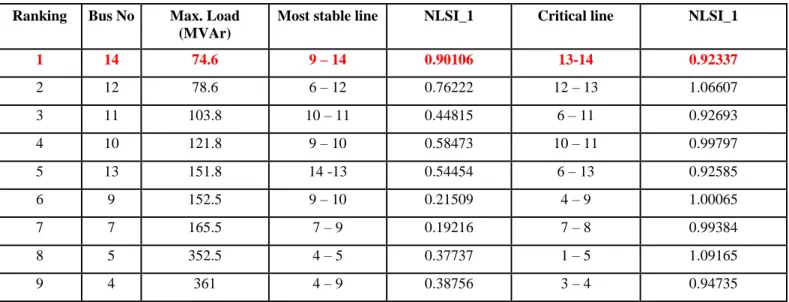
The maximum load-ability of each load bus, the most critical line and most stable line with respect to a particular load bus are identified and tabulated as shown in Table 3. The most stable lines are lines with the least voltage stability indices while the critical lines are the lines with the highest values of
the voltage stability indices with respect to individual load buses. Table 3 shows The IEEE 14-Bus system ranking of the load buses as most stable and critical line as connected to each load buses. 0 0.2 0.4 0.6 0.8 1 1.2 0 10 20 30 40 50 60 70 80
Vm
ag,
L
m
n
,
F
VSI,
NLS
I_1
Reactive Power Q (Mvar)
Vmag pu Lmn FVSI NLSI_1
Table 3: IEEE 14-Bus system load bus most stable and critical line Ranking Bus No Max. Load
(MVAr)
Most stable line NLSI_1 Critical line NLSI_1
1 14 74.6 9 – 14 0.90106 13-14 0.92337 2 12 78.6 6 – 12 0.76222 12 – 13 1.06607 3 11 103.8 10 – 11 0.44815 6 – 11 0.92693 4 10 121.8 9 – 10 0.58473 10 – 11 0.99797 5 13 151.8 14 -13 0.54454 6 – 13 0.92585 6 9 152.5 9 – 10 0.21509 4 – 9 1.00065 7 7 165.5 7 – 9 0.19216 7 – 8 0.99384 8 5 352.5 4 – 5 0.37737 1 – 5 1.09165 9 4 361 4 – 9 0.38756 3 – 4 0.94735 CONCLUSION
The new line stability index-1 (NLSI_1) combines two existing voltage stability indices: the Lmn and FVSI taking advantage of the accuracy of the Lmn index and the fastness of the FVSI index. In order to validate this new line stability index-1 (NLSI_1), it was used together with the Lmn and the FVSI to investigate the voltage stability of the IEEE 14-bus system for two possible situations: the base case and the contingency analysis i.e. the variation of reactive load on load buses one at a time.
The simulations for the IEEE 14- bus test system revealed that for the base case, the system is stable because the three indices’ values are approximately equal and are far less than one (1). For the contingency case, bus 14 was revealed to be the weakest bus as the indices’ values are very close to one (1). This implies proximity to voltage collapse and it has the smallest maximum reactive loading of 74.6MVAr. This means that bus 14 is the optimal location for placement of a compensating device for improving the voltage profile at that bus as a measure against voltage collapse. Line 13-14 is the critical line of the system as the three stability indices’ values of this line are very close to one (1) and are almost equal. These results show that the new line stability index (NLSI_1) developed is valid and accurate since the result tallies with those obtained for the IEEE 14-bus test system in the technical literatures [29], [30].
ACKNOWLEDGEMENT
The authors acknowledge the financial support for the publication of this paper received from Covenant University, Ota. Ogun State, Nigeria.
REFERENCE
[1] Manohar, R.; Siva, S., Gowri, T. (2012, 29th March). Literature review on voltage stability phenomenon and importance of FACTS controllers in power system
environment. Global Journal of Rresearches in Engineering- Electrical and Electronics Engineering, 12(3), pp, 25-29.
[2] Hasani, M., & Parniani, M. (2005). Method of Combined Static and Dynamic Analysis of Voltage Collapse in Voltage Stability Assessment. 2005 IEEE/PES Transmission and Distribution Conference & Exhibition: Asia and Pacific (pp. 1-6). Dalian, China: IEEE.
[3] Sarat K. S., Suresh S. R. & Jayaram Kumar S.V. (Dec.2012). New Voltage Stability Index (NVSI) for Voltage Stability Analysis in Power System. International Journal of Electrical and Electronics Engineering Research (IJEEER), 2(4), 13-20.
[4] Samuel, I., Katende, J., Daramola, A., & Awelewa, A. (2014, April). Review of System Collapse Incidences on the 330-KV Nigerian National Grid. International Journal ofEngineering Science Invention, 3(4), PP.55-59.
[5] Veleba, J., & Nestorovic, T. (2013). Performance of Static Voltage Stability Analysis in MATLAB Environment with Further Applications. International journal of education and information technologies, 4(7).
[6] Pouyan P., Kundur P. and Carson W. T. The Anatomy of a Power Grid Blackout. IEEE Power Energy Magazine, September/October 2006.
[7] Kundur, P. (1994). Power System Stability and Control. McGraw Hill.
[8] Kundur, P., Paserba, J., Ajjarapu, V., Andersson, G., Bose, A., Canizares, C., et al. (2004, August). Definition and classification of power system stability IEEE/CIGRE joint task force on stability terms and definitions. Power Systems, IEEE Transactions, 19(3), pp.1387-1401,.
[9] Onohaebi, O. (2009.). Power Outage in the Nigeria Transmission Grid. Research Journal of Applied Sciences, 4(1), 1-9.
[10] Ali, N. A. (2005). An Overview of System Collapses on the Nigerian Grid Network. Proceedings of the International Conference on Power Systems Operations and Plaing-VI(ICPSOP) (pp. 67-70.). Universidade Jean Piaget, Praia, SA.
[11] Anyanwu, C. A. (2005). State of Power System Operation and Planning the Nigerian Power System. Proceedings of the International Conference on Power Systems Operations and Planning-VI (ICPSOP) (pp. 103-108). Universidade Jean Piaget, Praia, SA.
[12] Taylor, C. W. (1994). Power System Voltage Stability. New York: McGraw-Hill.
[13] Andersson, G., Donalek, P., Farmer, R., Hatziargyriou, N., Kamwa, I., Kundur, P., et al. (November,2005,). Causes of the 2003 Major Grid Blackouts in NorthAmerica and Europe, and Recommended Meansto Improve System Dynamic Performance. IEEE Transactions On Power Systems, 20(04), 1922-1928.
[14] Pourbeik, P., Kundur, P. S., & Taylor, C. W. (2006).
The anatomy of a power grid blackout. IEEE Power
and Energy Magazine, 4(5), 22-29.
[15] Goh, H. H., Chua, Q. S., Lee, S. W., Kok, B. C., Goh, K. C., K., T. K., et al. (2014). Line Voltage Stability
Indices Based on Precautionary
MeasureApproximation in Smart Grid. Proceedings of the 11th International Conference on Innovation & Management (pp. 1507-1518). Finland: the University of Vaasa.
[16] Chayapathi, V., Sharath, B., & Anitha, G. S. (2013,, September). Voltage collapse mitigation by reactive power comppensation at the load side. IJRET: International Journal of Research in Engineering and Technology, 2(9), 251-257.
[17] Moghavvemi, M., & Omar, F. M. (1998). Technique for contingency monitoring and voltage collapse prediction. IEEE Proceeding on Generation, Transmission and Distribution,. 145, pp. 634-640. IEEE.
[18] Merlyn Mathew, D. Suresh Babu, P.S.Venkataramu and M.S.Nagaraj. (2015, Vol. 3, Issue 8, August ). Effect of TCSC on Line Voltage Stability Indices under Single Line Outage Condition. International Journal Of Innovative Research in Electrical, Electronics, Instrumentation and Control Engineering, 3(8), 101-105.
[19] Verayiah R., M. A. (2013). Performance Comparison of Voltage Stability Indices for Weak Bus Identification in Power Systems. 4th International Conference on Energy and Environment 2013 (ICEE 2013) (pp. 1-5). IOP Publishing.
[20] Musirin, I., & Rahman, T. (2002). Novel Fast Voltage Stability Index (FVSI) for Voltage Stability Analysis in Power Transmission System. Student Conference on Research and Development Proceedings,. Shah Alam, Malasia.
[21] Mohamed, A. G. (1998). A Static Voltage Collapse Iindicator Using Line Stability Factors. Journal of industrial technology, 7(1), p p. 73-85.
[22] Suganyadevi, M. V., & Babalal, C. k. (2009). Estimating of loadability magine of a power system by comparing voltage stability indices. International conference on control, automation, communication and energy conservation
[23] Musa, H. (2015). An overview on voltage stability indices as indicators of voltage stability for networks with distributed generations penetration. International journal of science, technology and society., 3(4), 214-219.
[24] Goh, H. H., Chua, Q. S., Lee, S. W., Kok, B. C., Goh, K. C., K., T. K., et al. (2015, Feburary 11-12). Comparative Study of Line Voltage Stability Indices for Voltage Collapse Forecasting in Power Transmission System. Rio de Janeiro Brazil, 13(2), 270-275.
[25] Dobson, I., Parashar, M., & Carter, C. (2010). Combining Phasor Measurements to Monitor Cutset Angles. 43rd Hawaii International Conference on System Sciences, January 2010 (pp. 1-10). IEEE. [26] Donna Roberts. (2012). Algebra lesson page.
Retrieved febrary 12, 2016, from Error in Measurement:
http://www.regentsprep.org/regents/math/algebra/am3/ LError.htm
[27] Kodsi, S. M., & Canizares, C. A. (2003). Modeling and simulation of IEEE 14 bus system with facts
controllers. University of Waterloo, Canada, Tech. Rep.
[28] Subramani, C., Subhransu Sekhar Dash, Vivek Kumar and Harish Kiran. (2012). Implementation of Line Stability Index for Contingency Analysis and Screening in Power Systems. Journal of Computer Science, pp, 585-590.
[29] Elfadil.Z. Yahia, Mustafa A. Elsherif, Mahmoud N. Zaggout. (2015, March). Detection of Proximity to Voltage Collapse by Using L– Index. International Journal of Innovative Research in Science, Engineering and Technology, 4(3), pp, 1755-1765.
[30] Bhawana Telang and Prabodh Khampariya. (2015, April). Voltage Stability Evaluation Using Modal Analysis. International Journal of Scientific Research Engineering & Technology (IJSRET), 4(4), 408-411.