The use of genetic diversity from emmer wheat to improve bread wheat
Rohayu Ma’arup
A thesis submitted in fulfilment of the requirements for the degree of Doctor of Philosophy
Faculty of Agriculture and Environment University of Sydney
i
Statement of Originality
This is to certify that to the best of my knowledge, the content of this thesis is my own work. This thesis has not been submitted for any degree or other purpose
ii
Acknowledgements
All praise is for Allah and thanks for his help and guidance to successfully accomplish this PhD study. My appreciation goes to University of Malaysia Terengganu, Malaysia for considering me to be their staff and High ministry of Education of Malaysia for offering me scholarship for the whole 3 years 6 months of my PhD study. My sincere gratitude to my main supervisor Prof. Peter Sharp, Director of the Plant Breeding Institute and associate supervisor Prof. Richard M. Trethowan, Director of the I. A. Watson Grains Research Centre, Plant Breeding Institute, Narrabri, University of Sydney for their assistance, encouragement, precious guidance, understanding and financial support (during my last semester) throughout my PhD study in The University of Sydney. Their useful discussions, ideas and advice for my 3 years research experiment and improvement of this thesis for the whole 10 months of writing period is much appreciated. Special thanks to my auxiliary supervisors, A/Prof. Harbans Bariana and Dr. Helen Bramley for their advice and guidance in rust resistance and physiology areas. I thank Generation Challenge Program (GCP) for partially supporting my genotyping service.
I thank Dr. Chong Mei for providing me advice and technical support in molecular work. I have great appreciation to all staff in the Plant Breeding Institute, Narrabri includes Ms Annette Tredrea, Mr Peter Bell, Mr Graeme Rapp, Dr. Angela Pattison, Dr. Philip Davies, A/Prof Richard Heath, Melissa Eather and other staff there who helped me directly or indirectly. I thank Sandra Saville and Kate Rudd for their special help during my settled down period in Cobbitty, advice and other administration support during my candidature. I equally grateful to Mr James Bell and all staff at PBI Cobbitty for their assistance during my research period. Special thanks to fellow students for being there, exchanging ideas and sharing knowledge. My deep appreciation to the whole of my family, especially my husband (Mohd Zulhelmi On) who supported me in so many ways, my parents (Ma’arup Marsan and Habibah Sakiran) for thought me to stay strong in any conditions and parents in law (On Jaafar and Khadijah Abdullah) who understand my situation here, my very cute baby girl (Aminah Batrisyia) who always cooperated with babysitter when I’m working, and not forget all my little girl babysitters (Siti Aqilah Sallehuddin, Fadhilah Razali, Almu Jahidah Abu Bakar and Nurul Hidayah Mohamed Azam) for your patience and dedication.
iii Synopsis
Drought can be defined by Cambridge Dictionary as long period with little or no rain. Australia is the seventh largest wheat producer in the world, but it is the driest inhabited continent from the viewpoint of continental rainfall and streamflow. So, genetic improvement through crossing high-yielding cultivars of bread wheat with cultivated emmer wheats (had gone through early screening), subsequently backcrossing with bread wheat to increase bread wheat characteristics and producing doubled haploid (DH) from BC1F1 is one possible solution for increasing the yield
stability of wheat in drought prone areas. The key point of this research study was to evaluate physiological and agronomic traits among the DH lines in optimum conditions for them to fully express their highest potential in 2013. Subsequently, selection was made among the DH lines for two years of trials under irrigated and rainfed conditions (to mimic drought) in 2014-2015 to evaluate genotypes that use water efficiently under drought stress. The relationship of physiology, phenology, and yield components in high water use efficiency genotypes revealed aspects of adaptation in northwestern NSW. The comparisons of bread wheat parents and their respective progenies (DH lines) were explored and diverse responses to soil water stress were observed. Biplot genotype main effect plus genotype by environment interaction (G+GE) of the multi-environment trials (METs) identified ideal genotypes that are stable cultivars across environment. These findings were also strengthened with GWAS analysis that revealed marker trait associations (MTAs) in water deficit conditions and were not observed under the irrigated environments. Such lines would allow farmers to maintain income during drought years, as well as increase their income during wet years. The outcomes from this study should be worthwhile to the wheat industries in Australia and India, as some of domesticated bread wheat parents used were commercial cultivars in India.
iv Table of Content Statement of Originality ... i Acknowledgements ... ii Synopsis ... iii List of Tables ... ix List of Figures ... xi
List of Appendices ... xvi
Abbreviations ... xx CHAPTER 1 ... 1 Introduction ... 1 CHAPTER 2 ... 4 Literature Review ... 4 2.1 Wheat ... 5 2.1.1 Importance of wheat ... 5
2.1.2 Genetic diversity in emmer wheat (Triticum dicoccon Schrank) Thell. . 6
2.2 Wheat cultivation in Australia ... 8
2.3 GGE biplot analysis ... 9
2.4 Drought ... 10
2.5 Plant adaptation to drought ... 11
2.5.1 Keeping the water balance right ... 12
2.5.2 Avoidance to drought ... 13
2.6 Water use efficiency ... 13
2.6.1 Gas exchange and water use efficiency ... 14
2.6.2 Chlorophyll content and water use efficiency ... 15
2.6.3 Canopy temperature and water use efficiency ... 16
2.6.4 Light interception and water use efficiency ... 17
2.6.5 Vegetation index and water use efficiency ... 18
2.6.6 Osmotic adjustment and water use efficiency ... 18
2.6.7 Early vigour and water use efficiency ... 19
2.6.8 Phenology and water use efficiency ... 19
2.6.9 Root depth and water use efficiency ... 20
2.7 Crop ideotype ... 21
v
CHAPTER 3 ... 24
Physiological basis of yield gains ... 24
3.1 Introduction ... 24
3.2 Materials and Methods ... 25
3.2.1 Germplasm used and history of the experimental material ... 25
3.2.2 Experimental site ... 26
3.2.3 Experimental Layout ... 26
3.2.4 Agronomic management of experiments ... 29
3.2.5 Physiological and agronomic measurement ... 31
a. Crop ground cover ... 31
b. Days to heading ... 31
c. Days to maturity ... 31
d. Normalized difference vegetative index (NDVI) ... 31
e. Plant height ... 32
f. Grain yield ... 32
g. Osmotic adjustment ... 32
h. Drought susceptible index (DSI) ... 32
i. Chlorophyll Content ... 33
j. Canopy temperature ... 33
k. Light interception (%) ... 34
l. Flag leaf length and width ... 34
m. Thousand grain weight ... 34
n. Screenings ... 34
o. Statistical analysis ... 34
p. Data captured each year ... 35
3.3 Results ... 36
3.3.1 Environment 1 (E1): irrigated (2013) ... 36
3.3.2 Environment 2 (E2): rainfed (2014) ... 41
3.3.3 Environment 3 (E3): irrigated (2014) ... 46
3.3.4 Environment 4 (E4): rainfed (2015) ... 51
3.3.5 Environment 5 (E5): irrigated (2015) ... 56
3.3.6 Paired environments (E2 and E3): 2014 ... 61
vi
a. The performance of the sixteen selected genotypes in 2015 ... 74
3.3.8 All five environments: 2013-2015 (200 genotypes in common across E1-E5)….. ... 80
3.3.9 Multiple regression analysis ... 81
3.3.10 GGE biplot analysis of yield stability ... 81
3.3.11 Drought Susceptible Index (DSI) ... 82
3.4. Discussion ... 91
3.4.1. Greenness area ... 91
3.4.2. Photosynthetic potential ... 92
3.4.3 Phenology and adaptation ... 92
3.4.4. Canopy temperature ... 93
3.4.5. Maintaining water balance under stress ... 93
3.4.6. Drought susceptibility index ... 94
3.5 Summary ... 94
CHAPTER 4 ... 95
Water use and water use efficiency ... 95
4.1 Introduction ... 95
4.2 Materials and Methods ... 96
4.2.1 Production of Doubled Haploids ... 96
a. Donor plants and growth conditions ... 96
b. Crosses and embryo rescue ... 96
c. Chromosome doubling ... 97
4.2.2 Irrigation and weather ... 97
4.2.3 Soil Moisture Content ... 98
4.2.4 Estimation of water use and water use efficiency ... 99
4.2.5 Crop measurements ... 101
4.2.6 Gas exchange measurement ... 101
4.2.7 Statistical analysis ... 101
4.3 Results ... 102
4.3.1 Weather differences (E1-E5) ... 102
4.3.2 Water availability ... 105
4.3.3 Combined 2014-2015 (200 genotypes in E2, E3, E4 and E5) analysis ………..109
vii
b. Contribution of emmer wheat in WUEGrain ... 109
4.3.4 Combined Gas Exchange Water Use Efficiency (E4-E5 for 16 selected genotypes) ... 110
4.4 Discussion ... 119
4.4.1 Grain water use efficiency ... 119
4.4.2 Water use efficiency at the leaf level ... 120
4.5 Summary ... 121
CHAPTER 5 ... 122
The influence of emmer wheat on bread making quality ... 122
5.1. Introduction ... 122
5.2 Materials and methods ... 123
5.2.1 Measurement of grain quality traits ... 123
5.2.2 Statistical analysis ... 123
5.3 Results ... 124
5.3.1 Environment 1 (E1): irrigated (2013) ... 124
5.3.2 Environment 2 (E2): rainfed (2014) ... 129
5.3.3 Environment 3 (E3): irrigated (2014) ... 133
5.3.4 Environment 4 (E4): rainfed (2015) ... 137
5.3.5 Environment 5 (E5): irrigated (2015) ... 140
5.3.6 Paired environments (E2 and E3): 2014 ... 143
5.3.7 Paired environments (E4 and E5): 2015 ... 145
5.3.8 All environments: 2013-2015 (200 genotypes in common across all environments E1-E5) ... 147
a. Contribution of emmer wheat to grain protein content ... 147
5.4 Discussion ... 154
5.5 Summary ... 155
CHAPTER 6 ... 156
Association analysis of multiple traits in METs ... 156
6.1 Introduction ... 156
6.2 Materials and methods ... 157
6.2.1 DNA extraction ... 158
6.2.2 Phenotypic data ... 159
6.2.3 SNP genotyping and molecular data analysis ... 159
viii
6.3 Results ... 162
6.3.1 GWAS of water use efficiency ... 162
6.3.2 Stability of markers in GWAS for year effect: 2013, 2014 and 2015 . 183 6.4 Discussion ... 193
6.5 Summary ... 194
CHAPTER 7 ... 195
General Discussion ... 195
7.1 Diverse response to soil water stress ... 195
7.2 Water-use efficiency improvement ... 197
7.3 Grain quality improvement ... 198
7.4 Wheat ideotype in north-western NSW, Australia ... 199
7.5 Diversity in marker-trait associations ... 200
7.6 Conclusion ... 201
7.7 Future work ... 202
References ... 203
ix List of Tables Chapter 3
Table 3.1: List of germplasm used to make crosses for 480 double haploid derived lines in field
studies during 2013-2015 ... 28
Table 3.2: The location of each experiment conducted between 2013-2015 ... 29
Table 3.3: Details of the experiments conducted during 2013-2015 ... 29
Table 3.4: Fertilizer applied to the experimental sites ... 30
Table 3.5: Chemicals applied throughout the cropping season for weed and pest control ... 30
Table 3.6: Traits evaluated each year (2013-2015) ... 36
Table 3.7: Wald statistics from the tests of fixed effects for evaluated traits in E1 ... 37
Table 3.8: Correlation coefficient between traits in environment one (E1, irrigated) in 2013 ... 38
Table 3.9: Wald statistics from the tests of fixed effects for evaluated traits in E2 (2014)... 42
Table 3.10: Correlation coefficient between traits in environment two (E2, rainfed) in 2014 ... 43
Table 3.11: Wald statistics from the tests of fixed effects for traits evaluated in E3 ... 47
Table 3.12: Correlation coefficient between traits in environment three (E3) in 2014 ... 48
Table 3.13: Wald statistics from the tests of fixed effects for traits evaluated in E4 ... 52
Table 3.14: Correlation coefficient between traits in E4 (2015) ... 53
Table 3.15: Wald statistics from the tests of fixed effects for traits evaluated in E5 ... 57
Table 3.16: Correlation coefficient between traits in E5 (2015) ... 58
Table 3.17: Wald statistics from the tests of fixed effects for E2-E3 (2014) ... 62
Table 3.18: Correlation coefficient between trait in environment E2-E3 (2014) ... 63
Table 3.19: Wald statistics from the tests of fixed effects for traits evaluated in E4-E5 ... 68
Table 3.20: Correlation coefficient between traits in environment E4-E5 (2015) ... 69
Table 3.21: Independent analysis of osmotic potential (OP) and osmotic adjustment (OA) for 21 genotypes (16 selected lines with all bread parents included for comparison) ... 75
Table 3.22: Independent analysis of osmotic potential (OP) and osmotic adjustment (OA) (Mpa) at E4 and E5 in 2015 for 16 selected lines include all bread wheat parents. Bread wheat parent followed by its progeny arranged respectively ... 76
Table 3.23: Independent analysis for water availability (mm) at entry 16 plots (2 replicates) in 2 environments E4 (rainfed) and E5(irrigated) in 2015 ... 77
Table 3.24: Combined analysis of variance for common traits assessed in all 5 environments (E1-E5) ... 83
Table 3.25: Wald statistics from tests for fixed effects from a combined analysis of trials common to two or more environments ... 84
Table 3.26: Correlations between different environments (E1 to E5) ... 85
Table 3.27: Summary of multiple regression analysis of grain yield as the response variable (dependent) for each environment and combined over environments ... 85
Chapter 4 Table 4.1: Dates of neutron probe assessment in 2014 and 2015 ... 99
Table 4.2: Combined analysis for WA (water availability in mm) in 2 environments, E2- ... 106
x
Table 4.4: Combined analysis of variance (mean squares) and means for CO2 (Ci/Ca), intrinsic
water use efficiency (WUEintr = A/ gs), photosynthesis (A), stomatal conductance (gs),
transpiration (E), leaf length (LL), leaf width (LW), light interception (LI %) and instantaneous
water use efficiency (WUEi) at E4 and E5 in 2015 for 16 selected lines ... 114
Table 4.5: Relationship between Photosynthesis (A), light interception (LI%), leaf length (cm), leaf width (cm), Intrinsic WUE (WUEintr = A/ gs), instantaneous WUE (WUEi = A/E), CO2 (Ci/Ca),stomatal conductance (gs) and transpiration (E) in 16 selected cultivars. ... 116
Chapter 5 Table 5.1: Wald statistics from the tests of fixed effects for grain quality in E1(2013)... 125
Table 5.2: Correlation coefficients between quality traits and other traits evaluated in E1 ... 125
Table 5.3: Independent analysis of grain quality in E2 (2014)... 129
Table 5.4: Correlation coefficients between quality traits and other traits evaluated in E2 ... 130
Table 5.5: Wald statistics from tests of fixed effects for grain quality traits in E3 (2014) ... 133
Table 5.6: Correlation coefficients between quality traits and other traits evaluated in E3 ... 134
Table 5.7: Wald statistics from tests for fixed effects for grain quality in E4 (2015) ... 137
Table 5.8: Correlation coefficients between quality traits and other traits evaluated in E4 ... 138
Table 5.9: Wald statistics from tests of fixed effects for grain quality in E5 (2015) ... 140
Table 5.10: Correlation coefficients between quality traits and other traits evaluated in ... 141
Table 5.11: Wald statistics from tests of fixed effects for grain quality in E2-E3 (2014) ... 143
Table 5.12: Wald statistics from tests for fixed effected of grain quality in E4-E5 (2015) ... 145
Table 5.13: Wald statistics from the combined analysis of grain quality across all environments (E1-E5) ... 149
Table 5.14: Correlation coefficients between quality traits across all environments ... 149
Chapter 6 Table 6.1: Genotypes entry number used in each year for association analysis ... 157
Table 6.2: Traits studied (2013-2015) for association analysis ... 159
Table 6.3: Description of MTAs that having unique position in specific chromosome at rainfed and irrigated conditions that also correlated with other studies findings in wheat at the same chromosome ... 164
Table 6.4: List of MTA (SNPs order) significantly associated (-log P > 3) with single, multiple traits or appeared more than once in ... 185
Table 6.5: List of MTA (SNPs order) significantly associated (-log P > 3) with single, multiple traits or appeared more than once in ... 190
Table 6.6: List of MTA (SNPs order) significantly associated (-log P > 3) with single, multiple traits or appeared more than once in ... 192
xi
List of Figures Chapter 2
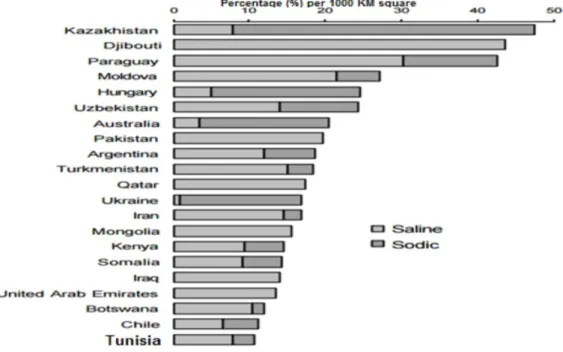
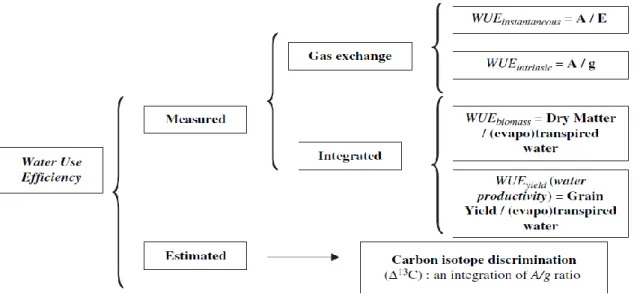
Fig. 2.1: Australian wheat production and area planted (GRDC, 2011) ... 9 Fig. 2.2: Countries most affected by soil constraints: salinity and sodicity (FAO, 2000) ... 11 Fig. 2.3: The several definitions of water use efficiency (WUE). A, net photosynthetic rate expressed as µmol CO2 m-2 s-1; E, transpiration rate expressed as mmol H2O m-2 s-1; ∆13C,
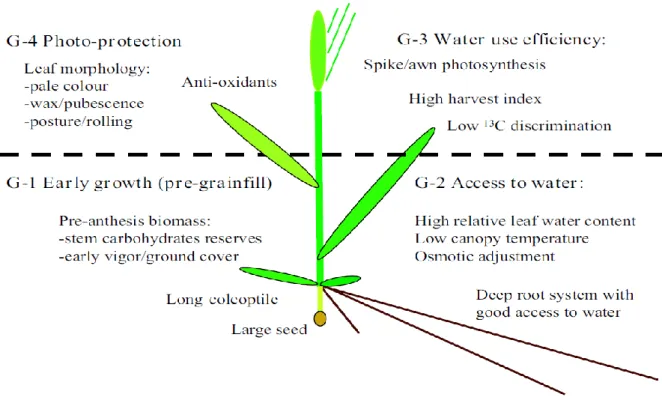
carbon isotope discrimination. Adapted from Tambussi et al. (2007) ... 14 Fig. 2.4: A conceptual model for drought adaptation in wheat based on literature (Reynolds et al., 2005) ... 22
Chapter 3
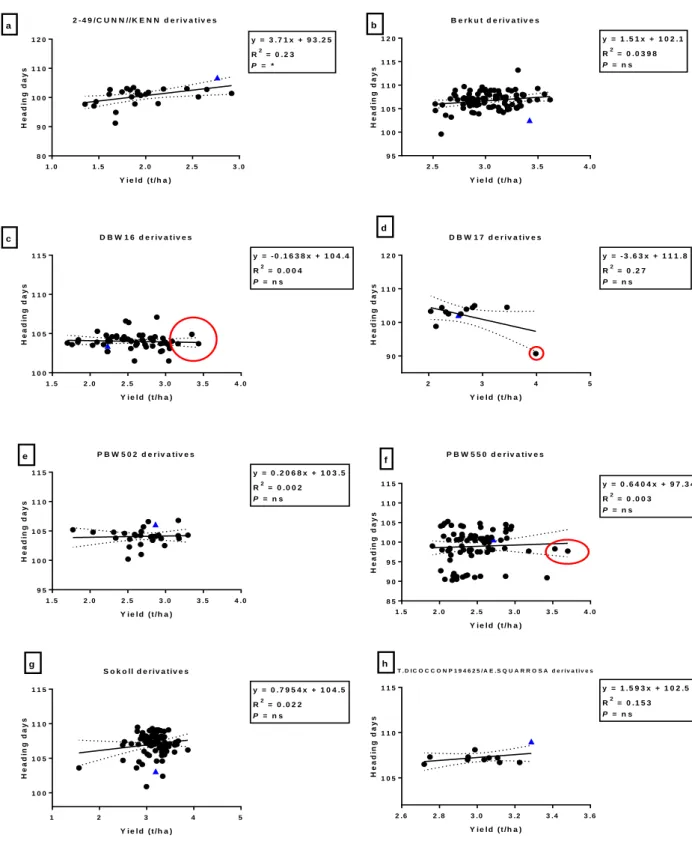
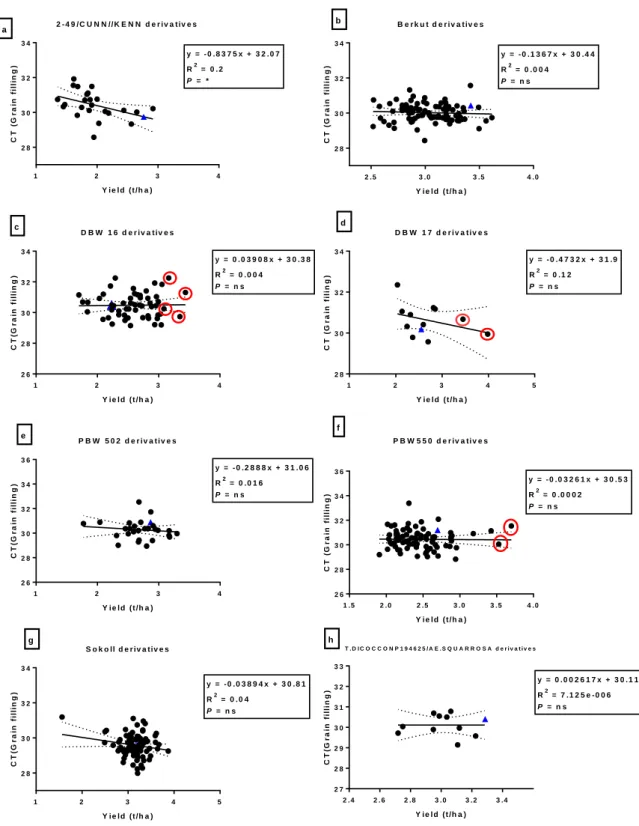
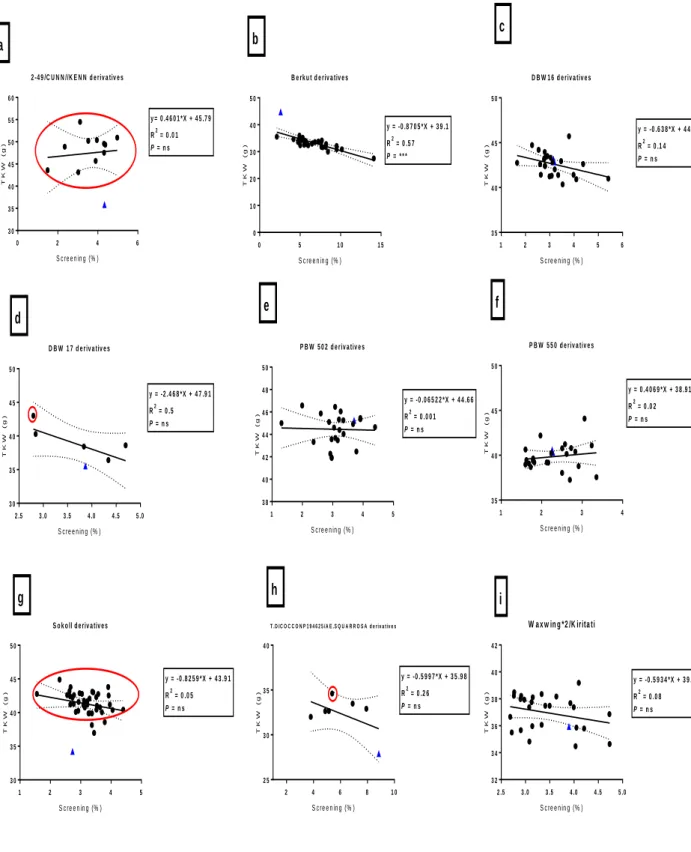
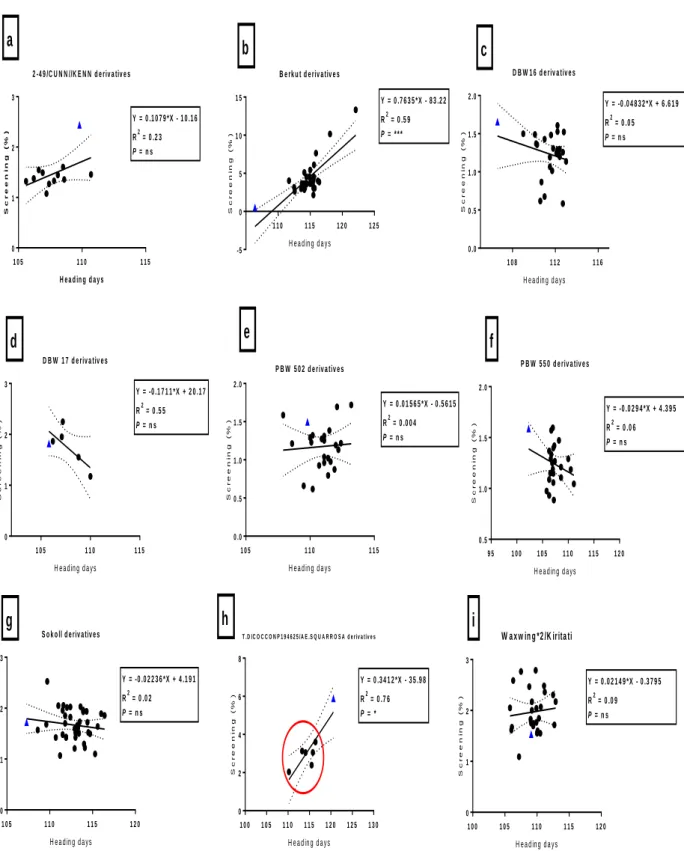
Fig. 3.1: Correlation between heading days and grain yield (t/ha) among bread wheat parents (blue triangles) and their progeny in E1 (irrigated). Red circles indicate progeny that have significantly (P<0.05) higher grain yield compared to their bread wheat parent.* = significance at P < 0.05 and ns = not significant ... 39 Fig. 3.2: Correlation between canopy temperature (°C) and grain yield (t/ha) among bread wheat parents (blue triangles) and their progeny in E1 (irrigated). Circles indicate DH lines with significant (P<0.05) higher grain yield than their bread wheat parent. ... 40 Fig. 3.3: Correlation between heading days and TKW (g) among bread wheat parents (blue triangles) and their progeny in E2. The red circles indicate DH lines with significantly (P<0.05) higher TKW than their bread wheat parent. *, **, *** = significance at P < 0.05, P < 0.01, P < 0.001 respectively, and ns = not significant ... 44 Fig. 3.4: Correlation between grain yield and grain filling period (GFP) among bread wheat parents (blue triangles) and their progeny in E2. Circles indicate DH line with significantly (P<0.05) higher grain yield than their bread wheat parent. ** = significance at P < 0.01 and ns = not significant ... 45 Fig. 3.5: Correlations between TKW and maturity days among bread wheat parents (blue triangles) and their progeny in E3. The red circles indicate DH line indicate significantly (P<0.05) higher TKW than their bread wheat parent. *,**,*** = significance at P < 0.05, P < 0.01, P < 0.001, and ns = not significant... 49 Fig. 3.6: Correlations between TKW and CCI (anthesis stage) among bread wheat parents (blue triangles) and their progeny in E3. The red circles indicate DH line with significantly (P<0.05) higher TKW than their bread wheat parent. *,**,*** = significance at P < 0.05, P < 0.01, P < 0.001 respectively, and ns = not significant ... 50 Fig. 3.7: Correlations between yield and screenings (%) among bread wheat parents (blue triangles) and their progeny in E4. The red square indicate DH lines with significantly (P<0.05) lower screenings to their bread wheat parent. *,**,*** = significance at P < 0.05, P < 0.01, P < 0.001 and ns = not significant ... 54 Fig. 3.8: Correlations between TKW and screenings (%) among bread wheat parents (blue triangles) and their progeny in E4. The red circles indicate DH lines with significantly (P<0.05) higher TKW than their bread wheat parent. *,**,*** = significance at P < 0.05, P < 0.01, P < 0.001 and ns = not significant ... 55
xii
Fig. 3.9: Correlations between screenings (%) and heading days among bread wheat parents (blue triangles) and their progeny in E5. The red circles indicate DH lines with significantly (P<0.05) lower screenings than their bread wheat parent. *,**,*** = significance at P < 0.05, P
< 0.01, P < 0.001 and ns = not significant ... 59 Fig. 3.10: Correlations between TKW and maturity days among bread wheat parents (blue triangles) and their progeny in E5. The red circles indicate DH lines with significantly (P<0.05) higher TKW than their bread wheat parent. *,**,*** = significance at P < 0.05, P < 0.01, P < 0.001 and ns = not significant ... 60 Fig. 3.11: Comparison of yield (t/ha) between environments among bread wheat parents (triangles) and their progeny in 2014. The black circles indicate genotypes that had no significant (P<0.05) difference between environments ... 64 Fig. 3.12: Comparison in TKW (g) between environments among bread wheat parents (triangles) and their progeny in 2014. The black circles indicate genotypes with significant (P<0.05) differences between environments ... 65 Fig. 3.13: Comparison in heading days between environments among bread wheat parents (triangles) and their progeny in 2014. The black circles indicate genotypes that had significant (P<0.05) differences between environment ... 66 Fig. 3.14: Comparison in yield (t/ha) between environments among bread wheat parents (triangles) and their progeny in 2015. The black circles indicate genotypes with significant (P<0.05) differences between environments ... 70 Fig. 3.15: Comparison in TKW (g) between environments among bread wheat parents (triangles) and their progeny in 2015. The black circles indicate genotypes significantly (P<0.05) different between environments ... 71 Fig. 3.16: Comparison in screenings (%) between environments among bread wheat parents (triangles) and their progeny in 2015. The black circles indicate genotypes with significantly (P<0.05) different screenings between environments ... 72 Fig. 3.17: Comparison in heading days between environments among bread wheat parents (triangles) and their progeny in 2015. The black circles indicate genotypes with significantly (P<0.05) different heading days between environments ... 73 Fig. 3.18: Mean water available (mm) at entry 16 plots (2 replicates) at soil depths from 10cm to 134 cm under two water regimes (E4 = rainfed; E5 = irrigated) in 2015 (a) Booting stage (Z45) and (b) Flowering stage (Z59-Z61). Different letters indicate significant LSD (P< 0.05) between environments; bars represent standard deviations. ... 78 Fig. 3.19: Comparison between environments in a) Osmotic potential (MPa), b) Canopy temperature (CT) at heading stage, c) Chlorophyll content index (CCI) at grain filling stage and d) Normalized difference vegetation index (NDVI) at heading stage in 2015. The same symbol shape indicates lines from same bread wheat parent and the black circles indicate genotypes with significant (P<0.05) differences between environments ... 79 Fig. 3.20: Comparisons between bread wheat parents and their progeny a) TKW (g), b) Yield (t/ha), c) heading days. Different letters indicate significance at P<0.05. Values are the mean and the error bars are the standard deviations ... 86 Fig. 3.21: GGE biplot of ideal genotype based on grain yield a) overall view and b) close view at the centre of the concentric circle (represents the position of an ideal genotype as defined in section 3.3.10 above) ... 87 Fig. 3.22: Comparison between ideal genotypes (Suntop as reference) in combined environments based on GGE biplot (Figure 3.21b) for a) yield (E1-E5); b) canopy temperature (E1-E3); c) heading days (E1-E5); d) TKW(g) (E1-E5); e) screenings (%) (E1 and E4-E5); f)
xiii
NDVI at heading stage E5); g) plant height (cm) E5) and h) NDVI at grain filling (E1-E3). Different letters indicate significance at P<0.05. Values are the mean and the error bars are the standard deviations ... 88 Fig. 3.23: GGE biplot (based on grain yield) identification of winning genotypes and their related environments a) overall view and b) close view ... 89 Fig. 3.24: Comparisons between ideal genotype in a) DSI in 2014, b) DSI in 2015, c) grain yield between environment in 2014 and d) grain yield between environment in 2015. All means for 200 genotypes in 2014 and 2015 trial are presented in Table 13 Appendix II. Different letters indicate significance at P<0.05 between environments. Values are the mean and the error bars are the standard deviations ... 90
Chapter 4
Fig. 4. 1: Neutron probe moisture meter used to determined soil moisture counts ... 99 Fig. 4. 2: Rainfall (mm) and mean minimum and maximum temperature (°C) for 2013 (a), 2014 (b), and 2015 (c) at Narrabri ... 103 Fig. 4.3: Mean humidity (%) and solar radiation (MJ m-2) for 2013 (a), 2014 (b), and 2015 (c) at Narrabri ... 105 Fig. 4.4: Available moisture (mm) at each plant development stage in 2014 (a) and 2015 (b). Different letters are significantly different at P<0.05 between environments in each crop development stage. Values are the mean and the error bars are the standard deviations ... 107 Fig. 4.5: Available moisture (mm) at different depth of soil layer from top in 2014 (a) and 2015 (b). Different letters are significantly different at P<0.05 between environments at each soil depth. Values are the mean and the error bars are the standard deviations ... 108 Fig. 4.6: GGE biplot of 200 lines based on WUEGrain in 4 environments. There are 6 emmers
(Accession id; T.dicoccum 500132 (orange, ), T.dicoccum 500110 (bright pink, ), T.dicoccum
AUS 21758 (spring green, ), BARI 7531 (dark green, ), T.dicoccum C18643 (violet, ) and
T.dicoccum AUS 19385 (dark golden, ) derived doubled haploid lines (marked with number)
showed similarity in biplots of high WUEGrain at E2, E3, E4 and E5 as circled and contrast from
bread parents (Labelled P1, P2, P3, P4 and P5). The numbers in rectangles are ideal genotypes. The same shaped symbol indicates lines derived from the same bread wheat parent, and the same colour an origin from the same emmer parent. Total variation is 75.11% for principal component analysis (PC1 represents 43.93% and PC2 represents 31.18% of the total variation (P = 0.003) ... 112 Fig. 4.7: Comparison of the WUEGrain of bread wheat parent with their emmer derived progeny
(a) Sokoll and (b) PBW502. Different letters are significantly different at P<0.05 between environment in each genotype. Values are mean bread parent follows by its progeny and the error bars are the standard deviation ... 113 Fig. 4.8: Comparisons between bread parents and their progeny of (a) transpiration, (b) instantaneous water use efficiency, (c) stomatal conductance, and (d) intrinsic water use. Different letters indicate significance at P<0.05 between bread parent and its progeny and related materials. Values are mean bread parent follows by its progeny and the error bars are the standard deviations ... 117 Fig. 4.9: Comparison between bread parents and their progeny for the ratio of internal CO2
concentration to ambient CO2 concentration (Ci/Ca). Values are mean bread parent followed by
xiv
Fig. 4.10: Comparisons between bread parents and their progeny in two environments (E4 and E5) of (a) instantaneous water use efficiency, (b) intrinsic water use. Different letters indicate significance at P<0.05 between environments in each genotype. Values are mean of bread parent follows by its progeny and the error bars are the standard deviations ... 118
Chapter 5
Fig. 5.1: Correlation of protein % with a) Yield (t/ha) (r = -0.4942); b) Height (cm) (r = -0.497); c) moisture (%) (r = -0.2379) and d) test weight (kghL-1) (r = -0.2344) in E1. *** indicate significance at P <0.001. The bread wheat parents are highlighted with blue triangles. The red circles and rectangles indicate genotypes had higher grain protein content than their bread wheat parents ... 126 Fig. 5.2: Comparison of bread wheat parents and selected progeny for a) Protein (%), b) Yield (t/ha), c) heading days and d) plant height (cm) for genotypes highlighted with a rectangle in Figure 5.1a. Different letters indicate significance at P<0.05. Values are the mean and the error bars are standard deviations ... 127 Fig. 5.3: Correlation between protein (%) and heading days for bread wheat parents (blue triangles) and their progeny in E1.Circles indicate progeny that have significantly (P<0.05) higher protein content (%) than their bread wheat parent. *, **, *** indicate significance at P < 0.05, P < 0.01, P <0.001 respectively and ns = not significant ... 128 Fig. 5.4: Correlation of protein with a) Yield (r = -0.181); b) Grain test weight (r = -0.3766) in E2. * and *** indicate significance at P <0.05 and <0.001. The red circles indicate genotypes higher in protein content (%) compared to bread wheat checks and significantly (P<0.05) higher than the bread wheat parent (PBW 550) ... 131 Fig. 5.5: Correlation of grain test weight (kghL-1) with a) Yield (r = 0.4804) and b) Plant height (r = -0.3532) in E2. *** indicates significance at P <0.001 ... 132 Fig. 5.6: Comparison of protein content (%) with a) grain filling days (r = 0.2463) and b) grain test weight (kghL-1) (r = -0.3351). The red rectangle indicates genotypes had higher grain protein with shorter grain filling than their bread wheat parents ... 135 Fig. 5.7: Comparisons between bread wheat parents and their progeny for: a) Protein (%), b) Yield (t/ha), c) Test weight (kghL-1) and d) moisture (%) for genotypes highlighted in the rectangle in Figure 5.6a. Different letters indicate significance at P<0.05. Values are the mean and the error bars are the standard deviations ... 136 Fig. 5.8: Correlation between protein and a) Thousand kernel weight (g) (r = -0.607); b) Yield (t/ha) (r = -0.3342); c) Test weight (kghL-1) (r = -0.4602) and d) Screenings (%) (r = 0.5439) in E4 ... 139 Fig. 5.9: Correlations between protein and a) Yield (t/ha) (r = -0.2682); b) Screenings (%) (r = 0.599); c) Test weight (kghL-1) (r = -0.4671); and d) Thousand kernel weight (g) (r = -0.5214) in E5 ... 142 Fig. 5.10: Comparisons of 12 ideal genotypes in two environments (E2, rainfed and E3, irrigated) in 2014 based on GGE biplot analysis in Chapter 3 for a) grain protein (%); b) yield (t/ha); c) grain test weight (kghL-1); d) grain moisture(%); e) thousand kernel weight (g). Different letters indicate significance at P<0.05 between environments. Values are the mean and the error bars are the standard deviations ... 144 Fig. 5.11: Comparison between 12 ideal genotypes in two environments (E4, rainfed and E5, irrigated) in 2015 based on GGE biplot in Chapter 3 for a) grain protein (%); b) yield (t/ha); c) grain test weight (kghL-1); d) grain moisture (%); e) thousand kernel weight (g); f) grain
xv
screenings (%). Different letters indicate significance at P<0.05 between environments. Values are the mean and the error bars are the standard deviations ... 146 Fig. 5.12: GGE biplot of 200 lines based on grain protein content in 5 environments. The same shaped symbol indicates lines derived from the same bread wheat parent, and the same colour an origin from the same emmer parent. Doubled haploid lines (marked with numbers) showed high protein content compared to its bread wheat parent (label P1, P2, P3, P4 and P5). Commercial bread wheat is indicated with a plus symbol and marked with “S” (S1, Sunlin; S2, Suntop; S3, Ega-Gregory; S4, Spitfire) ... 150 Fig. 5.13: Comparison of Berkut and derived progeny for a) grain protein and moisture (%), b) Yield (t/ha), c) Test weight (kghL-1) and d) thousand kernel weight (g) in combined analysis (E1-E5). Different letters indicate significance at P<0.05. Values are the mean and the error bars are the standard deviations ... 151 Fig. 5.14: Comparison of 2-49/Cunningham//Kennedy and derived progeny for a) grain protein and moisture (%), b) Yield (t/ha), c) Test weight (kghL-1) and d) thousand kernel weight (g) in combined analysis (E1-E5). Different letters indicate significance at P<0.05 between same trait. Values are the mean and the error bars are the standard deviations... 152 Fig. 5.15: Comparison of ideal genotypes in five environments based on GGE biplot in chapter three for a) grain protein (%); b) yield (t/ha); c) grain test weight (kghL-1); d) grain moisture(%); e) thousand kernel weight (g); f) grain screening (%). Different letters indicate significance at P<0.05. Values are the mean and the error bars are the standard deviations ... 153
Chapter 6
Fig. 6.1: Scatter plot of the first two principle components. (a) Wheat heat tolerance (DH lines tested for drought tolerance here also concurrence with heat tolerance trial in the field) data only (In total 2412 sample call rate ≥ 4 from 2433 genotypes sent [including genotypes from other heat tolerance project]); (b) Combined wheat heat tolerance and DAS reference population data. Note that in Figure 6.1(a) core genotype records (selected 200 lines in Appendix I, Table 1) that represent the genetic diversity of the population are the red symbols ... 160 Fig. 6.2: Manhattan plot of the genome-wide P values of association in grain yield at rainfed (E2 and E4) environments. The SNPs index number localize the marker that segregated in the population with -log P > 3 ... 167 Fig. 6.3: Manhattan plot of the genome-wide P values of association in grain yield at irrigated (E3 and E5) environments ... 168 Fig. 6.4: Manhattan plot of the genome-wide P values of association in WUEGrain at rainfed (E2
and E4) environments. The SNPs index ... 169 Fig. 6.5: Manhattan plot of the genome-wide P values of association in WUEGrain at irrigated
(E2 and E4) environments ... 170 Fig. 6.6: Manhattan plot of the genome-wide P values of association in screenings at rainfed (E4) environment. The SNPs index number ... 171 Fig. 6.7: Manhattan plot of the genome-wide P values of association in screenings at irrigated (E5) environment ... 172 Fig. 6.8: Manhattan plot of the genome-wide P values of association in TKW at rainfed (E2 and E4) environments. The SNPs index number ... 173 Fig. 6.9: Manhattan plot of the genome-wide P values of association in TKW at irrigated (E3 and E5) environments. The SNPs index number ... 174
xvi
Fig. 6.10: Manhattan plot of the genome-wide P values of association in heading days at rainfed (E2 and E4) environments. The SNPs index ... 175 Fig. 6.11: Manhattan plot of the genome-wide P values of association in heading days at irrigated (E3 and E5) environments. The SNPs index ... 176 Fig. 6.12: Manhattan plot of the genome-wide P values of association in plant height at rainfed (E2 and E4) environments. The SNP index ... 177 Fig. 6.13: Manhattan plot of the genome-wide P values of association in plant height at irrigated (E3 and E5) environments. The SNPs index ... 178 Fig. 6.14: Manhattan plot of the genome-wide P values of association in grain protein content (GPC) at rainfed (E2 and E4) environments. ... 179 Fig. 6.15: Manhattan plot of the genome-wide P values of association in grain protein content (GPC) at irrigated (E3 and E5) environments. ... 180 Fig. 6.16: Manhattan plot of the genome-wide P values of association in grain test weight (GTW) at rainfed (E2 and E4) environments. The... 181 Fig. 6.17: Manhattan plot of the genome-wide P values of association in grain test weight (GTW) at irrigated (E3 and E5) environments. The ... 182
List of Appendices Appendix I
Table 1: List of double haploids derived from table 3.1 crosses: Number 1-480 has enough seed to go through for 2013 experiment under optimum condition and number 1 to 200 has been selected to go through experiments in different moisture regimes (2014-2015) based on 2013 results. ... 222
Figure 1: Narrabri field map. The black arrow shows Hydrant 4 west (2013 experimental site), the green arrow shows Hydrant 21 East (2014 and 2015 Experimental sites), and the dark blue arrow shows Hydrant 22 East (2014 experimental site). ... 233 Figure 2: Nutrient available results in 2013 experimental site before experiment started and sufficient ranged value for every elements (a: 0-15 cm depth; b: 15-60cm depth; c: 60-90cm depth). Whereas in 2014 experimental site (d: 0-10 cm depth; e: 10-60cm depth; f: 60-90cm depth) and in 2015 experimental site (g-h: 0-15 cm depth, 15-60cm depth, 60-90cm depth). . 239 Figure 3: The root lesion nematode (Pratylenchus species) risk results was low at 2013 experimental site (a), 2014 (b) and 2015 (c) ... 242 Figure 4: Neutron moisture meter calibration runned at northeast to southwest I.A. Watson Grains Research Centre, Narrabri through the buffer area on 2013. ... 243
Appendix II
Table 1: Mean of Yield (t/ha) for each environment (independent analysis) and combined analysis (E1-E5) in 5 environments (2013-2015) ... 244 Table 2: Mean of thousand kernel weight trait for each environment (independent analysis) and combined analysis (E1-E5) in 5 environments ... 256
xvii
Table 3: Mean of heading days trait for each environment (independent analysis) and combined
analysis (E1 to E5) in 5 environments (2013-2015). ... 268
Table 4: Mean of plant height trait for each environment (independent analysis) and combined analysis (E1-E5) in 5 environment ... 280
Table 5: Mean of WUE [(kg/ha)/mm] of 200 genotypes (independent and combined analysis of evaluated genotypes in 2014-2015 (E2-E5). ... 293
Table 6: Mean of canopy temperature (°C) of independent analysis (E1, booting, heading and early grain filling stages; E2 and E3, heading stage) ... 296
Table 7: Mean of Chlorophyll content index of 200 genotypes evaluated from combined analysis (2014, E2-E3 and 2015, E4-E5). ... 307
Table 8: Mean of ground cover rate (%) of independent analysis in 5 environments ... 309
Table 9: Mean of normalize difference vegetative index (NDVI) in 3 crop development (Z45, booting; Z49- Z61, heading to flowering; Z75-Z77, grain filling) in E1 (2013). ... 316
Table 10: Mean of normalize difference vegetative index (NDVI) for 2 stages (Z49-Z59, heading; Z73, grain filling) in 2 environments E2-E3 (2014) ... 323
Table 11: Mean of normalize difference vegetative index (NDVI) for 3 stages (Z22, tillering;Z33, stem elongation; Z55-Z65, head to flowering) in 2 environments (2015) ... 326
Table 12: Mean of normalized difference vegetative index (NDVI) from combined ... 329
Table 13: Drought susceptibility index mean for 2014 (E2-E3) and 2015 (E4-E5) ... 332
Table 14: Mean of screenings (%) from independent analysis (E1, E4 and E5) and combined analysis (E1, E4 and E5) ... 335
Table 15: Mean of protein content (%) from independent analysis ... 341
Table 16: Mean of test weight (kg hL-1) from independent analysis ... 349
Table 17: Mean of moisture (%) from independent analysis ... 355
Table 18: Mean of quality traits of 200 genotypes evaluated from combined analysis in 5 environments (2013-2015) ... 363
Figure 1: Mini bubble spririt measurement for canopy reflectance reading uniformity ... 366
Figure 2: Flag leaves in each plot dipped in 2 cm of distilled water for full rehydration ... 367
Figure 3: Setting up equipment for osmotic potential measurement ... 367
Appendix III Table 1: List of SNPs significantly associated with various traits in rainfed (E2 and E4) and irrigated (E3 and E5) environments ... 368
Table 2: List of SNPs significantly associated with various traits across the year ... 385
Figure 1: Manhattan plot of the genome-wide P values of association in grain yield in 2013 trial ... 414
Figure 2: Manhattan plot of the genome-wide P values of association in canopy temperature at booting stage in 2013 trial ... 415
Figure 3: Manhattan plot of the genome-wide P values of association in canopy temperature at flowering stage in 2013 trial ... 415
xviii
Figure 4: Manhattan plot of the genome-wide P values of association in canopy temperature at grain filling in 2013 trial ... 416 Figure 5: Manhattan plot of the genome-wide P values of association in ground cover rate in 2013 trial ... 416 Figure 6: Manhattan plot of the genome-wide P values of association in heading days in 2013 trial ... 417 Figure 7: Manhattan plot of the genome-wide P values of association in normalized difference vegetation index at booting in 2013 trial ... 417 Figure 8: Manhattan plot of the genome-wide P values of association normalized difference vegetation index at flowering in 2013 trial ... 418 Figure 9: Manhattan plot of the genome-wide P values of association in normalized difference vegetation index at grain filling in 2013 trial ... 418 Figure 10: Manhattan plot of the genome-wide P values of association normalized difference vegetation index at heading in 2013 trial ... 419 Figure 11: Manhattan plot of the genome-wide P values of association plant height in 2013 trial
... 419 Figure 12: Manhattan plot of the genome-wide P values of association thousand kernel weight (TKW) in 2013 trial ... 420 Figure 13: Manhattan plot of the genome-wide P values of association screening in 2013 trial
... 420 Figure 14: Manhattan plot of the genome-wide P values of association grain protein content (GPC) in 2013 trial ... 421 Figure 15: Manhattan plot of the genome-wide P values of grain moisture (GM) in 2013 trial
... 421 Figure 16: Manhattan plot of the genome-wide P values of association grain test weight (GTW) in 2013 trial ... 422 Figure 17: Manhattan plot of the genome-wide P values of association grain yield in 2014 trial
... 422 Figure 18: Manhattan plot of the genome-wide P values of association WUEGrain (Grain water
use efficiency) in 2014 trial... 423 Figure 19: Manhattan plot of the genome-wide P values of association thousand kernel weight (TKW) in 2014 trial ... 423 Figure 20: Manhattan plot of the genome-wide P values of association heading days in 2014 trial ... 424 Figure 21: Manhattan plot of the genome-wide P values of association chlorophyll content index at anthesis in 2014 trial... 424 Figure 22: Manhattan plot of the genome-wide P values of association chlorophyll content index at heading in 2014 trial ... 425 Figure 23: Manhattan plot of the genome-wide P values of association canopy temperature at heading in 2014 trial ... 425 Figure 24: Manhattan plot of the genome-wide P values of association normalized difference vegetation index at heading in 2014 trial ... 426 Figure 25: Manhattan plot of the genome-wide P values of association normalized difference vegetation index at grain filling in 2014 trial ... 426 Figure 26: Manhattan plot of the genome-wide P values of association grain protein content (GPC) in 2014 trial ... 427
xix
Figure 27: Manhattan plot of the genome-wide P values of association grain moisture (GM) in 2014 trial ... 427 Figure 28: Manhattan plot of the genome-wide P values of association grain yield in 2015 trial
... 428 Figure 29: Manhattan plot of the genome-wide P values of association WUEGrain (grain water
use efficiency) in 2015 trial... 428 Figure 30: Manhattan plot of the genome-wide P values of association thousand kernel weight (TKW) in 2015 trial ... 429 Figure 31: Manhattan plot of the genome-wide P values of association chlorophyll content index at milky stage in 2015 trial ... 429 Figure 32: Manhattan plot of the genome-wide P values of association screening in 2015 trial
... 430 Figure 33: Manhattan plot of the genome-wide P values of association heading days in 2015 trial ... 430 Figure 34: Manhattan plot of the genome-wide P values of association plant height in 2015 trial
... 431 Figure 35: Manhattan plot of the genome-wide P values of association normalized difference vegetation index at tillering in 2015 trial ... 431 Figure 36: Manhattan plot of the genome-wide P values of association normalized difference vegetation index at elongation in 2015 trial ... 432 Figure 37: Manhattan plot of the genome-wide P values of association normalized difference vegetation index at heading in 2015 trial ... 432 Figure 38: Manhattan plot of the genome-wide P values of association grain protein content (GPC) in 2015 trial ... 433 Figure 39: Manhattan plot of the genome-wide P values of association grain test weight (GTW) in 2015 trial ... 433 Figure 40: Manhattan plot of the genome-wide P values of association grain moisture in 2015 trial ... 434
xx Abbreviations
A = Photosynthesis (µmolm-2s-1)
AGG = Australian Grains Genebank
bp = base pair
BoM = Bureau of Meteorology
BLUEs = Best Linear Unbiased Estimators
cM = centiMorgan
CCI = Chlorophyll content index
CSIRO = Commonwealth Science and Industrial Research Organisation CIMMYT = International Maize and Wheat Improvement Centre
CT = Canopy Temperature
DAS = Distributed annotation system
DSI = Drought susceptibility index
DNA = Deoxyribonucleic acid
DFAT = Department of Foreign Affairs and Trade
E = Transpiration (mmol m-2s-1)
F = F statistic
FAO = Food and Agriculture Organization of the United Nations
GGE = Genotype main effects plus genotype by-environment interaction
GE = Genotype by environment interaction
GWAS = Genome-wide association study
GPC = Grain protein content (%)
GCTA = Genome-wide complex trait analysis
gs = Stomatal conductance (mol m-2s-1)
LD = Linkage disequilibrium
xxi
METs = Multi-environment trials
MTA = Marker trait association
NDVI = Normalized difference vegetation index
NSW = New South Wales
NMM = Neutron meter moisture
OA = Osmotic Adjustment (MPa)
OP = Osmotic Potential (MPa)
PCA = Principal component analysis
QTL = Quantitative trait loci
REML = Restricted Maximum Likelihood
SNPs = Single nucleotide polymorphisms
TWU = Total water use (mm)
TKW = Thousand kernel weight (g)
Wald = Wald statistic
WUE = Water use efficiency
WUEintr = Intrinsic water use efficiency (A/gs: µmol mol-1)
WUEGrain = Grain water use efficiency (Y/TWU: kg ha-1 mm-1)
WUEi = Instantaneous WUE (A/E: mmol mol-1)
1
CHAPTER 1
Introduction
Strategies to improve the drought tolerance of wheat are critical for effective wheat improvement. The development of higher-yielding crops under water-limited conditions is part of the solution to stabilizing and increasing wheat production under current and future climatic conditions. However the inheritance of drought response is complex in wheat and is greatly affected by the environment. Cultivars currently grown by farmers are in harmony with the local environment and management as they were generally selected empirically under the prevailing local conditions (Farooq, 2009). Nevertheless, new sources of genetic variation for drought response are required if progress in drought tolerance breeding is to continue. The gene pool of cultivated emmer wheat (Triticum dicoccon Schrank)(2n=4x=28 chromosomes, AABB genomes) possesses valuable traits, resistance to pests and diseases, and tolerances to abiotic stresses. This gene pool is increasingly being used as a reservoir of new genes in wheat breeding (Zaharieva et al., 2010). Emmer can be crossed with Aegilops tauchii, the donor of D-genome in bread wheat, to produce new hexaploid synthetic wheats. Synthetic backcross derived lines have shown higher yield under drought-prone conditions in Mexico, Pakistan and Eastern India than similar synthetic-derived lines developed using cultivated durum wheat as the tetraploid component (Trethowan and Mujeeb-Kazi, 2008).
Water use efficiency (WUE) is often considered an important determinant of yield under moisture stress and even as a component of crop drought resistance (Blum, 2009). However, understanding the interaction of drought resistance traits with the environment is critical if crop production under drought is to be improved (Reynolds and Tuberosa, 2008). Water saving agricultural systems can also improve water utilization and water use efficiency (Deng et al., 2004). If these more water-use-efficient practices are combined with genetically improved cultivars with higher yield and drought resistance then the productivity in rainfed farming systems can be improved. Genotypic variation in grain WUE based on the equation yield divided by total water use (WUEGrain=Y/TWU)under limited water moisture. It is more affected by
2
(biomass or grain yield) (Blum, 2005). Instruments such as the neutron probe moisture meter are reliable, quick and easy to use (Barrada, 1976), and can be used to calculate water availability of individual genotypes at different depths in the field (Atta, 2013).
Selection for high WUE under limited water supply tends to result in a genetic shift towards plant traits that limit crop water use, such as early flowering and smaller leaf area (Ngugi et al., 1994 and White et al., 1990). Baodi et al. (2008) concluded that high leaf WUE under rainfed conditions in wheat could be obtained by selecting for high photosynthetic rate, low transpiration rate and low stomatal conductance. Intrinsic water use efficiency (WUEintr) is defined as the ratio of photosynthesis to stomatal conductance to water, thereby accounting for VPD (leaf to air vapour pressure deficit) on transpiration (Seibt et al. 2008). Leaf gas exchange measurement provides accurate measurement for WUEintr (photosynthesis/stomatal conductance). Gilbert et al.(2011)
found that this trait did not interact with leaf temperature and photosynthetic capacity differences were maintained under all conditions. This suggests that WUEintr could be
improved through breeding under a broad spectrum of environments.
Drought adaptive traits have quantitative inheritance (Reynolds and Tuberosa, 2008), so that molecular markers linked to quantitative trait loci (QTL) that explain a significant portion of the genetic variation of key traits are important for breeding. Association mapping or linkage disequilibrium (LD) mapping was used to detect and locate QTL based on the strength of correlation between mapped genetic markers and traits (Mackay and Powell, 2007). The selection for the QTLs can take place under both optimum and stressed conditions, as eliciting a stress response is not necessary for marker assisted selection (Lafitte and Edmeades, 1995). However, temporal variability of drought-adaptive traits will need to be determined through in-depth analysis of QTL-by-environment interactions (Boer et al., 2007).
The main purpose of this study was to identify morphological and physio-genetic differences among wheat hexaploids with potential introgressions from emmer wheats influencing grain yield and water use efficiency under drought stress. The first component of this research is a study of the phenotypic response to drought under contrasting moisture regimes in northwestern NSW (Narrabri). The second component was an in-depth analysis of selected materials and their bread wheat parents for stress response. The third and final component was to conduct a genome wide association
3
analysis using 90K single-nucleotide polymorphism (SNP) genotypes of all materials and the phenotypic data captured across 3 years at Narrabri to identify genomic regions linked to plant stress response and the possible contribution of emmer wheat to this response. The detailed aims of this research were:
1. To determine the physiological basis of yield under stress.
2. To identify significant marker trait associations (MTAs) with genotype stress response.
3. To identify the impact of phenology and plant height on stress response 4. To estimate the heritability for water use efficiency, grain yield and the
physiological traits influencing productivity under stress.
5. To determine the influence of environment on water use efficiency and other plant traits (G x E interactions)
4
CHAPTER 2 Literature Review
Drought is one of the most significant factors limiting crop yield. Climate change is projected to have a significant impact on temperature and precipitation profiles, increasing the severity and incidence of drought. Since the mid-1990s, southeast Australia has experienced a 15% decline in the late autumn and early winter rainfall and a 25% decline in average rainfall in April and May. The average annual stream flow into Perth’s dams has already decreased by nearly 80% since the mid-1970s (Steffen, 2015). In Australia, wheat is mainly grown under rainfed conditions with low and uncertain rainfall, resulting in highly variable annual production (French and Schultz, 1984; Christopher et al. 2008). Improving water use efficiency is therefore a primary target of researchers, farming systems groups and growers in Australia. The rate of genetic advance for yield in such environments has been constrained by large genotype by environment interactions (GE), that change the rankings of genotypes from site to site and from season to season (Cooper et al. 2001; Richards et al., 2002). To overcome this problem, new varieties need to be developed with higher drought tolerance. Selections of cultivated emmer wheat (Triticum dicoccon Schrank) that came from extreme conditions and with genetic diversity, crossed with improved bread wheat, is one strategy to improve WUE. Subsequently double haploid production from these crosses would reduce time and speed up the breeding program.
Targeting a combination of high yield and enhanced WUE in the doubled haploid lines from these crosses was the breeding strategy employed. Reliable measurement under field conditions would identify and allow selection of the best crosses and emmer parents improving WUE in hexaploid bread wheat under drought prone condition. There are many findings on genetic diversity on emmer wheat (Švek et al. 2005; Wang et al. 2007; Al Khanjari et al. 2007 and Teklu et al. 2007) but less on diversity used to improve hexaploid bread wheat as shown phenotypically in the field. Good phenotyping ensures good association during the establishment of phenotype-genotype associations. Tuberosa (2012) indicates that experiments performed in the field and that mimic as closely as possible the drought stress conditions would be most relevant and meaningful from biological and agronomic standpoints. This study emphasises that well executed “phenotyping” with proved diversity in emmer wheat has
5
improved water use efficiency in hexaploid bread wheat as well as grain protein content at water limited conditions. Plus this study aims to identify the genetic basis of WUE and associated plant traits under drought prone conditions.
2.1 Wheat
The wheat genus Triticum is within the family Poaceae. The ploidy levels range from diploid (einkorn) (2n = 2x = 14; AABB), tetraploid (2n = 4x = 28; AABB) to hexaploid (2n = 6x = 42; AABBDD). The wheats (Triticum aestivum L. em. Thell. and T. turgidum L.) are the world’s leading cereal grains and most important food crop (Sleper and Poehlman, 2006). According to FAO (FAO 2015) world wheat production for July 2014 to June 2015 was 729.5 million tonnes, thus making it the second highest cereal crop production after maize (995 million tonnes).
2.1.1 Importance of wheat
Currently about 95 percent of the wheat grown worldwide is hexaploid bread wheat, with most of the remaining 5 percent being tetraploid durum wheat (Shewry, 2009). It is a staple food for 35% of the world’s population (Ogbonnaya et al., 2013). Hulled wheats are denotes any wild or cultivated Triticum population with nonthreshable grain (Szabó and Hammer, 1996). Einkorn (Triticum monococcum L.), emmer wheat (Triticum dicoccum (Schrank) and spelt wheat (Triticum spelta L.) are included in the hulled wheats. Small amounts of these hulled wheats are still grown in some regions including Spain, Turkey, the Balkans, and the Indian subcontinent (Shewry, 2009). Hulled wheats (4 einkorn, 8 emmer wheat, and 7 spelt wheat accessions) were found to be valuable for sustainable farming systems and although inclined to lodging, were resistant to foliar diseases (e.g. powdery mildew and leaf rust), and their grains are characterised by high protein content (up to 18.1%). However the grain yield of the hulled wheats is inferior to bread wheat (Konvalina et al. 2012).
Higher contents of bran are typical in emmer compared to spelt, while spelt is characterized by higher values of gluten and SDS (sodium dodecyl sulfate) test values (Piergiovanni et al., 1996). Cultivation of emmer wheat now covers only 1% of the total wheat area although it can still be considered as an important crop in parts of India, Ethiopia, Iran, Eastern Turkey, Transcaucasia, the Volga Basin (ex-Yugoslavia), Central Europe, Italy and Spain (Stallknecht et al., 1996). Cultivated emmer (Triticum
6
dicoccon Schrank) contains remarkably high total antioxidant activity, total phenolics, ferulic acid and flavonoids in the grain, indicating potential health benefits (Serpen et al., 2008).
Wheat grain is used to meet consumer demands for bread and other food products. Its content of starch, about 60-70% of the whole grain and 65-75% of white flour, means that wheat is often considered to be little more than a source of calories. Despite its relatively low protein content (usually 8-15%) wheat still provides as much protein for global human and livestock nutrition as the whole soybean crop (Shewry, 2000). Therefore, the nutritional value of wheat proteins should not be underestimated, particularly in less developed countries where various breads, noodles and other products (i.e. bulgar and couscous) often provide a substantial proportion of the diet (Shewry, 2009). Wheat is also one of the major sources of minerals, contributing 44% of the daily intake of iron and 25% of the daily intake of zinc in the UK (Henderson et al., 2007). It also a source of the micronutrient selenium, where the content of selenium in wheat varies widely from about 10 µg kg-1 to over 2000 µg kg-1 (FAO/WHO, 2001; Combs, 2001).
Emmer wheat is considered to be healthier than bread wheat food in Ethiopia cause it has fewer digestive problem (Tesemma and Belay, 1991). In Ethiopia straw is mainly used as livestock feed, and as fuel in times of scarcity, and some may also be used as a component of plaster for the construction of local houses. Some medical data confirms the nutritional value of emmer wheat (Strehlow et al., 1994; Italiano and De Pasquale, 1994) cited in Zaharieva et al. (2010), is mainly due to its high fibre and antioxidant concentrations (Piergiovanni et al., 1996), high protein digestibility (Hanchinal et al., 2005) and high resistant-starch content and slower carbohydrate in
vitro digestibility (Mohan and Malleshi, 2006). Buvaneshwari et al. (2005) found
emmer wheat suitable for diabetes because it has a low glycaemic index, and a high satiety value.
2.1.2 Genetic diversity in emmer wheat (Triticum dicoccon Schrank) Thell.
Hulled wheat or emmer wheat (Triticum dicoccon Schrank) is a tetraploid species (BA- genomes) and one of the earliest domesticated wheat species. It was widely cultivated during Antiquity, particularly in Egypt, and until the Bronze age in a large number of countries (Zaharieva et al., 2010). The traits of resistance to rusts and
7
powdery mildew as well as tolerance to heat and drought present in emmer wheat can be of interest in the context of climate change and suggested for preparation of healthy dishes in bio quality (Zaharieva et al., 2010; Konvalina et al., 2010). Whereas, Triticum
turgidum ssp. dicoccoides, the allo-tetraploid (AABB) or wild emmer wheat, progenitor
of most tetraploid and hexaploid cultivated wheats and proved offers valuable source of diversity including drought resistance (Peng et al., 2003; Saranga et al., 2008; Nevo, 2014; Merchuk-Ovnat et al., 2016). A wide range of diversity was reported in eight agronomic characters but no correlation was found between the diversity and the geographical origins of accessions of 91 cultivated emmer wheat accessions from different origins (Wang et al. 2007). Teklu et al. (2007) found high genetic diversity in materials from Iran, Morocco and Armenia, and lowest in Yemen and Slovakia when 73 accessions of emmer wheat from 11 geographical regions were evaluated.
The Indian emmer wheats are not very diverse (Salunkhe et al., 2013), suggesting a need to increase the diversity within the eco-geographic groups, or even from other wheat species in India. The main reason for this finding is likely to be due the diffusion of a smaller number of cultivated emmer wheat that was probably introduced into India during the 4th or 3rd millennium BC (Nesbitt and Samuel, 1996). Whereas, emmer has originated and has cultivated for longer outside India. Higher yield under drought prone conditions in emmer based synthetic backcross derived lines compared to durum wheat has been proven in Mexico, Pakistan and Eastern India (Trethowan and Mujeeb-Kazi, 2008). Since not much research on drought tolerant adaptation on cultivated emmer wheat (Triticum dicoccon Schrank) been reported, high genetic diversity in cultivated emmer wheat that been found through SSR markers with its adaptability in hot and dry areas became the basic of research background for this study (Zaharieva et al., 2009).
The potential exploitation of A and B genome diversity from emmer to create new bread wheat germplasm diversity is based on some background. A major gene (Yr15) located on chromosome 1BS of wild emmer wheat showed effective against all stripe rust (Puccinia striiformis f.sp. tritici; Pst races) identified so far in the USA (Murphy et al., 2009; Chen et al., 2010), Australia (Bariana et al., 2007; Randhawa et al., 2014). A promising source of alleles with high grain protein content (GPC) was detected at chromosome 6B from wild emmer (Olmos et al., 2003). Peleg et al. (2009) found major genomic regions controlling productivity in drought environment and
8
related traits in chromosomes 2B, 4A, 5A and 7B in durum wheat x wild emmer recombinant inbred lines (RILs) population, suggesting the involvement of these related traits with adaptation to drought stress. Two of the detected quantitative trait loci (QTL) were located on chromosome 3B and had a large effect on canopy temperature and grain yield, accounting for up to 22% of the variance for these traits. Furthermore the locus on chromosome 3BL was detected under heat, drought, and high yield under potential environment, but had largest effect under the heat stress conditions (Bennett et al., 2012). Quarrie et al. (2005) mapped strongest QTLs for grain yield under drought on chromosomes arms 7AL and 7BL. A consistent genomic region associated with drought susceptibility index (qDSI.4B.1) was mapped on the short arm of wheat chromosome 4B, which also controlled grain yield per plant, harvest index, and root biomass under drought (Kadam et al., 2012). This study highlighting the complex nature of drought adaptation traits, but consistent genomic associations were located only on chromosomes 4B and 7B.
2.2 Wheat cultivation in Australia
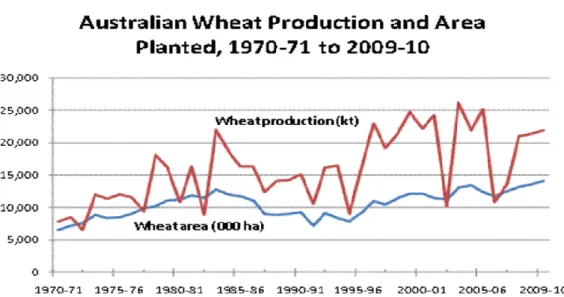
Wheat has been grown in Australia for more than 200 years, with sowing starting in autumn, and harvesting in late spring and summer. Australia is the seventh largest wheat producer in the world and the fourth largest exporter. Over 70% of Australia wheat production is exported, with Western Australia the lead exporting state (USDA, 2015). Average production wheat in Australia is 21 million tonnes over the period between 2002-03 and 2012 -13 (Nguyen et al., 2015). Since 1960, increases in production have mainly come from improvements in plant genetics, advances in farm technologies and consolidation of businesses into large more efficient farms (Sheng et al. 2011; Nossal et al. 2009). Wheat production is highly variable varying from 10 to 25 million metric tonnes in one year (figure 2.1). Hochman et al. (2017) reveal that yield potential of wheat in Australia for water-limited areas has declined by 27% over a 26 year period or 1.1% per year since 1990, concurrent with falling in-crop rainfall and rising daily maximum temperatures averaged for the in-crop periods over 50 weather stations. Clearly drought was the major cause of this variability and accounts for stalled wheat yields in Australia. Relative to some other countries, yields in Australia have grown slowly, particularly in recent periods while the area planted has increased slowly since 1988/89. Average yield at both points in time were about 1.6 tonnes per hectare (GRDC, 2011). Most Australian wheat is sold overseas with Western Australian the
9
largest exporting state (DAWR, 2015). Asian and Middle East regions including Indonesia, Japan, South Korea, Malaysia, Vietnam and Sudan were the major markets importing wheat from Australia.
Fig. 2. 1: Australian wheat production and area planted (GRDC, 2011) 2.3 GGE biplot analysis
Multiple environment trials (METs) are generally carried out by plant breeders to select and recommend high yielding and stable genotypes for a set of environments (Agyeman et al., 2015). Genotype-by-environment interactions often cause difficulties in the interpretation of results and reduce efficiency in selecting the best genotypes in analysing the METs data. Therefore, GGE biplot is a graphical tool which displays, interprets and explores two important sources of variation, namely genotype main effect and GE interaction of METs data (Fan et al., 2007; Yan et al., 2000; Yan and Hunt 2002). It is effective method that based on principal component analysis (PCA) to fully explore multi-environment trials (METs). Unlike conventional approaches, which allow calculation of probability for a particular hypothesis, the GGE biplot approach does not have a measure of uncertainty. Therefore, the GGE biplot is better used as a hypothesis-generator rather than as a decision maker and hypotheses based on biplots should be tested using conventional statistical methods (Yan and Hunt 2002). Principal component analysis showed the effective method to grouping the genotypes and determine important traits in white bean (Phaseolus vulgaris) selection (Koij and Saba, 2015) and validated with cluster analysis. To understand the contributions of cultivated emmer wheat in hexaploid bread wheat, selection based on physiological, agronomic and