Big Data Analytics in Static and Streaming Provenance
191
0
0
Full text
Figure
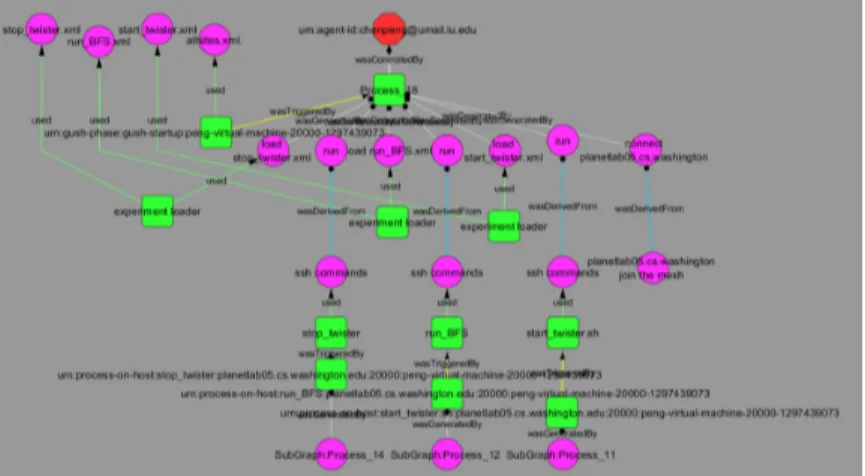
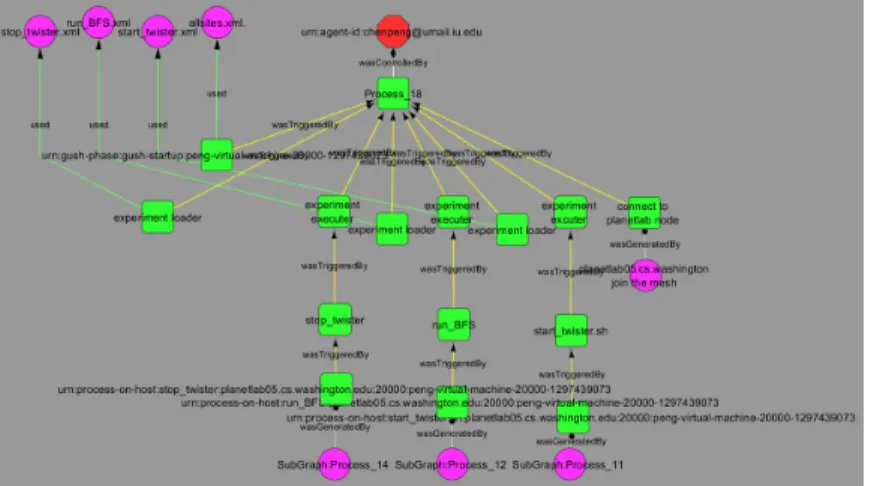
![Figure 3.4: Capture provenance of DDoS Attacks Exploiting WiMAX System Parameters by researchers at Clemson [58]](https://thumb-us.123doks.com/thumbv2/123dok_us/1369387.2683376/66.918.163.808.236.567/figure-capture-provenance-attacks-exploiting-parameters-researchers-clemson.webp)
+7

Outline
Storage and Retrieval of Large Scale Provenance Data
Data Mining on Provenance
Provenance Visualization Techniques
Performance Evaluation
Provenance Stream Processing
Experimental Evaluation
Feature Selection from Statistical Feature Space
Unsupervised Clustering, Pre-grouped
Performance of WTR Algorithm
Related documents