PROCESSING, MICROSTRUCTURES AND PROPERTIES OF ULTRA-HIGH STRENGTH, LOW CARBON AND V-BEARING DUAL-PHASE STEELS PRODUCED
ON CONTINUOUS GALVANIZING LINES
by
Yingjie Wu
B. Eng. in Welding Technology and Engineering, Nanchang Hangkong University, 2014
Submitted to the Graduate Faculty of
Swanson School of Engineering in partial fulfillment of the requirements for the degree of
Master of Science
University of Pittsburgh 2017
UNIVERSITY OF PITTSBURGH SWANSON SCHOOL OF ENGINEERING
This thesis was presented by
Yingjie Wu
It was defended on July 11, 2017 and approved by
Ian Nettleship, Ph.D., Associate Professor, Department of Mechanical Engineering and Materials Science
Patrick Smolinski, Ph.D., Associate Professor, Department of Mechanical Engineering and Materials Science
John F. Oyler, Ph.D., Adjunct Associate Professor, Department of Civil and Environment Engineering
Thesis Advisor: Anthony J. DeArdo, Ph.D., Professor, Department of Mechanical Engineering and Materials Science
Copyright © by Yingjie Wu 2017
PROCESSING, MICROSTRUCTURES AND PROPERTIES OF ULTRA-HIGH STRENGTH, LOW CARBON AND V-BEARING DUAL-PHASE STEELS PRODUCED
ON CONTINUOUS GALVANIZING LINES
Yingjie Wu, M.S. University of Pittsburgh, 2017
One of the most popular elements in weight reduction programs in the automotive industry is high strength zinc coated dual-phase steel produced on continuous hot dipped galvanizing lines. The high strength is needed for mass reduction, while the protective zinc coating is needed to prevent corrosion of the thin gage cold rolled steel. The present study was aimed to explore an optimized way to produce such dual-phase steels with ultra-high tensile strength (UTS > 1280MPa), good global ductility (TE > 18%), excellent local ductility (sheared-edge ductility, HER > 40%) and products of UTS × TE > 22000 MPa × %, conforming to data of AHSS Generation III steel. A steel of this kind is referred to as a third-generation advanced high strength steel. By altering chemical compositions (0.15wt.% carbon), pre-annealing conditions (different hot band coiling temperatures and cold reductions), annealing conditions (different intercritical annealing temperatures) and annealing paths (standard galvanizing or supercool processing), this study set out to investigate the effects of these factors on the microstructures and mechanical properties of dual-phase steels. Results showed that the stored energy of cold rolled steel with 0.15wt.% carbon was much higher than that of carbon containing 0.1wt.% carbon, generating numerous lattice
recrystallization of ferrite during the intercritical anneal. In addition, it was found that the volume fraction of martensite increased with the combination of low coiling temperature, high cold reduction, and high annealing temperature, thereby increasing the tensile strength. Furthermore, the microstructural analysis and tensile testing results and showed that the tensile strength of dual-phase steel with 0.15Wt.% carbon, combined with the ultrafine microstructures (average ferrite grain sizes reached 1-2µm) could approach 1300MPa without loss of ductility and with hole expansion ratios, in some cases, reaching 35%. Since the relative hardness of the hard martensite and soft ferrite is important in controlling sheared-edge ductility, the nanohardness results of these phases were measured. It was revealed that the martensite hardness decreased with increasing volume fraction, at a given carbon content, indicating the tensile strength was independent of the martensite hardness. Other mechanical properties, such as yield strength, YS/UTS ratio, hardness and work hardening behavior, of dual-phase steels controlled by the factors mentioned above were correlated to the microstructural features. The hypothesis that the bulk carbon content would be a major factor in controlling the strength of these steels was vindicated by the results of this study.
TABLE OF CONTENTS
ACKNOWLEDGEMENT ... XIV
1.0 INTRODUCTION ... 1
2.0 KNOWLEDGE BACKGROUND ... 3
2.1 PRODUCTION ROUTES FOR DUAL- PHASE STEELS ... 3
2.1.1 Continuous annealing ... 3 2.1.2 As-hot-rolled ... 5 2.1.3 Batch annealing ... 5 2.2 ALLOYING ELEMENTS... 6 2.2.1 Manganese ... 6 2.2.2 Silicon ... 7
2.2.3 Chromium and molybdenum ... 8
2.2.4 Vanadium... 9
2.3 MECHANICAL PROPERTIES OF DUAL PHASE STEELS ... 10
2.3.1 Yield and tensile strengths ... 12
2.3.2 Work hardening behavior ... 14
2.4 STRENGTHENING MECHANISMS ... 16
2.5 FORMATION OF AUSTENITE... 20
3.0 STATEMENT OF OBJECTIVE ... 22
4.0 EXPERIMENTAL PROCEDURES ... 24
4.1 CHEMICAL COMPOSITIONS OF MATERIALS ... 24
4.2 THERMOMECHANCAL PROCESS ... 24
4.3 EQUIPMENT AND FACILITIES ... 32
4.3.1 Optical microscopy ... 32
4.3.2 Scanning electron microscopy and electron backscatter diffraction ... 33
4.3.3 Tensile test ... 34
4.3.4 Vickers hardness test and nano hardness test ... 35
4.3.5 Hole expansion ratio test ... 37
4.3.6 Vibrating sample magnetometer ... 38
5.0 RESULTS ... 40
5.1 RESULTS OF COLD ROLLED STEELS ... 40
5.2 RESULTS OF ANNEALED STEELS ... 44
5.2.1 Mechanical Properties ... 44
5.2.2 Microstructures ... 60
5.2.3 Nanohardness of ferrite and martensite ... 70
5.2.4 Measurement of retained austenite ... 74
6.0 DISCUSSION ... 78
7.0 CONCLUSIONS ... 82
8.0 FUTURE WORK ... 84
LIST OF TABLES
Table 4.1 Chemical compositions of materials (w.t%) ... 24 Table 4.2 Defining optimum annealing temperature ... 26 Table 4.3 Critical temperatures of annealed dual phase steels, as the intercritical temperatures
chosen 770℃ and 750℃, estimated by JmatPro ... 30 Table 4.4 Designation of tested samples based on different coiling temperatures (CT), cold
reduction (CT), and intercritical annealing temperatures (IAT) ... 31 Table 5.1 Designation of cold rolled steels based on different coiling temperatures (CT) and cold reductions (CR) ... 40 Table 5.2 Vickers hardness (300gf) of cold rolled steels with different coiling temperatures (CT) and cold reductions (CR) ... 41 Table 5.3 Stored Energy (J/cm3) in Cold Rolled Steels Before Annealing... 43 Table 5.4 Mechanical properties (UTS, YS, TE, YS/UTS, UTS×TE) of the annealed steels with standard galvanizing (F1) ... 53 Table 5.5 Mechanical properties (UTS, YS, TE, YS/UTS, UTS×TE) of the annealed steels with supercool processing (G1) ... 53 Table 5.6 RA, HER, UTS, TE and UTS×TE of dual phase steels ... 55 Table 5.7 RA, HER (predicted from RA data), UTS, of dual phase steels... 55 Table 5.8 Work hardening behavior n1 (0.2%-0.5% engineering strain), n2 (4%-6% engineering strain) and uniform elongation (UE) of annealed steels with standard galvanizing (F1) and supercool processing (G1) ... 58 Table 5.9 Ferrite grain sizes (dF), volume fraction of martensite (Vm) and retained austenite(Vγ′) of steels annealed by standard galvanizing (F1) ... 68 Table 5.10 Ferrite grain sizes (dF), volume fraction of martensite (Vm), tempered martensite
Table 5.11 Nanohardness of ferrite and martensite of dual-phase steels annealed by standard galvanizing (F1) ... 73 Table 5.12 Volume fraction of retained austenite (Vγ′) of dual-phase steels annealed by standard galvanizing (F1) and supercool processing (G1) ... 75
LIST OF FIGURES
Figure 2.1 Relationship between the critical cooling rates and alloying elements [23] ... 7
Figure 2.2 Effect of cooling rate on yield and tensile strengths, YS/UTS, yield point elongation and total elongation in Cr-bearing steels [23] ... 9
Figure 2.3 Solubility products, in atomic per cent, of carbides and nitrides in austenite as function of temperature [34] ... 10
Figure 2.4 The relationship between the strengths and percent martensite as well as the distribution of strengths of the fine-grained and the coarse-grained for the Fe-Mn-C alloys [29] .... 11
Figure 2.5 The relationship between uniform elongation and tensile strength [29] ... 12
Figure 2.6 Dislocations bypass the particles [58] ... 17
Figure 2.7 Dislocations shear the particles [58]... 17
Figure 2.8 Balance of forces acting during particle resistance to dislocation movement [58] ... 18
Figure 4.1 Volume fractions of martensite at different annealing temperatures ... 27
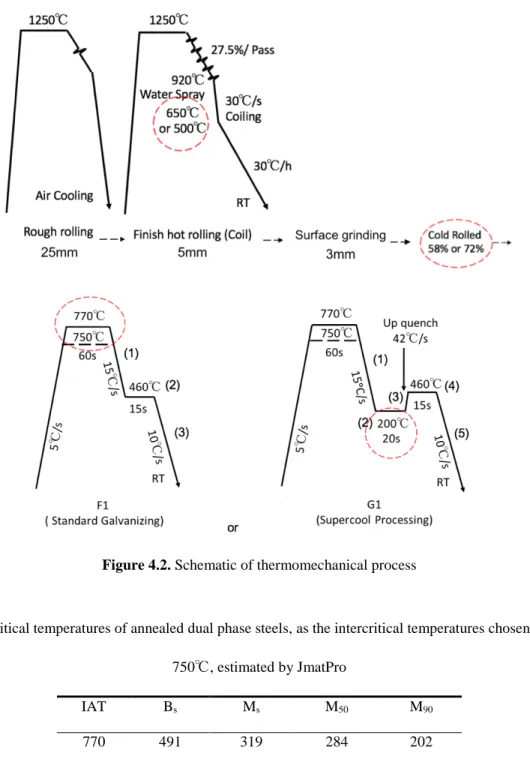
Figure 4.2. Schematic of thermomechanical process... 30
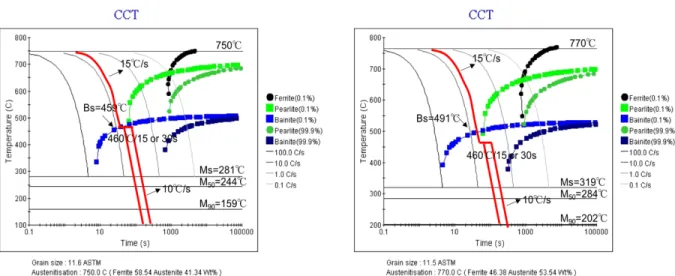
Figure 4.3 CCT of intercritical austenite during cooling, assuming the equilibrium at AC3 (770℃ or 750℃) ... 31
Figure 4.4 Sony digital camera attached to a Nikon Microscope ... 33
Figure 4.5 FEI Apreo SEM ... 34
Figure 4.6 Schematic of sheet tensile test samples [68] ... 35
Figure 4.7 Hysitron TriboIndenter ... 36
Figure 4.8 The schematic of hole expansion test procedure [69] ... 37
Figure 5.1 OM images of microstructures of cold rolled steels, etched by 2% Nital, a) 5M (CT=500℃, CR=58%), b) 6M (CT=650℃, CR=58%), c) 5N (CT=500℃, CR=72%), d) 6N (CT=650℃, CR=72%) ... 41 Figure 5.2 Stored energy of cold rolled steels, a) 5M (CT=500℃, CR=58%) IPF (with HAGB), b) 5M SE=5.01J/cm3, c) 6M (CT=650℃, CR=58) IPF (with HAGB), d) 5M SE=5.13J/cm3, e) 5N (CT=500℃, CR=58%) IPF (with HAGB), f) 5N SE=5.72J/cm3, g) 6N (CT=650℃, CR=72%) IPF (with HAGB), h) 6N SE=5.60J/cm3 ... 42 Figure 5.3 Engineering stress-strain curve of annealed steels with cold reduction of 58% (left) and cold reduction of 72% (right) annealed by standard galvanizing (F1) ... 45 Figure 5.4 Engineering stress-strain curve of annealed steels with cold reduction of 58% (left) and cold reduction of 72% (right) annealed by supercool processing (G1) ... 45 Figure 5.5 Ultimate tensile strength (UTS) of dual phase steels annealed by standard galvanizing (F1) and supercool processing (G1), in terms of each of annealing process, 5 represents CT=500℃,6 means CT=650℃, M indicates CR=58%, N is CR=72%, X=7 IAT=750℃ and X=8 IAT=770℃ ... 48 Figure 5.6 Yield strength (YS) of dual phase steels annealed by standard galvanizing (F1) and supercool processing (G1), in terms of each of annealing process, 5 represents CT=500℃,6 means CT=650℃, M indicates CR=58%, N is CR=72%, X=7 IAT=750℃ and X=8 IAT=770℃ ... 49 Figure 5.7 YS/UTS of dual phase steels annealed by standard galvanizing (F1) and supercool
processing (G1), in terms of each of annealing process, 5 represents CT=500℃,6 means CT=650℃, M indicates CR=58%, N is CR=72%, X=7 IAT=750℃ and X=8 IAT=770℃ ... 50 Figure 5.8 Total elongation (TE) of dual phase steels annealed by standard galvanizing (F1) and supercool processing (G1), in terms of each of annealing process, 5 represents CT=500℃,6 means CT=650℃, M indicates CR=58%, N is CR=72%, X=7 IAT=750℃ and X=8 IAT=770℃ ... 51 Figure 5.9 The relationship between total elongation and tensile strength of dual phase steels annealed by standard galvanizing (F1) and supercool processing (G1), blue solid line shows the minimum product of TE×UTS for DP steels (10K), red dashed line represents the minimum product of TE×UTS for TRIP steels (18K), and green dotted line indicates the minimum product of TE×UTS for Generation III steels (22K) ... 52 Figure 5.10 The relationship among hole expansion ratios (HER), tensile strength (UTS) and
reductions in area (RA). (a) HER (measured) vs RA; (b) HER (predicted from RA) vs UTS ... 56 Figure 5.11 a) n values at 4%-6% engineering strain of steels annealed by standard galvanizing (F1); b) n values at 4%-6% engineering strain of steels annealed by supercool processing (G1); c) the relationship between uniform elongations (10 mm gage length) and n values,
and the fitting curve of these data is a positive straight line, of which the linear equation is UE=4.52+31.26×n, with R2=0.72. ... 59 Figure 5.12 SEM microstructures of annealed steels with different intercritical annealing
temperatures (IAT), a) 5N7J (CT=500℃, CR=72%, AT=750℃, IHT=15s), F1(Standard Galvanizing), b) 5N8J (CT=500℃, CR=72%, AT=770℃, IHT=15s), F1(Standard Galvanizing) ... 62 Figure 5.13 SEM microstructures of annealed steels with different intercritical annealing
temperatures (IAT), a) 5M7J (CT=500℃, CR=58%, AT=750℃, IHT=15s), F1(Standard Galvanizing), b) 5M8J (CT=500℃, CR=58%, AT=770℃, IHT=15s), F1(Standard Galvanizing) ... 62 Figure 5.14 SEM microstructures of annealed steels with different isothermal holding time (IHT) at zinc pot temperature, a) 5N8J (CT=500℃, CR=72%, AT=770℃, IHT=15s), F1(Standard Galvanizing), b) 5N8K (CT=500℃, CR=72%, AT=770℃, IHT=30s), F1(Standard Galvanizing) ... 63 Figure 5.15 SEM microstructures of annealed steels with different isothermal holding time (IHT) at zinc pot temperature, a) 5M8J (CT=500℃, CR=58%, AT=770℃, IHT=15s), F1(Standard Galvanizing), b) 5M8K (CT=500℃, CR=58%, AT=770℃, IHT=30s), F1(Standard Galvanizing) ... 63 Figure 5.16 SEM microstructures of annealed steels with different coiling temperatures, a) 5N7J (CT=500℃, CR=72%, AT=750℃, IHT=15s), F1(Standard Galvanizing), b) 6N7J (CT=650℃, CR=72%, AT=750℃, IHT=15s), F1(Standard Galvanizing) ... 64 Figure 5.17 SEM microstructures of annealed steels with different cold reduction, a) 5N8J
(CT=500℃, CR=72%, AT=770℃, IHT=15s), F1(Standard Galvanizing), b) 5M8J (CT=500℃, CR=58%, AT=770℃, IHT=15s), F1(Standard Galvanizing) ... 64 Figure 5.18 SEM microstructures of annealed steels with different annealing paths, a) 5N8J
(CT=500℃, CR=72%, AT=770℃, IHT=15s), F1(Standard Galvanizing), b) 5N8J (CT=500℃, CR=72%, AT=770℃, IHT=15s), G1(Supercool processing) ... 65 Figure 5.19 SEM microstructures of annealed steels with different annealing paths, a) 5M8J
(CT=500℃, CR=58%, AT=770℃, IHT=15s), F1(Standard Galvanizing), b) 5M8J (CT=500℃, CR=58%, AT=770℃, IHT=15s), G1(Supercool processing) ... 65 Figure 5.20 The relationship between stress and volume fraction of martensite of steels annealed by standard galvanizing (F1) in this research, the upper solid line illustrates the relationship between UTS and V and the lower solid line represents YS and Vm have a linear relation, proposed by Davies. ... 69 Figure 5.21 Distribution of ferrite grain sizes of 6M7K (CR=58%) and 6N7K (CR=72%) with standard galvanizing (F1) ... 69
Figure 5.22 SEM images of nanoindenters, a) 5M7J (CT=500℃, CR=58%, IAT=750℃), and b) 5M8J (CT=500℃, CR=58%, IAT=770) ... 72 Figure 5.23 SEM images of nanoindenters a) 6M7J (CT=650℃, CR=58%, IAT=750℃), and b) 6M8J (CT=650℃, CR=58%, IAT=770℃) ... 72 Figure 5.24 SEM images of nanoindenters a) 5N7J (CT=500℃, CR=72%, IAT=750℃), and b) 5N8J (CT=500℃, CR=72%, IAT=770℃) ... 73 Figure 5.25 SEM images of nanoindenters a) 6N7J (CT=650℃, CR=72%, IAT=750℃), and b) 6N8J (CT=650℃, CR=72%, IAT=770℃) ... 73 Figure 5.26 The relationship between nanohardness of martensite (NHNm) and volume fraction of martensite (Vm) of steels annealed by standard galvanizing (F1). ... 74 Figure 5.27 The relationship between hole expansion ratio and nanohardness of difference of
martensite and ferrite ... 74 Figure 5.28 The Moment/Mass vs Field of dual-phase steel 5M8K, G1 ... 75 Figure 5.29 Volume fraction of retained austenite vs annealing temperate of dual-phase steels
annealed by standard galvanizing (F1) and supercool processing (G1) ... 77 Figure 5.30 The relationship between HER (predicted from RA data) or RA and volume fraction of retained austenite (Vγ′). a) HER (predicted) vs Vγ′, with the fitting curve of HER=5.84×Vγ′+11.38, R2=0.59, b) RA=4.71×Vγ′+18.05, R2=0.57 ... 77
ACKNOWLEDGEMENT
I would like to convey my gratefulness to many people, because without their constant advice, forbearance and encouragement, I would never complete this thesis.
First and foremost, I would like to extend my gratitude to my advisor, Dr. Anthony J. DeArdo. His profound knowledge and extensive experience on physical metallurgy is always the strongest support and guidance for my study. And then I want to thank the other committee members, Professors Nettleship, Smolinski and Oyler for reviewing my thesis, attending my thesis defense and providing precious comments and suggestions.
Secondly, I would like to give a special thank you to Dr. Hua who helped me very much with sample preparation, mechanical testing and research, and etching methods selection. Subsequently, I wish to thank Qiongshu Wang for her continuous encouragement on my study and daily life. And I also need to thank other BAMPRI members, Bing Ma, Yu Gong, Petch Janbanjong, Junyu Duan, Xinchi Feng and Aaron Stein. No matter what kind of difficulties I encountered, they were willing to help me without any hesitation. Our friendship is the most valuable asset in my life.
In particular, I wish to extend my thanks to Dr. Goldman who helped me to improve my English speaking and writing skills, and he was always patient to correct all the mistakes I make.
Last but not least, I want to thank my parents, because without their financial support and mental encouragement, I would never finish my M.S. program in University of Pittsburgh.
1.0 INTRODUCTION
Dual-phase steels are characterized by a microstructure comprising of mainly of ferrite and martensite [1], but sometimes with a third phase, such as bainite, tempered martensite and retained austenite , leading to high tensile strength, continuous yielding, a low YS/UTS ratio, a high strain hardening rate and good ductility. These unique properties, as well as low alloy and continuous galvanizing line production costs, enable dual-phase steel to become the highly competitive materials in the automobile industry.
Today, DP 590 (UTS=590MPa), DP 780 (UTS=780MPa) and DP 980 (UTS=980 MPa) are commercial products, while DP 1180 (UTS=1180MPa) and DP1380 (UTS=1380 MPa) are still being investigated [1]. The difference in the mechanical properties of these steels is mainly attributed to the final microstructures. The tensile strength is linearly related to the volume fraction of martensite [2], which is transformed from intercritical austenite during cooling. Thus, understanding the formation of austenite during intercritical annealing is very important [1] and it is controlled by many obvious factors, such as alloying elements, reheating rates, intercritical annealing temperature, cooling rates from the annealing temperature to the zinc pot temperature and residency time in the zinc pot. However, this and other recent studies [3] [4] have shown secondary pre-annealing effects such as hot band coiling temperature and cold reduction can also greatly influence the amount of austenite formed during the anneal. Therefore, a good combination of coiling temperature and cold reduction can help ensure that a large amount of austenite can be
obtained during intercritical annealing in the short time available [5]. It has been found that the stored energy of the cold band is a good indicator to evaluate the ability to form large amounts of austenite during the anneal. The higher the stored energy, the larger the amount of new austenite will be formed. During intercritical annealing, a high annealing temperature will ensure more austenite to form, from the level rule, and after cooling, a large amount of martensite is attained to increase the tensile strength. The microstructures and mechanical properties also can be controlled by chemical compositions, such as carbon.
The properties of dual-phase steels containing 0.10wt% carbon were investigated by many researcher, but the benefit of changing carbon content from 0.10wt% to 0.15wt% is obvious. At the same intercritical annealing temperature, the dual-phase steels with 0.15wt% carbon can have more volume fraction of martensite, compared with 0.10wt% carbon, thereby increasing the hardness and tensile strength. The dual-phase steel with 0.15wt% carbon and 50% martensite have a good combination of high strength and good ductility [6], which helps to achieve the purpose of this study.
In terms of annealing path, apart from standard galvanizing, a new supercool processing was also used in this study. This new supercool processing is similar to quenching and partitioning process (Q&P). The dual-phase steels annealed by supercool processing can yield a good balance of high strength and good ductility. In the beginning of the supercool process, like quenching step, the intercritically annealed austenite were fast cooled from anneal temperature to supercool temperature (between Ms and Mf temperature) to from a controlled volume fraction of martensite [7]. After quenching, the steels were up quenched to zinc pot temperature (between Bs and Ms temperature), which is similar to portioning process.
2.0 KNOWLEDGE BACKGROUND
2.1 PRODUCTION ROUTES FOR DUAL- PHASE STEELS
Producing technologies of dual phase steels comprise three procedures: as-hot-rolled, batch annealing, and continuous annealing, with continuous annealing the most widely used. This is because of the higher production rates, better uniformity of properties, and the possibility of using low alloying elements [8].
2.1.1 Continuous annealing
The cold rolled DP steels typically use continuous annealing. During intercritical annealing, the steels are heated up between the A1 and A3 critical temperatures and soaked for a short time to anneal the cold rolled ferrite and form austenite. These austenite-ferrite mixtures are then accelerated cooled to the zinc pot temperature of approximately 460℃ [9] [10].
During continuous annealing, the formation of final microstructures of dual phase steels consists of several steps; formation of austenite during intercritical annealing, transformation of austenite after intercritical annealing and changes in ferrite during intercritical annealing [9] [11] [12] [13].
According to the level rule, higher intercritical annealing temperatures increase the amount of austenite and lead to a lower amount of carbon in the austenite, thereby decreasing the hardenability of austenite [14]. At low intercritical annealing temperatures, where the amount of austenite is low, the carbon content of the austenite is high, resulting in high hardenability of the intercritically formed austenite [15] [16].
In addition to intercritical annealing temperatures, the cooling rates from the annealing temperature to the zinc pot temperature can influence the final microstructures of dual-phase steels [1]. Since the zinc pot temperature of 460℃ is higher than the Ms but lower than the Bs of the intercritically formed austenite, high cooling rates will suppress the formation of new ferrite and bainite during cooling [17]. However, at the lower cooling rates, the portion of the intercritically formed austenite would transform into ferrite and ferrite-carbide mixtures (pearlite or bainite). Also, at the lower cooling rate, where cementite can precipitate in the ferrite, this would contribute to low carbon contents in ferrite; the epitaxial ferrite formed at slower cooling rates will maintain equilibrium with the austenite, following the Ac3 phase boundary line, consequently lowering the carbon content in ferrite [18]. The mechanical properties of dual-phase steels are affected by cooling rates after intercritical annealing. At the lower coiling temperature, the product of ultimate tensile strength × total elongation (UTS × TE, MPa × %) increases remarkably; however, the yield strength to tensile strength ratio (YS/UTS) can be maintained at a low level at lower coiling temperature, such as 10℃ /s [19].
2.1.2 As-hot-rolled
In terms of the as-hot-rolled method, the steels are heated above A3 critical temperature and held for a relatively long time, followed by several rolling passes. The final pass of reduction is done with a low finish rolling temperature at or about A3 critical temperature. Subsequently, the samples underwent oil quenching or cooling down to coiling temperatures and furnace cooling [19].
Finish rolling temperatures, coiling temperatures and cooling rates after rolling influence the mechanical properties and final microstructures of dual-phase steels. At a higher finish rolling temperature, the final microstructures contain coarse-grained phase, like acicular ferrite; while, the lower coiling temperature contributes to more deformed and rather coarse-grained ferrite and a small amount of martensite in final microstructures. Moreover, the increased coiling temperature improves the yield strength and decreases the ultimate tensile strength, thereby improving the yield strength to ultimate tensile strength ratio (YS/UTS). This trend is attributed to the auto-tempering of martensite and the carbide precipitates in ferrite matrix as the coiling temperature is increased.
2.1.3 Batch annealing
For batch annealing, the heat treatment is similar to continuous annealing; its soaking time is much longer and heating/cooling rates are much slower. This annealing process with slower cooling rates makes it possible for the use of the steels with high level alloying elements and high hardenability [8].
2.2 ALLOYING ELEMENTS
The alloying elements, such as manganese, silicon, chromium, molybdenum, and vanadium used in dual-phase steels can affect grain refinement, hardenability and the formation and morphology of particles. Besides, these alloying elements can influence the tensile strength by solid solution strengthening and precipitation hardening mechanisms, especially the ferrite.
2.2.1 Manganese
Manganese broadens the temperature range for stable austenite and, if added in sufficiently high concentration, the transformation temperatures AC1 and AC3 decrease and the TTT diagram shifts to the longer time, thus increasing the possibility of forming the ferrite-martensite mixtures at a relatively low cooling rate [20] [21] [22]. Besides, the addition of manganese refines the cementite and reduces the grain sizes, leading to good ductility. Furthermore, the influence of manganese segregation is to form microbands [21], and the austenite is located in the Mn-rich regions; while deformed and recrystallized ferrite develop in the Mn-poor area.
Alloying elements can influence the critical cooling rates of the intercritically formed austenite cooled from the annealing temperature in dual-phase steels. Increasing the alloying elements content decreases the logarithm of the critical cooling rates [23], shown in Figure 2.1. The amount of different alloying elements can be converted into Mn equivalent content (MneqO ), which can be obtained by Equation (2-1). The relationship between the critical cooling rate (CRO) and Mn content (MneqO ) can be attained by equation (2-2).
logCRO(℃/s) = −1.73Mn eq
O + 3.95 (2-2)
Figure 2.1 Relationship between the critical cooling rates and alloying elements [23]
2.2.2 Silicon
The addition of silicon influences the microstructures and mechanical properties of dual phase steels. Si can promote the formation of ferrite [24] [25] [26], decrease the ferrite grain sizes and change the ferrite shape from irregularity to equiaxed shape. The increasing the amount of Si improves the yield strength, because of hard solid solute strengthening related to the high content of Si and the ferrite grain refinement caused by the addition of Si. The increase in the amount of Si contributes to improving the tensile strength [27], uniform elongation, total elongation, and strain hardening ratio. Therefore, the product of ultimate tensile strength × total elongation increases with increasing Si content [1].
2.2.3 Chromium and molybdenum
Molybdenum can influence the shape of CCT diagram; it helps to delay the bainite start and bainite finish, to retard pearlite start, and to increase the pearlite finish temperature, thus separating the pearlite-ferrite transformation region and bainite transformation region [28]. Because the dual-phase steels often undergo isothermal holding at zinc pot temperature (460℃), a part of martensite would be replaced by bainite. As a result, the tensile strength would be decreased and the yield strength and ductility could be improved, leading to increasing the YS/UTS ratio and strain hardening ratio. Therefore, when the dual-phase steels are annealed by the galvanizing process, the addition of Mo enables austenite to avoid transformation into bainite or pearlite, ensuring the ferrite-martensite microstructures after annealing.
Figure 2.2 shows the relationship between mechanical properties, such as tensile strength, yield strength, yield strength to tensile strength ratio (YS/UTS), uniform elongation, and total elongation, of Cr-bearing steels and cooling rates. The increasing cooling rate results in increasing tensile strength and decreasing total elongation. As the Cr is increased, both the yield strength and YS/UTS decrease at any cooling rate [23]. Furthermore, the addition of Cr can promote the partitioning of C between austenite and ferrite, thereby decreasing the dissolved carbon content. In addition, the tensile strength of dual-phase steels is dependent on the volume fraction of martensite, which is not only based on carbon content and annealing temperature, but also on the hardenability of austenite. The addition of Cr, Mn and V match the requirement for the hardenability to the cooling rate [29].
Figure 2.2 Effect of cooling rate on yield and tensile strengths, YS/UTS, yield point elongation and total elongation in Cr-bearing steels [23]
2.2.4 Vanadium
The effects of vanadium used in dual-phase steels are characterized by three factors; the high solubility of vanadium carbonitrides in austenite [30] [31] [32], the low solute drag coefficient of vanadium and the positive interaction of vanadium with nitrogen [30]. The high solubility of vanadium carbonitrides results in remarkable castability with minimum cracking and reduction of the reheating temperature. The excellent precipitation hardening behavior of vanadium carbonitrides is also attributed to the high solubility of vanadium carbonitrides. The low solute drag coefficient contributes to refining austenite grains [33] and minimizing the temperature and the deformation requirements for recrystallization. In addition, because vanadium is the only alloying element that can strengthen steel as nitride precipitates [1], and the solubility of vanadium
carbides is higher than that of vanadium nitrides (Figure 2.3), nitrogen can be used effectively for precipitation hardening at different levels of carbon content.
Figure 2.3 Solubility products, in atomic per cent, of carbides and nitrides in austenite as function of temperature [34]
2.3 MECHANICAL PROPERTIES OF DUAL PHASE STEELS
Dual-phase steels are characterized by a microstructure comprising of ferrite, martensite and a third phase, such as bainite, tempered martensite and retained austenite, leading to high tensile strength, continuous yielding, a low YS/UTS ratio, a high strain hardening rate and good ductility [29] [35] [36] [37]. These unique properties are controlled by volume fraction of martensite, ferrite grain sizes, and fine precipitates in the ferrite matrix [1]. [38]
Figure 2.4 The relationship between the strengths and percent martensite as well as the distribution of strengths of the fine-grained and the coarse-grained for the Fe-Mn-C alloys [29]
Figure 2.4 shows the relationship between strengths (yield strength and ultimate tensile strength) and volume fraction of martensite. It is obvious that the strength and martensite content have a positive linear relation; thus, increasing the volume fraction of martensite improves both yield and tensile strengths. Besides, according to Figure 2.4, the strengths of refined grains lie above the yield and tensile strength lines; while the strengths of coarse grains are below the two strength lines, which means the strength of dual-phase steels is also dependent on grain size.
Figure 2.5 The relationship between uniform elongation and tensile strength [29]
Figure 2.5 represents the relationship between uniform elongation and tensile strength. It is obvious that uniform elongation is the function of tensile strength; the increasing tensile strength decreases the uniform elongation [38]. In Figure 2.5, at given tensile strength, the uniform elongation of fine-grained steels is better [38]. Thus, the ductility of dual-phase steels is also controlled by grain sizes.
2.3.1 Yield and tensile strengths
When the volume fraction of martensite or the strength of martensite is increased, it is expected that both yield strength and tensile strength would be improved, following the rule of mixtures. The yield strength and tensile of ferrite-martensite mixed dual-phase steels can be obtained by the Equation (2-3) and (2-4) [9].
SYO = SY,αO �100� + SPα Y,mO �100�Pm (2-3)
STO = ST,αO �100� + SPα T,mO �100�Pm (2-4)
where, SYO is the yield strength of dual-phase steels, SY,αO is the yield strength of ferrite, Pα/100 is the volume fraction of ferrite, SY,mO is the yield strength of martensite, Pm/100 is the volume fraction of martensite, STO is the tensile strength of dual-phase steels,ST,αO is the tensile strength of ferrite, and ST,mO is the tensile strength of martensite.
Tumara [39] proposed parameter C,
Because the yield strength for ferrite-martensite mixture did not match the Equation (2-3), except when Pα = Pm. If C < 3, the yield strength fits the equation; while if C > 3, initially the yield strength increased lineally with the increasing of the amount of martensite, and the yield strength increased far away from the trend.
C = SY,m/SY,α (2-5)
Davies [29] found the Equation (2-4) was always correct at any volume fraction of martensite. Speich and Miller [40] put forward the linear relationship between yield and tensile strengths and volume fraction of martensite, which can be expressed in Equation (2-6) and (2-7).
SY,m= SY,αO + �13 SOY,m− SY,αO � �100�Pm (2-6)
ST,m= ST,αO + �13 SOT,m− SY,αO � �100�Pm (2-7)
Leslie and Sober [41] proposed an equation, which illustrated the positive linear relationship between the yield strength of martensite and the carbon content in martensite.
SY,mO (MPa) = 620 + 258Cm (2-8)
where, Cm is the carbon content in martensite and Cm can be expressed in Equation (2-9).
Cm= 100(Co/Pm) (2-9)
2.3.2 Work hardening behavior
Work hardening behavior can be expressed by Equation (2-10) [42], which illustrated the relationship between the true stress and true strain.
σ = Kεn (2-10)
where, σ is true stress, K is strength coefficient, ε is true strain and n is work hardening exponent. Taking the logarithm of both sides of Equation (2-10), work hardening exponent n can be obtained by Equation (2-11). This model is Hollomon model.
n = d(ln σ)d (ln ε) (2-11)
From the ln σ versus ln ε curve, n is the slope of the curve. Earlier research [43] [44] [45] exhibited nonlinear variation of ln σ versus ln ε, which illustrated work hardening of dual phase steels happened in two stages.
Work hardening ratio also can be expressed by Equation (2-12), utilizing the differential Crussard-Jaoul (C-J) analysis [46] [47] [48]. C-J model is the extension of Hollomon model, which includes the yield strength σo, allowing better modeling of plastic region [49].
where, σo and K are materials constant. After logarithmic differentiation with respect to ε, the Equation (2-13) is given.
ln �dσdε� = ln(Kn) + (n − 1)lnε (2-13)
Compared with other models, differential C-J analysis is more accurate, because n and K can be obtained from ln �dσ
dε� versus lnε curves. The plot of ln � dσ
dε� versus lnε showed that there were three work hardening stages of dual phase steels [50]. These three work hardening stages were attributed to different deformation mechanisms. Stage I consisted of deformation in the ferrite matrix with the high density of dislocation near the ferrite/martensite area [46] [50]. Stage II comprised reduced work hardening ascribed to the deformation of less ferrite with possible transformation from retained austenite to martensite [50]. In terms of stage III, both ferrite and martensite were deformed with attendant cross-slip and dynamic recovery in ferrite [51].
The modified Crussard-Jaoul (C-J) analysis of work hardening behavior was expressed in Equation (2-14).
ε = εo+ cσm (2-14)
where, εo and c are materials constant, m is the inverse of the work hardening exponent. After logarithmic differentiation with respect to σ, the Equation (2-15) was given.
ln �dσdε� =(1 − m) ln σ − ln (cm) (2-15)
Earlier research revealed two work hardening stages, when the modified C-J analysis was used to investigate the work hardening behavior of dual-phase steels. Two deformation mechanism contributed to these two stages. In stage I, the ferrite with a high density of lattice defects near
the martensite region was deformed. Stage II consisted of the deformation of martensite and hardened ferrite.
2.4 STRENGTHENING MECHANISMS
2.4.1 Grain-size strengthening
The Hall-Petch equation was proposed by Hall [52] and Petch [53], which illustrates the relationship between the yield strength and grain sizes.
σy = σo+ kD−1/2 (2-16)
where, σy is yield strength, σo is frictional stress that can move the dislocation, k is the materials constant and D is the grain size. In terms of σo, it is related to the undeformed single crystal [54]. While, for the deformed crystal, the Hall-Petch can be rewritten in Equation (2-17), at any strain [55].
σ(ε) = σo(ε) + k(ε)D−1/2 (2-17)
σo(ε) is independent on grain sizes and it is the flow stress of the grain interior [55]; while
k(ε)D−1/2 depends on grain sizes, and it is the strength attributed to the resistance of the movement of dislocation near the grain boundaries. Equation (2-17) can be expressed by Equation (2-18).
where, M is Taylor factor, α is a number, G is shear modulus, b is Burgers vector, SV is grain boundary area per volume and θ is misorientation angle. At high strain, the low angle grain boundaries (LAGBs) transform into high angle grain boundaries (HAGBs) [56], so the Equation (2-18) can be rewritten by Equation (2-19).
σ = σo+ MαG�1.5b(SVθ)LAGB+ k(ε)DHAGB−1/2 (2-19)
2.4.2 Precipitation hardening
Finely distributed precipitates have an effective barrier to the movement of dislocations. There are two ways of interpreting the interaction between precipitates and dislocations; dislocations bypass the ‘hard’ particles (shown in Figure 2.6) and dislocations cut through the ‘soft’ particles [57] (shown in Figure 2.7).
Figure 2.6 Dislocations bypass the particles [58]
Figure 2.8 showed the balance of forces between the dislocation line tension T and the resisting force of the particle F. And the relationship of T and F can be expressed by Equation (2-20).
F = 2T sin θ (2-20)
when sin θ = 1, the resisting force reached the maximum value. And if F > 2T, dislocations would bypass the particles. However, if F < 2T, dislocations would shear the particles.
Figure 2.8 Balance of forces acting during particle resistance to dislocation movement [58]
In terms of hard particles, Orowan [59] and Ashby [60] put forward Equation (2-21).
∆σy = (0.538Gbf 1
2/X)ln (X/2b) (2-21)
where, ∆σy is the increase in the yield strength, G is shear modulus of the matrix, b is Burgers vector of dislocations, f is the volume fraction of particles and X is the diameter of particles [61].
From this equation, increasing volume fraction of particles and reducing the diameters of particles resulted in the increase of precipitation strengthening.
In the case of soft particles, there are several effects involved in the precipitation hardening. The deformed particle can lead to an increase in the particle/matrix interfacial energy. The movement of a dislocation through a particle may produce an antiphase boundary with disordering energy or stacking fault energy [58]. So, this effect is called chemical hardening [58]. Mott and Nabarro [62] described coherency strain hardening. The displacements associated with dislocations interact with the coherency strain provide a better strengthening effect than the dislocations alone. The effect of chemical hardening can be expressed by Equation (2-22)
∆τy = (γ 1
2/b)(4rsf/πT)1/2 (2-22)
where, τy is the increase in the yield stress, γ is the antiphase grain boundary, b is Burgers vector of dislocations, rs is the average particle radius, f is the volume fraction of particles and T is dislocation line tension. The chemical hardening is related to particle diameters, so the Equation (2-22) can be rewritten by Equation (2-23)., in terms of smaller particles.
∆τy = 4.1Gε 3
2(rf/b)1/2 (2-23)
However, for the larger particles, Equation (2-22) can be rewritten by Equation (2-24).
∆τy = 0.7Gf 1
2ε14(b/r)3/4 (2-24)
Therefore, in the case of smaller particles, the increasing particle diameters improve the strengthening effect; for larger particles, the increasing particle sizes decreases the internal stress.
2.5 FORMATION OF AUSTENITE
The final microstructures of dual phase steels comprise soft ferrite and hard martensite. During intercritical annealing, a ferrite-austenite structure forms, in which the austenite transforms into martensite after rapid cooling [63]. Because the volume fraction of martensite is proportional to the tensile strength of DP steels, the formation of austenite during intercritical annealing is critical, which was investigated by many researchers.
Speich [64] proposed three steps for austenite formation; 1) nucleation of austenite in the pearlite and the grain-boundary cementite particles, followed by rapid growth until the cementite dissolves; 2) slower growth of austenite into ferrite at a rate controlled by the diffusion of carbon in austenite at high temperatures and by manganese diffusion in ferrite at low temperatures; 3) a very slow equilibrium of ferrite and austenite in austenite. Garcia and DeArdo [65] investigated the austenite formation from different initial microstructural conditions, including spheroidized Fe3C in a recrystallized ferrite matrix, spheroidized Fe3C in a cold worked ferrite matrix and lamellar ferrite-pearlite structure. They found that austenite formed at ferrite/ferrite grain boundaries for all initial conditions; 1.5 pct. manganese lowered the AC1 and AC3 critical temperatures, thereby increasing the volume fraction of austenite; the austenite formation rate from cold rolled ferrite was faster than that from recrystallized ferrite and ferrite-pearlite structure. Huang [11] found that the heating rates have effects on the nucleation and growth of austenite for both hot rolled and cold rolled steels. The interaction between austenite formation and ferrite recrystallization was complicated. When the recrystallization of ferrite completed before the formation of austenite, austenite would be distributed randomly in the ferrite matrix.
fγ= 1 − exp (−ktn) (2-25)
where, fγ is the volume fraction of austenite, k is the rate constant dependent on annealing temperatures, t is annealing time and n is Avrami’s exponent. Asadabad [63] found that increasing annealing time improved the volume fraction of austenite until it reached the maximum value and subsequently austenite volume fraction would not change as time increased; increasing annealing temperature increased the volume fraction of austenite; a new JMA model
fγ/fe = 1 − exp (−ktn) was put forward to investigate the relationship between volume fraction of austenite and annealing time at different annealing temperatures in the time of intercritical annealing.
3.0 STATEMENT OF OBJECTIVE
This study focuses on the processing, microstructures and properties of ultra-high strength, low carbon and V-bearing dual phase steels on continuous galvanizing lines. The effects of several factors, such as coiling temperatures, cold reduction, intercritical annealing temperatures, and annealing paths, on the properties of dual-phase steels would be investigated. To obtain the structure-property relationship, several characterization methods would be used. In addition, the computer-based simulation would be applied to investigate the phase transformation process.
First, JMatPro thermos-physical and physical properties software will be utilized to study the behavior of new austenite during coiling and cooling and estimate the final microstructures of hot band at different coiling temperatures. In addition, the microstructures, micro hardness and stored energy of received cold rolled steels will be analyzed to investigate the effects of different pre-annealing conditions (hot band coiling temperatures and cold reductions) on microstructures and properties of CR steels.
In the second part, the mechanical properties, including tensile strength, yield strength, YS/UTS ratio, total elongation, UTS × TE, hole expansion ratio and work hardening exponent, of annealed dual phase steels would be investigated so as to reveal the effects of coiling temperatures, cold reduction, annealing temperatures and annealing paths on these unique properties.
In the third section, in order to have a deeper understanding of structure-property relationships of annealed DP steels, the final microstructure characterizations would be conducted with optical microscope, electron scanning microscope and electron backscatter diffraction.
Finally, the nanohardness of annealed dual-phase steels would be measured to study the relationship between the volume fraction of martensite and the nanohardness of martensite and to reveal whether tensile strength can be controlled by martensite hardness.
4.0 EXPERIMENTAL PROCEDURES
4.1 CHEMICAL COMPOSITIONS OF MATERIALS
The chemical compositions obtained of the candidate steels are given in the Table 4.1. Following previous BAMPRI studies, low carbon (0.15 w.t%), high chromium (0.5 w.t%) and molybdenum (0.3 w.t%) and addition of vanadium (0.06 w.t%) are chosen in this study.
Table 4.1 Chemical compositions of materials (w.t%)
Elements C Mn P S Si Cr Mo V Ti Al N Nb
0.15 1.8 0.01 0.003 0.4 0.5 0.3 0.06 0.005 0.025 0.006 0.005
4.2 THERMOMECHANCAL PROCESS
The whole thermomechanical process is represented in Figure 4.1. In the rough rolling section, the ingots were heated to 1250℃ and then rough rolled on a pilot scale hot rolling to the thickness of 25 mm (1 inch), followed by cooling down to room temperature. Furthermore, the steels were reheated to 1250℃ and hot rolled, after five passes reduction, each of which was 27.5%, to 5 mm (0.2 inch), with the finishing temperature of 920℃. After finishing rolling, the steels were
by cooling to room temperature. After hot rolling, the hot rolled coils were cold rolled to the thickness of 1.25 mm (0.05 inch) with 58% cold reduction or to the thickness of 0.85 mm (0.03 inch) with 72% cold reduction.
In order to define optimum annealing temperature, four cold rolled steels 5M (CT=500℃, CR=58%), 6M (CT=650℃, CR=58%), 5N (CT=500℃, CR=72%)and 6N (CT=650℃, CR=58%) were reheated to four annealing temperatures (790℃, 770℃, 750℃ and 730℃) at 5℃/s. And after soaking for 60s, they were water quenched to room temperature. The volume fraction of martensite were measured (given in Table 4.2) and plotted in Figure 4.1. The dual-phase steels containing 50% - 60% volume fraction of martensite had a combination of high tensile strength and good ductility, and after full annealing process, 10% - 15% martensite would be lost. Therefore, 60% - 80% volume fraction of austenite was desirable during intercritical annealing and after full annealing process some austenite would transform into non-martensitic structures and 50%-60% of martensite would be formed. From the pre-annealing treatment results, Vm of dual-phase steels annealed at 770℃ and 750℃ ranged from 60% to 80%, so 770℃ and 750℃ were chosen as annealing temperatures.
Table 4.2 Defining optimum annealing temperature Designation CT (℃) CR (%) IAT (℃) Vm (%) 5M 500 58 790 77.81 6M 650 58 790 72.03 5N 500 72 790 88.51 6N 650 72 790 84.49 5M 500 58 770 69.82 6M 650 58 770 67.26 5N 500 72 770 77.81 6N 650 72 770 74.00 5M 500 58 750 59.57 6M 650 58 750 52.12 5N 500 72 750 57.42 6N 650 72 750 59.44 5M 500 58 730 - 6M 650 58 730 41.83 5N 500 72 730 - 6N 650 72 730 45.92
Figure 4.1 Volume fractions of martensite at different annealing temperatures
After cold rolling, these steels were machined and prepared for the simulation of annealing process, using a 3800 Gleeble. There were two annealing process in this study; one was standard galvanizing (F1) and the other one was supercool processing (G1), shown in the Figure 4.2. In each of two annealing paths, the samples were reheated to 770℃ or 750℃ at a heating rate of 5℃/s and soaked for 60s, followed by cooling down to different temperatures at a cooling rate of 15℃/s. In standard galvanizing, the steels were cooled to zinc pot temperature (460℃), followed by holding for 15s, and cooled to room temperature at a cooling rate of 10℃/s afterward. In supercool processing, the samples were cooled to 200℃, and after being held for 20s, they were up quenched to 460℃ and held for15s. After soaking, the steels were cooled to room temperature at 10℃/s. In terms of standard galvanizing, there was a three-stage cooling from intercritical annealing temperature (IAT) to room temperature, shown in Figure 4.2. The purpose of stage one (fast cooling from IAT to Zinc pot temperature) was to avoid the formation of new ferrite; stage two (a short holding time at zinc pot temperature) was designed to avoid the
formation of new bainite; stage three (fast cooling from zinc pot temperature to room temperature) aimed to form more martensite. For supercool processing, there was a five-stage treatment from IAT to room temperature. Stage one (fast cooling from IAT to supercool temperature) was designed to avoid the formation of new ferrite; the purpose of stage two (20 seconds holding at supercool temperature) was to form more martensite; stage three (up quenching from supercool temperature to zinc pot temperature) aimed to form tempered martensite; the goal of stage four (a short holding time at zinc pot temperature) was to avoid the formation of new ferrite and bainite; stage five (fast cooling from zinc pot temperature to room temperature) was to obtain more fresh martensite.
In this study, five factors should be taken into consideration based on both chemical compositions and thermomechanical process.
1) Compositions (0.15 w.t% carbon, high chromium, high molybdenum and addition of vanadium)
2) Coiling temperature (650℃ and 500℃) 3) Cold reduction (58% and 72%)
4) Annealing temperature (770℃ and 750℃)
5) Annealing path (standard galvanizing and supercool processing)
In terms of intercritical annealing, critical temperatures were predicted by JMatPro. There were two CCT curves of new austenite shown in Figure 4.3. The left one was the CCT curve of intercritical austenite with annealing temperature of 750℃; the right one was the CCT curve of intercritical austenite annealed at 770℃. Taking the annealing temperature of 770℃ as an example, the equilibrium at AC3 (AC3=770℃) was assumed. The red line represented the
cooling rate was 15℃/s and this fast cooling rate avoided the formation of new ferrite; at zinc pot temperature, there was a shot time holding, which avoided the formation of new bainite; form zinc pot temperature to room temperature, the fast cooling with cooling rate of 10℃/s ensured the formation of more martensite. In addition, the Bs, Ms, M50 and Mf temperatures were obtained from Figure 4.3 and given in Table 4.3
The tested samples were designated and given in Table 4.4, based on different coiling temperatures (CT), cold reduction (CT), intercritical annealing temperatures (IAT) and annealing paths.
Figure 4.2. Schematic of thermomechanical process
Table 4.3 Critical temperatures of annealed dual phase steels, as the intercritical temperatures chosen 770℃ and 750℃, estimated by JmatPro
IAT Bs Ms M50 M90
770 491 319 284 202
Figure 4.3 CCT of intercritical austenite during cooling, assuming the equilibrium at AC3 (770℃ or 750℃)
Table 4.4 Designation of tested samples based on different coiling temperatures (CT), cold reduction (CT), and intercritical annealing temperatures (IAT)
Designation CT(℃) CR(%) IAT(℃) IHT(s)
5M7J 500 58 750 15 5M8J 500 58 770 15 6M7J 650 58 750 15 6M8J 650 58 770 15 5N7J 500 72 750 15 5N8J 500 72 770 15 6N7J 650 72 750 15 6N8J 650 72 770 15
4.3 EQUIPMENT AND FACILITIES
4.3.1 Optical microscopy
Optical microscopy, consisting of a system of lens, was applied to magnify and observe the microstructures of tested samples.
Samples were cut into tiny pieces by using a Buehler Isomet 1000 diamond cutting saw and mounted with Bakelite and copper powder. The mount was ground on silicon carbide abrasive paper, ranging from 600-1200 grit, followed by polishing with 0.05 µm alumina on polishing cloths in a vibrating polisher machine. After polishing, the surfaces of tested samples were etched by different etchants to reveal distinct microstructures. 2% Nital (98 ml pure ethanol mixed with 2 ml nitric acid) was applied to distinguish the ferrite and martensite, since it could help to reveal the ferrite grain boundary in low carbon steels. Lepera, a mixed solution of 50 ml of 1% Na2S2O5 in distilled water and 50 ml of 4% picric acid in ethanol, was also utilized to reveal ferrite - martensite microstructures.
After sample preparation, a Sony digital camera attached to a Nikon Microscope, shown in Figure 4.4, was used to observe and capture the images of the microconstituent. ImageJ, an image analysis software, was applied to measure, calculate and analyze the average ferrite grain size and volume fraction of martensite, tempered martensite and bainite dependent on the OM images.
Figure 4.4 Sony digital camera attached to a Nikon Microscope
4.3.2 Scanning electron microscopy and electron backscatter diffraction
Although OM is widely regards as an effective tool for metallurgical analysis, there are some special conditions where the images captured by OM are less useful. Because average ferrite grain sizes of tested samples were very small, the grain sizes could not be measured and calculated more precisely through the images captured by OM, even though the magnification of those images was 2000X. Besides ferrite and martensite, there were some other structures, such as bainite, retained austenite and tempered martensite, obtained in the final microstructures of tested samples. These microstructures would not be distinguished by OM, so morphology analysis needed to be used to reveal them.
ZEISS Sigma 500 VP SEM with Oxford Aztec X-EDS and FEI Apreo SEM, shown in Figure 4.5, were used in this research. The samples used in the SEM were ground, polished and etched by 2% Nital.
Figure 4.5 FEI Apreo SEM
Electron backscatter diffraction was also used in this study to obtain essential information, such as structure, crystalline orientation, stored energy, grain morphology, and dislocation density of tested samples. The scanned samples, after being ground and polished manually, were polished by vibrating polisher machine for more than four hours, in order that any scratches on the surface of the samples would be eliminated. The prepared samples were placed into the SEM chamber and tilted about 70º from the electron beam. The EBSD detector was inserted afterward, and in terms of EBSD canning, 20kV voltage, 15 beam spot size and 0.1 µm step size were applied. After scanning, the EBSD data were analyzed by TSL OIM analysis software.
4.3.3 Tensile test
The tensile test provides significant mechanical properties, yield strength (YS), ultimate tensile strength (UTS), uniform elongation (UE), total elongation (TE) and n value (n) of the tested materials [67]. In this research, UTS and TE are two critical factors that are frequently used to
compare and select materials. The tested steels were cut and machined to subsize specimens based on ASTM E8 standard. Figure 4.6 shows the schematic of sheet tensile test samples.
Figure 4.6 Schematic of sheet tensile test samples [68]
In Figure 4.6, G is gage length, W is the width of cross section, T is the thickness, R is radius of fillet, L is the total length of the sample, A is the length of reduced section, B is the length of grip section and C is the width of grip section [68]. In this study, original gage length was machined to10 mm (0.4 in) and width of cross section was 6mm (0.24 in). The thickness varied with the cold reduction; the thickness was 1.25mm (0.05 in) with cold reduction of 58%, while the thickness was 0.85 (0.03 in) when cold reduction was 72%.
4.3.4 Vickers hardness test and nano hardness test
The Vickers hardness test provides the microhardness of tested materials, which has a roughly linear relationship with tensile strength. A Leco M-400 G microhardness tester was applied with a load of 300g. Five indents were performed on the quarter position of the surface of each tested specimen. The hardness data were collected by tester itself and the average and standard deviation of microhardness of each sample were calculated and analyzed by Excel math functions.
Nano hardness test was used to determine the hardness of both ferrite and martensite of steels in different pre-annealing conditions and annealing procedures and to find out the relationship between volume fraction of martensite and hardness of martensite. Compared with conventional Vickers hardness test, the load and the size of the nanoindenter are considerably smaller. Therefore, the nanoindentations can be placed in the center of both ferrite grains and martensite islands to ensure the accuracy of the data. Before testing, the polished samples were slightly etched by 2% Nital and observed by OM to find out the appropriate tested area, which was surrounded by several markers afterward, utilizing Vickers hardness tester. The samples were polished in vibrating polisher machine for several minutes to eliminate the etched surface, while the markers were remained. After sample preparation, specimens were tested by Hysitron TriboIndenter, shown in Figure 4.7. In each of tested steels, twenty-five nanoindenters were performed with a pattern of 5 rows × 5 columns, and the spacing of each indenter is 4 µm with a load of 2000 µN. Furthermore, after testing, each sample was slightly etched again, and observed by SEM to examine the twenty-five nanoindentations.
4.3.5 Hole expansion ratio test
Hole expansion ratio (HER) test is commonly used to evaluate the edge cracking resistance of advanced high strength steels (AHSS). It is a significant indicator for the shear edged ductility of dual phase steels.
In this study, the HER blanks were heat treated by Gleeble, followed by punching a hole of 10mm diameter in the center. Before testing, the initial diameters of punched holes were measured five times. Subsequently, HER blanks were placed on the testing apparatus [69] and deformed by a conical punch with a speed of 0.3mm/s. When a crack propagated the whole thickness of the HER blanks, the test was stopped. After test, the final diameters of holes were also measured five times. Thus, the hole expansion ratio can be expressed by Equation (4-1).
λ =DfD− Do
o × 100%
(4-1)
where, λ is the hole expansion ratio, Df is the hole diameter after test and Do is the original hole diameter. The process of hole expansion test is shown in Figure 4.8.
4.3.6 Vibrating sample magnetometer
To have accurate determination of volume fraction of retained austenite, a LakeShore vibrating sample magnetometer (VSM) was used in this study, shown in Figure 4.9. The saturation magnetization can be obtained in the magnetic curve and the volume fraction of retained austenite can be calculated by the difference of samples with and without retained austenite [70], since martensite, ferrite as well as cementite are ferromagnetic, while austenite is paramagnetic [71]. The volume fraction of retained austenite can be expressed by Equation (4-2).
fγ = 1 − βMMs(c) s(f)
(4-2)
where, fγ is the volume fraction of retained austenite, Ms(c) is the saturation magnetization of samples containing austenite, Ms(f) is the saturation magnetization of samples without austenite and β is related to saturation magnetization of martensite, ferrite and cementite and the volume fraction of cementite [1]. When the volume fraction of cementite precipitates is negligible, the β can be regards as one.
The samples were machined into cubes with dimension of 1mm × 3mm × 5mm (thickness, width and length). In the VSM, samples were magnetized by a uniform filed created between the electromagnetic poles, which caused samples to generate their own magnetic fields. When samples underwent sinusoidal motion, like mechanical vibration, the sensing of detection coils induced electric current in these coils. The sample’s magnetic moment was measured by measuring electric current induced by detection coils. The volume fraction of retained austenite was calculated by the changes between the maximum magnetic moment of the sample containing
5.0 RESULTS
5.1 RESULTS OF COLD ROLLED STEELS
In the pre-annealing condition, the steels were designated dependent on the different coiling temperatures and cold reductions, as given in Table 5.1.
Table 5.1 Designation of cold rolled steels based on different coiling temperatures (CT) and cold reductions (CR)
ID CT(℃) CR(%) ID CT(℃) CR(%)
5M 500 58 5N 500 72
6M 650 58 6N 650 72
The microstructures of received cold rolled DP steels are shown in Figure 5.1. Figure 5.1 a) and b) represent the cold rolled steels with the same low cold reduction (58%) but with different coiling temperatures. In the higher coiling temperature (650℃), the microstructures consist of polygonal ferrite, pearlite and bainite. The ferrite grains are coarser and the amount of pearlite is larger than the cold rolled steels with lower coiling temperature (500℃). In terms of lower coiling temperature, acicular ferrite, pearlite, and bainite can be observed in the final microstructures. It is obvious that, after 58% cold reduction, ferrite and pearlite are elongated along the rolling direction in the microstructures of cold rolled steels with different coiling temperatures.
Furthermore, Figure 5.1 c) and d) show the cold rolled steels with the same higher cold reduction (72%) but with different coiling temperatures. Compared with lower cold reduction, the ferrite grains and pearlite are deformed and elongated remarkably, the ferrite grains are compressed so tightly that ferrite grain boundaries are not easily observed.
Figure 5.1 OM images of microstructures of cold rolled steels, etched by 2% Nital, a) 5M (CT=500℃, CR=58%), b)
6M (CT=650℃, CR=58%), c) 5N (CT=500℃, CR=72%), d) 6N (CT=650℃, CR=72%)
Table 5.2 Vickers hardness (300gf) of cold rolledsteels with different coiling temperatures (CT) and cold reductions (CR)
ID CT(℃) CR(%) VHN(HV) ID CT(℃) CR(%) VHN(HV)
5M 500 58 369±6 5N 500 72 406±5
Figure 5.2 Stored energy of cold rolled steels, a) 5M (CT=500℃, CR=58%) IPF (with HAGB), b) 5M SE=5.01J/cm3,
c) 6M (CT=650℃, CR=58) IPF (with HAGB), d) 5M SE=5.13J/cm3, e) 5N (CT=500℃, CR=58%)IPF (with HAGB),
Table 5.3 Stored Energy (J/cm3) in Cold Rolled Steels Before Annealing ID CT(℃) CR(%) GB Matrix Total 5M 500 58 0.56 5.01 5.57 6M 650 58 0.52 5.13 5.65 5N 500 72 0.75 5.72 6.47 6N 650 72 0.72 5.60 6.32
The inverse pole figures of cold rolled steels are given in Figure 5.2 a), c), e) and g), and the meaning of different colors are represented by the color triangle at the end of the Figure 5.2. When the cold reduction is 58%, the ferrite grains are deformed along the rolling direction. Figure 5.2 a) and b) compare the ferrite grain sizes at different coiling temperatures, illustrating that the higher coiling temperature results in ferrite grain coarsening. It is obvious that ferrite grains are deformed and elongated more along the rolling direction with the increasing of the cold reduction from Figure 5.2 a) and c). The ferrite grains are highly compressed when the hot rolled coils are 72% cold rolled. The stored energy, the combination of sub-grain method and EBSD data of cold rolled steels are shown in Figure 5.1.2 b), d), f) and h), and it is obvious that the combination of low coiling temperature and high cold reduction can have the highest stored energy, which could provide more driving force for the formation of austenite [1] and ferrite recrystallization at a short time during intercritical annealing. The stored energies of grain boundary and matrix are given in Table 5.3. Because stored energy is the sum of the energy stored in the grain boundaries and sub-grain boundaries in the ferrite matrix. From Table 5.3, the combination of low coiling temperature and high cold reduction had the highest stored energy both in grain boundaries and sub-grain boundaries in ferrite center.
5.2 RESULTS OF ANNEALED STEELS
5.2.1 Mechanical Properties
All the engineering stress-strain curves of annealed steels with different coiling temperatures, cold reductions, intercritical annealing temperatures and annealing paths are represented in Figure 5.3 and Figure 5.4.
Figure 5.3 left and Figure 5.4 left show the engineering stress and strain curves with low cold reduction (58%) and Figure 5.3 right and Figure 5.4 right represent the engineering stress and strain curves with high cold reduction (72%). And from these four figures, the tensile strengths of specimens with 72% cold reduction are higher than those of steels with 58% cold reduction, while the total elongations with different cold reductions are similar.
According to these four figures, the red flow curves and blue flow curves stand for the steels annealed at high intercritical annealing temperature (770℃); while green and black curves represent the specimens annealed at low intercritical annealing temperature (750℃). It is obvious that the tensile strengths of steels annealed at high annealing temperature (770℃) are higher than the those of steels annealed at low annealing temperature (750℃).
When compared with the flow curves of samples with supercool processing (G1), those of steels annealed by standard galvanizing (F1) have higher tensile strength and lower total elongation. All these differences are due to different final microstructures, volume fraction of different phases and grain sizes, which will be discussed below.
Figure 5.3Engineering stress-strain curve of annealed steels with cold reduction of 58% (left) and cold reduction of 72% (right) annealed by standard galvanizing (F1)
Figure 5.4 Engineering stress-strain curve of annealed steels with cold reduction of 58% (left) and cold reduction of 72% (right) annealed by supercool processing (G1)
Tensile strength (UTS)
All the tensile strengths of different coiling temperatures, cold reductions, intercritical annealing temperatures, and annealing paths are plotted in Figure 5.5. It is obvious that all the tensile
![Figure 2.1 Relationship between the critical cooling rates and alloying elements [23]](https://thumb-us.123doks.com/thumbv2/123dok_us/1403014.2687819/21.918.239.682.160.527/figure-relationship-critical-cooling-rates-alloying-elements.webp)
![Figure 2.2 Effect of cooling rate on yield and tensile strengths, YS/UTS, yield point elongation and total elongation in Cr-bearing steels [23]](https://thumb-us.123doks.com/thumbv2/123dok_us/1403014.2687819/23.918.267.647.109.486/figure-effect-cooling-tensile-strengths-elongation-elongation-bearing.webp)
![Figure 2.3 Solubility products, in atomic per cent, of carbides and nitrides in austenite as function of temperature [34]](https://thumb-us.123doks.com/thumbv2/123dok_us/1403014.2687819/24.918.342.578.225.537/figure-solubility-products-carbides-nitrides-austenite-function-temperature.webp)
![Figure 2.4 The relationship between the strengths and percent martensite as well as the distribution of strengths of the fine-grained and the coarse-grained for the Fe-Mn-C alloys [29]](https://thumb-us.123doks.com/thumbv2/123dok_us/1403014.2687819/25.918.214.708.112.486/figure-relationship-strengths-percent-martensite-distribution-strengths-grained.webp)
![Figure 2.5 The relationship between uniform elongation and tensile strength [29]](https://thumb-us.123doks.com/thumbv2/123dok_us/1403014.2687819/26.918.231.680.106.487/figure-relationship-uniform-elongation-tensile-strength.webp)