Xie, Quan (2015) Physiological and genetic
determination of yield and yield components in a bread
wheat × spelt mapping population. PhD thesis,
University of Nottingham.
Access from the University of Nottingham repository:
http://eprints.nottingham.ac.uk/28998/1/PhD%20Thesis-Quan%20Xie-University%20of %20Nottingham.pdf
Copyright and reuse:
The Nottingham ePrints service makes this work by researchers of the University of Nottingham available open access under the following conditions.
· Copyright and all moral rights to the version of the paper presented here belong to the individual author(s) and/or other copyright owners.
· To the extent reasonable and practicable the material made available in Nottingham ePrints has been checked for eligibility before being made available.
· Copies of full items can be used for personal research or study, educational, or not-for-profit purposes without prior permission or charge provided that the authors, title and full bibliographic details are credited, a hyperlink and/or URL is given for the original metadata page and the content is not changed in any way.
· Quotations or similar reproductions must be sufficiently acknowledged. Please see our full end user licence at:
http://eprints.nottingham.ac.uk/end_user_agreement.pdf
A note on versions:
The version presented here may differ from the published version or from the version of record. If you wish to cite this item you are advised to consult the publisher’s version. Please see the repository url above for details on accessing the published version and note that access may require a subscription.
PHYSIOLOGICAL AND GENETIC DETERMINATION OF
YIELD AND YIELD COMPONENTS IN A BREAD WHEAT
×
SPELT MAPPING POPULATION
By
QUAN XIE, BSc, MSc.
Thesis submitted to the University of Nottingham for the degree of Doctor of Philosophy
I
Abstract
A substantial increase in wheat yield is needed for global food security. This requires a comprehensive understanding of the physiological and genetic basis of yield determination. The present study aimed to dissect yield physiologically and genetically in a recombinant inbred line mapping population derived from bread wheat × spelt. A total of 201 traits were investigated in the field and glasshouse across three years, and these traits formed five themes: genetic variation in yield and yield components, and the usefulness of spelt as a genetic resource; tillering dynamics; biomass accumulation; flowering time and subsequent leaf senescence; and grain filling processes. Large genetic variation in all traits was found, and spelt showed many desirable traits and alleles independent of low threshability, so it can be used to broaden genetic diversity for yield improvement in bread wheat, while maintaining the free-threshing habit. Quantitative trait loci for tiller production and survival were identified, which were also affected by light environment under the canopy: low red:far red ratio (R:FR) led to early tillering cessation, few total shoots, high infertile shoot number and shoot abortion, probably resulting from an assimilate shortage due to early and enhanced stem growth induced by low R:FR. More fertile tillers normally contributed to plant yield and grain number, but reduced individual grain weight, partly because of smaller carpels and fewer stem water soluble carbohydrates at anthesis. In addition, preanthesis biomass accumulation increased yield and yield components. For grain weight, slightly early anthesis and delayed but fast leaf senescence were associated with larger grains. Carpel size at anthesis, grain dry matter and water accumulation, as well as grain morphological expansion, determined final grain weight, because of pleiotropy or tight gene linkages. These findings provide deeper insight into yield determination in wheat, and facilitate trait-based physiological and molecular breeding.
II
Acknowledgements
First, I would like to thank my supervisor Dr Debbie Sparkes, who is friendly, easy-going, patient and supportive at all times. I have received so much help from her: PhD application, settling down in UK and supervision for my study. During this project, she has given a lot of suggestions and assistance regarding experimental design, data collection and analysis, and feedback on different reports, conference abstracts, papers and thesis. The most impressive thing is the constant encouragement from her, with which I become more confident and brave about my study so that I am able to try many new ideas. I also thank my supervisor Dr Sean Mayes, who has taught me a lot about crop genetics.
This PhD project has been sponsored by the China Scholarship Council Research Excellence Scholarship, a joint funding from the China Scholarship Council (CSC) and University of Nottingham. I am very grateful to my sponsors, as this opportunity let me experience so many new things, both overseas life and academic research in a world-class institution.
I would like to thank Beat Keller (Institute of Plant Biology, University of Zurich, Switzerland) for providing the mapping population and Monika Messmer (Research Institute of Organic Agriculture, Switzerland) for providing the molecular marker data. I also thank John Alcock, Matthew Tovey, Fiona Wilkinson and Mark Meacham for their help with field trials, glasshouse experiments and laboratory work.
During this PhD, there was some hard time for me. Fortunately, my friends have always been with me. I wish to express appreciation to Menaka Fernando and her family, Ali Amamou, Thanita Boomsrangson, Yadgar Mahmood, Chuong Nguyen, Toby Townsend, Stephen Jones and Johar Roy for discussion, communications, and technical help. I thank Poh Ying Lim, Li Deng, Tingyan Peng, Ruoxin Liao and Yuqian Sun for their help and suggestions with data collection and compilation as well as statistical analysis. I also thank Chungui Lu, Guiping Sun, Valerie Owens, John Owens, Dave Sutcliffe, Jerry Griffiths and many others for their great friendship, which lets me have a wonderful life in Sutton Bonington Village in the past four years. Finally, I am indebted to my parents and brother as well as my darling Shuyang Guo for their continuous supports and love, and they have always encouraged me to go through every hard time in my life.
III
Table of Contents
Abstract ... I Acknowledgements ... II Table of Contents ... III List of Abbreviations ... IX List of Tables ... XII List of Figures ... XV
Chapter 1 ... 1
General Introduction ... 1
1.1 Wheat origin and domestication ... 2
1.2 Wheat cultivation today ... 3
1.3 Challenges for wheat production ... 4
1.4 Genetic improvement for wheat yield gain ... 5
1.5 Grain yield determination in wheat ... 6
1.6 Objectives and hypotheses of this project ... 7
1.7 References ... 10
Chapter 2 ... 15
Physiological and Genetic Dissection of Grain Yield in the Bread Wheat Forno × Spelt Oberkulmer Mapping Population ... 15
2.1 Abstract ... 16
2.2 Introduction ... 17
2.3 Materials and methods ... 20
2.3.1 Plant materials and field experiments ... 20
2.3.2 Spike traits... 22
2.3.3 Yield and yield components ... 22
2.3.4 Statistical analysis of phenotypic data ... 23
2.3.5 QTL analysis ... 23
2.4 Results ... 25
2.4.1 Phenotypic analysis of spike traits, yield and yield components ... 25
2.4.2 QTL identification for the spike traits and yield components ... 29
2.4.3 QTL for yield and yield components independent of the non-free-threshing habit 39 2.5 Discussion ... 40
2.5.1 Usefulness of the spelt as a genetic resource for yield component improvement in bread wheat ... 40
2.5.2 Maintaining the free-threshing habit while utilising spelt as a gene source ... 41
IV
2.5.4 Trade-off between individual grain weight and grain number while transferring the
traits and genes from spelt to bread wheat ... 43
2.6 Acknowledgements ... 45
2.7 References ... 46
Chapter 3 ... 52
Optimising Tiller Production and Survival for Grain Yield Improvement in Wheat ... 52
3.1 Abstract ... 53
3.2 Introduction ... 54
3.3 Materials and methods ... 57
3.3.1 Tillering, R:FR and yield components in the field experiments ... 57
3.3.2 Shading experiment in the glasshouse ... 59
3.4 Results ... 61
3.4.1 Phenotypic variation in tillering dynamics in the Forno × Oberkulmer mapping population ... 61
3.4.2 Phenotypic correlations between tillering traits ... 62
3.4.3 Identification of the QTL associated with tillering traits ... 63
3.4.4 Tillering dynamics as related to low R:FR ... 70
3.4.5 Responses of the onset of stem elongation and plant height to low R:FR ... 75
3.4.6 Synchrony among tillering cessation, R:FR stabilisation and the onset of stem elongation ... 75
3.4.7 Relationships between tillering and yield components ... 75
3.5 Discussion ... 78
3.5.1 Large variation in tillering dynamics and its genetic control ... 78
3.5.2 Low R:FR inhibits tiller production, and increases tiller abortion ... 80
3.5.3 Increasing fertile shoot number while maintaining the other yield components .... 81
3.6 Acknowledgements ... 84
3.7 References ... 85
Chapter 4 ... 91
Optimising Biomass Accumulation and Partitioning to Improve Yield and Yield Components in Wheat ... 91
4.1 Abstract ... 92
4.2 Introduction ... 93
4.3 Materials and methods ... 97
4.3.1 Biomass, leaf area, yield and yield components ... 97
4.3.2 De-tillering at GS39 ... 98
4.3.3 De-graining at anthesis ... 99
V
4.3.5 Grain weight and number within spikes ... 99
4.4 Results ... 101
4.4.1 Genetic variation in biomass and yield traits in the Forno × Oberkulmer mapping population ... 101
4.4.2 Yield and yield components ... 101
4.4.3 Relationships of biomass and green area at GS39 with yield and yield components ... 101
4.4.4 Relationships of biomass and green area at anthesis with yield and yield components ... 105
4.4.5 Relationships of biomass partitioning at maturity with yield and yield components ... 109
4.4.6 Crop growth dynamics ... 109
4.4.7 Dry matter translocation (DMT) from the vegetative parts to grains... 112
4.4.8 Responses of yield and yield components to de-tillering at GS39 ... 112
4.4.9 Responses of grain weight and dimensions to de-graining at anthesis ... 112
4.4.10 Relationships of leaf angle and plant height with yield and yield components .. 114
4.4.11 Relationships of biomass accumulation and partitioning with yield components within spikes ... 114
4.4.12 QTL for yield and yield components ... 115
4.4.13 QTL for biomass and leaf area at different stages, and their coincidences with those for yield and yield components ... 115
4.4.14 QTL for crop growth dynamics, and their coincidences with those for yield and yield components ... 116
4.4.15 QTL for dry matter translocation and potential grain weight, and their coincidences with those for yield and yield components ... 117
4.4.16 QTL for leaf angle and plant height ... 117
4.4.17 QTL for grain weight and number within spikes, and their coincidences with those for biomass traits ... 117
4.5 Discussion ... 130
4.5.1 Optimising grain weight and number, final biomass and HI for yield improvement ... 130
4.5.2 Optimising biomass accumulation and partitioning for the improvement of yield and yield components... 131
4.5.3 Increasing potential grain weight (PGW) and grain number to reduce sink limitation ... 134
4.6 Acknowledgements ... 136
4.7 References ... 137
VI
Chapter 5 ... 151
Early Anthesis and Delayed but Fast Leaf Senescence Contribute to Individual Grain Dry Matter and Water Accumulation in Wheat ... 151
5.1 Abstract ... 152
5.2 Introduction ... 153
5.3 Materials and methods ... 156
5.3.1 Anthesis dates ... 156
5.3.2 Leaf senescence ... 156
5.3.3 Grain dry matter and water accumulation ... 157
5.3.4 Grain weight at maturity ... 159
5.4 Results ... 160
5.4.1 Large phenotypic variation between the parents and between the RILs in anthesis dates, flag leaf senescence, grain filling traits, and grain weight ... 160
5.4.2 Significant physiological relationships between anthesis dates and flag leaf senescence ... 160
5.4.3 Anthesis dates and flag leaf senescence showed relationships with final grain weight ... 160
5.4.4 Anthesis dates showed relationships with grain dry matter and water accumulation ... 162
5.4.5 Flag leaf senescence showed relationships with grain dry matter and water accumulation ... 163
5.4.6 Close relationships between grain filling processes and final grain weight... 165
5.4.7 QTL coincidences explained the relationships between anthesis dates, flag leaf senescence, grain filling traits, and grain weight ... 165
5.5 Discussion ... 176
5.5.1 Interactions between anthesis time and leaf senescence ... 176
5.5.2 Early anthesis, and delayed but fast leaf senescence contribute to grain weight through grain filling processes ... 177
5.5.3 Early anthesis, and delayed but fast leaf senescence as the ideotypes for wheat breeding ... 179
5.6 Acknowledgements ... 182
5.7 References ... 183
5.8 Supplementary information... 189
Chapter 6 ... 192
Carpel Size, Individual Grain Dry Matter and Water Accumulation, and Grain Morphology, as Related to Individual Grain Weight in Wheat ... 192
6.1 Abstract ... 193
VII
6.3 Materials and methods ... 197
6.3.1 Carpel dissection at anthesis ... 197
6.3.2 Grain dry matter and water accumulation ... 198
6.3.3 Grain dimensions ... 199
6.3.4 Timing of rapid flag leaf senescence ... 200
6.3.5 De-graining at anthesis ... 200
6.4 Results ... 201
6.4.1 Carpel size, grain dry matter and water accumulation, and grain dimensions, are associated with final grain weight ... 201
6.4.2 Carpel size, grain dry matter and water accumulation, and grain dimensions interact with each other ... 204
6.4.3 QTL coincidences reflect the physiological relationships between grain filling traits and grain weight, and among grain filling traits ... 206
6.4.4 Inflection points of grain filling rate, grain dimensions and flag leaf senescence occur around the time at maximum grain water content (tmwc) ... 219
6.4.5 Distal and basal grains within spikelets differ in grain filling processes ... 220
6.4.6 Distal and basal grains within spikelets differ in the genetic architectures of grain filling processes... 223
6.4.7 Distal grains respond to de-graining at anthesis... 223
6.5 Discussion ... 224
6.5.1 Close relationships between grain filling traits and final grain weight, and among the grain filling traits ... 224
6.5.2 QTL coincidences reflect the close relationships between carpel size, grain dry matter and water accumulation, grain morphology, and final grain weight ... 225
6.5.3 Late onset of grain filling and slow initial grain filling rate lead to smaller distal grains ... 226 6.5.4 Conclusions ... 228 6.6 Acknowledgements ... 229 6.7 References ... 230 6.8 Supplementary data ... 234 Chapter 7 ... 243 General Discussion ... 243
7.1 Determination of yield and yield components ... 244
7.2 Trade-offs between yield components to maximise yield potential ... 248
7.3 Genetic variation as a strategy to improve yield and yield components ... 249
7.4 Detection and distribution of the QTL for yield, yield components and associated physiological traits ... 251
VIII
Chapter 8 ... 256
Conclusions and Future Work ... 256
8.1 Conclusions ... 257
8.2 Future work ... 258
8.2.1 Fine mapping for marker-assisted breeding and identification of candidate genes ... 258
8.2.2 Responses of grain number components to changes in resource availability during stem elongation ... 259
8.2.3 Effects of endosperm cell number, cell size, endoreduplication and cell death on grain filling ... 260
8.3 References ... 262
Appendices ... 264
Field trial 2011−2012: agronomy ... 265
Field trial 2011−2012: experimental design ... 266
Field trial 2011−2012: the subset population (72 lines + parents) ... 269
Field trial 2012−2013: agronomy ... 270
Field trial 2012−2013: experimental design ... 271
Field trial 2012−2013: the subset population (110 lines + parents) ... 274
IX
List of Abbreviations
Abbreviation Full form
ADM Accumulated dry matter
ANOVA Analysis of variance
BC Before Christ
c. circa
C1 First carpel within a spikelet counting from rachis
C2 Second carpel within a spikelet counting from rachis
C3 Third carpel within a spikelet counting from rachis
CCI Chlorophyll concentration index
CDMT Contribution of dry matter translocation to yield
CGR Crop growth rate
Chl Chlorophyll
Chlaccum Accumulated chlorophyll content
Chlloss Duration of rapid chlorophyll loss
Chlper Duration of chlorophyll persistence
Chltot Total duration of chlorophyll persistence and loss
cM centiMorgan
d day
DAA Degree days after anthesis
DMT Dry matter translocation
DMTE Dry matter translocation efficiency
DNA Deoxyribonucleic acid
DW Dry weight
e.g. exempli gratia
et al et alia
F5 Fifth filial generation
FAO Food and Agriculture Organization
Fig. Figure
G1 First grain within a spikelet counting from rachis
G2 Second grain within a spikelet counting from rachis
G3 Third grain within a spikelet counting from rachis
GA Green area
GAaccum Accumulated green area
GAloss Duration of rapid green area loss
GAper Duration of green area persistence
X
Abbreviation Full form
GF Grain filling
GFR Grain filling rate
GS Growth stage
h hour
H2 Broad sense heritability
HI Harvest index i.e. id est K Potassium L/H Grain length/height L/W Grain length/width LI Light interception
LOD Logarithm of the odds
LSD Least significant difference
MAS Marker-assisted selection
Max chl Maximum chlorophyll content
Max CLR Maximum chlorophyll loss rate
Max GALR Maximum green area loss rate
Mg Magnesium
MQM Multiple-QTL model
MWC Maximum water content of grain
N Nitrogen NS Not significant o C degree Celsius o Cd degree day P Phosphorus
PAR Photosynthetically active radiation
PGW Potential grain weight
QTL Quantitative trait locus
r Correlation coefficient
R:FR Red:far red ratio
R2/r2 Coefficient of determination
REML Residual maximum likelihood
RFLP Restriction fragment length polymorphism
RIL Recombinant inbred line
XI
Abbreviation Full form
RUE Radiation use efficiency
S.E.D./SED Standard error of the difference of means
SEM Standard error of the mean
SFI Spike fertility index
SGR Spike growth rate
SLA Specific leaf area
SNP Single nucleotide polymorphism
SPI Spike partitioning index
spp. species
SSR Simple sequence repeat
T. Triticum
TGW Thousand grain weight
tmax Time at maximum grain filling rate
tmwc Time at maximum grain water content
UK United Kingdom
UN United Nations
uon University of Nottingham
USA United States of America
USDA United States Department of Agriculture
WAR Water absorption rate of grain
WLR Water loss rate of grain
WSC Water soluble carbohydrate
XII
List of Tables
(Table numbering: Table + chapter number + ‘-’ + table number in that chapter)
Table 2-1 Descriptive statistics on spike traits, yield and yield components of the parents and
recombinant inbred line (RIL) mapping population ... 26
Table 2-2 Phenotypic correlation analysis of spike traits and yield components in the Forno ×
Oberkulmer mapping population ... 28
Table 2-3 Summary of the quantitative trait loci (QTL) detected in the Forno × Oberkulmer
mapping population ... 34
Table 2-4 Quantitative trait locus (QTL) identification in the Forno × Oberkulmer mapping
population ... 35
Table 2-5 Allelic analysis of grain number components and thousand grain weight (TGW) . 38 Table 3-1 Correlations between tillering traits in the mapping population of Forno and
Oberkulmer ... 63
Table 3-2 Quantitative trait loci (QTL) for tillering, red:far red ratio (R:FR) and yield
components in the Forno × Oberkulmer mapping population ... 67
Table 3-3 Correlations between tillering traits and red:far red ratio (R:FR) in the mapping
population of Forno and Oberkulmer ... 71
Table 3-4 Thinning effects on tillering and red:far red ratio (R:FR) ... 73 Table 3-5 Shading effects on fertile shoot number and other yield components ... 73 Table 3-6 Correlations between tillering traits and yield components in the mapping
population of Forno and Oberkulmer ... 76
Table 3-7 Correlations between carpel size and stem water soluble carbohydrates (WSC) at
anthesis, thousand grain weight and fertile shoots per plant at maturity in the mapping
population of Forno and Oberkulmer ... 76
Table 4-1 Correlations between biomass at GS39 (flag leaf ligule emergence) and yield
components ... 104
Table 4-2 Correlations between total leaf area at GS39 (flag leaf ligule emergence) and yield
components ... 104
Table 4-3 Correlations between biomass at anthesis and yield components ... 107 Table 4-4 Correlations between leaf area at anthesis and yield components ... 108 Table 4-5 Correlations between biomass partitioning at maturity and yield components .... 108 Table 4-6 Correlations between crop and spike growth, and yield components ... 111 Table 4-7 Effects of de-tillering at GS39 (flag leaf ligule emergence) on yield and yield
components ... 113
Table 4-8 Effects of de-graining at anthesis on thousand grain weight (TGW, 112 lines used)
and grain dimensions (10 lines used) ... 113
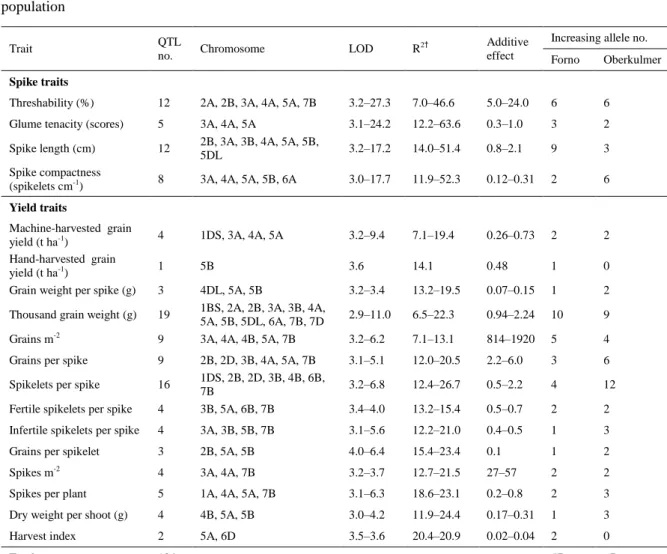
Table 4-9 Quantitative trait locus (QTL) identification for biomass, biomass-related traits,
XIII
Supplementary Table S4-1 Descriptive statistics on biomass, biomass-related traits, yield
and yield components of the parents and recombinant inbred lines (RILs) ... 144
Supplementary Table S4-2 Correlations among plant organs at GS39 (flag leaf ligule
emergence) ... 148
Supplementary Table S4-3 Correlations among plant organs at anthesis (dry weight) ... 148 Supplementary Table S4-4 Correlations among plant organs at anthesis (dry weight
proportion, %) ... 148
Supplementary Table S4-5 Correlations among plant organs at maturity (dry weight) ... 149 Supplementary Table S4-6 Correlations among plant organs at maturity (dry weight
proportion, %) ... 149
Supplementary Table S4-7 Correlations of grain number and grain weight among different
positions within spikes in 2012 ... 149
Supplementary Table S4-8 Significant correlations between biomass at different growth
stages and yield components within spikes ... 150
Table 5-1 Phenotypic correlations between anthesis dates and flag leaf senescence ... 162 Table 5-2 Phenotypic correlations between anthesis dates, flag leaf senescence, and final
grain weight ... 162
Table 5-3 Phenotypic correlations between anthesis dates and grain filling traits ... 163 Table 5-4 Phenotypic correlations between green area loss of flag leaves and grain filling
traits... 164
Table 5-5 Phenotypic correlations between chlorophyll degradation of flag leaves and grain
filling traits ... 164
Table 5-6 Phenotypic correlations between grain filling traits and final grain weight ... 165 Table 5-7 QTL identification for anthesis dates, flag leaf senescence, grain filling traits, and
grain weight in the mapping population of bread wheat × spelt ... 169
Table 5-8 QTL coincidences between anthesis dates and flag leaf senescence, grain filling
traits, and grain weight ... 173
Table 5-9 QTL coincidences between duration of green area persistence (GAper) and grain filling traits, and grain weight ... 173
Table 5-10 QTL coincidences between duration of chlorophyll persistence (Chlper) and grain filling traits, and grain weight ... 174
Table 5-11 QTL coincidences between duration of rapid chlorophyll loss (Chlloss) and grain filling traits, and grain weight ... 174
Table 5-12 QTL coincidences between maximum chlorophyll loss rate (Max CLR) and grain
filling traits, and grain weight ... 175
Supplementary Table S5-1 Descriptive statistics on anthesis dates, flag leaf senescence,
grain filling traits, and grain weight in the recombinant inbred line (RIL) mapping population of bread wheat × spelt ... 190
XIV
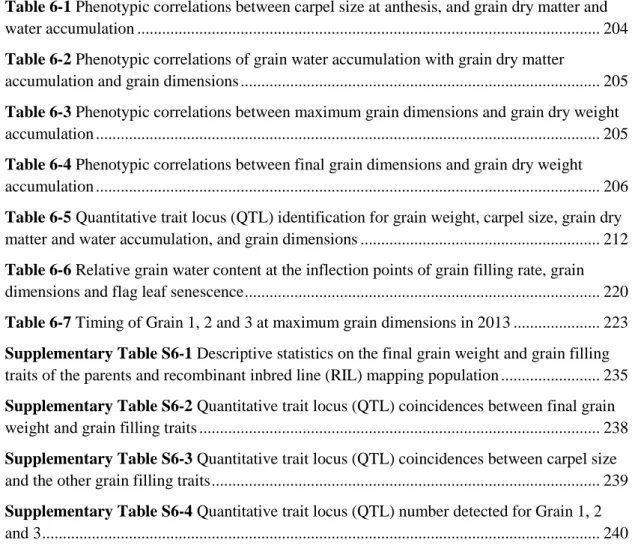
Table 6-1 Phenotypic correlations between carpel size at anthesis, and grain dry matter and
water accumulation ... 204
Table 6-2 Phenotypic correlations of grain water accumulation with grain dry matter
accumulation and grain dimensions ... 205
Table 6-3 Phenotypic correlations between maximum grain dimensions and grain dry weight
accumulation ... 205
Table 6-4 Phenotypic correlations between final grain dimensions and grain dry weight
accumulation ... 206
Table 6-5 Quantitative trait locus (QTL) identification for grain weight, carpel size, grain dry
matter and water accumulation, and grain dimensions ... 212
Table 6-6 Relative grain water content at the inflection points of grain filling rate, grain
dimensions and flag leaf senescence ... 220
Table 6-7 Timing of Grain 1, 2 and 3 at maximum grain dimensions in 2013 ... 223 Supplementary Table S6-1 Descriptive statistics on the final grain weight and grain filling
traits of the parents and recombinant inbred line (RIL) mapping population ... 235
Supplementary Table S6-2 Quantitative trait locus (QTL) coincidences between final grain
weight and grain filling traits ... 238
Supplementary Table S6-3 Quantitative trait locus (QTL) coincidences between carpel size
and the other grain filling traits ... 239
Supplementary Table S6-4 Quantitative trait locus (QTL) number detected for Grain 1, 2
XV
List of Figures
(Figure numbering: Figure + chapter number + ‘-’ + figure number in that chapter)
Fig. 1-1 Global wheat production, area harvested and yield from 1960 to 2014 ... 3
Fig. 2-1 Mean air temperature, rainfall and solar radiation at University of Nottingham Farm in 2011−2012 and 2012−2013 seasons ... 21
Fig. 2-2 Phenotypic variation in spike traits and grain size of the parents and mapping population ... 27
Fig. 2-3 Relationships between spike traits in the Forno × Oberkulmer mapping population 27 Fig. 2-4 Quantitative trait loci (QTL) associated with spike traits and yield components in the Forno × Oberkulmer mapping population ... 34
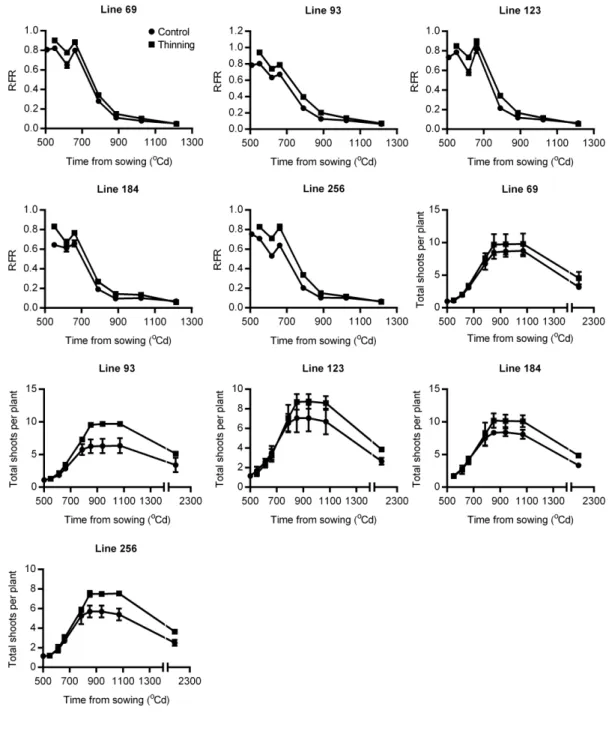
Fig. 3-1 Dynamics of tillering and red:far red ratio (R:FR) at the base of canopy in the mapping population of Forno and Oberkulmer ... 58
Fig. 3-2 Distributions of the recombinant inbred line (RIL) values for tillering and red:far red ratio (R:FR) at tillering cessation ... 62
Fig. 3-3 Quantitative trait loci (QTL) for tillering, red:far red ratio (R:FR), and yield components in the mapping population of Forno and Oberkulmer ... 65
Fig. 3-4 Dynamics of tillering and red:far red ratio (R:FR) in the control (circles) and thinned (squares) lines ... 72
Fig 3-5 Relationships between red:far red ratio (R:FR), shoots per plant and initial stem length around the onset of stem elongation ... 74
Fig. 4-1 Relationships between yield and yield components ... 102
Fig. 4-2 Relationships between leaf area and biomass at GS39 (flag leaf ligule emergence) and anthesis ... 103
Fig. 4-3 Dynamics of biomass accumulation and partitioning ... 110
Fig. 4-4 Grain weight response to de-graining at anthesis ... 113
Fig. 4-5 Relationship between plant height and biomass at maturity ... 114
Fig. 4-6 Quantitative trait loci (QTL) for biomass, biomass-related traits, yield and yield components in the Forno × Oberkulmer mapping population ... 118
Fig. 5-1 Gompertz growth curve fitting for flag leaf senescence ... 157
Fig. 5-2 Flag leaf senescence of bread wheat Forno and spelt Oberkulmer ... 161
Fig. 5-3 QTL identification for anthesis dates, flag leaf senescence, grain filling traits, and final grain weight ... 168
Fig. 5-4 A model showing the relationships between anthesis dates, flag leaf senescence, grain filling, and final grain weight ... 175
Fig. 6-1 Carpel from wheat floret (A) and the schematic diagram of grain dry matter accumulation over the accumulated thermal time from anthesis (base temperature 0 oC) (B) ... 197
XVI
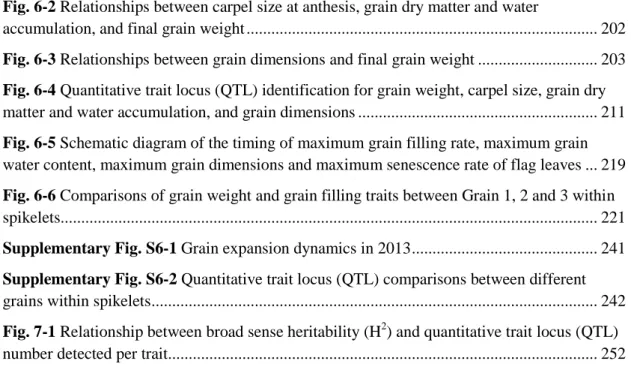
Fig. 6-2 Relationships between carpel size at anthesis, grain dry matter and water
accumulation, and final grain weight ... 202
Fig. 6-3 Relationships between grain dimensions and final grain weight ... 203 Fig. 6-4 Quantitative trait locus (QTL) identification for grain weight, carpel size, grain dry
matter and water accumulation, and grain dimensions ... 211
Fig. 6-5 Schematic diagram of the timing of maximum grain filling rate, maximum grain
water content, maximum grain dimensions and maximum senescence rate of flag leaves ... 219
Fig. 6-6 Comparisons of grain weight and grain filling traits between Grain 1, 2 and 3 within
spikelets... 221
Supplementary Fig. S6-1 Grain expansion dynamics in 2013 ... 241 Supplementary Fig. S6-2 Quantitative trait locus (QTL) comparisons between different
grains within spikelets ... 242
Fig. 7-1 Relationship between broad sense heritability (H2) and quantitative trait locus (QTL) number detected per trait... 252
1
Chapter 1
2
Chapter 1 General introduction
1.1 Wheat origin and domestication
Wheat (Triticum spp.) was one of the Neolithic founder crops, and played an important role in the transition from hunter-gathering to a sedentary agrarian society approximately 12,000 years ago (Lev-Yadun et al., 2000; Abbo et al., 2013). The first
wheat was diploid einkorn (T. boeoticum Boiss., genome AbAb), and grown in the
Near-Eastern Fertile Crescent (Salamini et al., 2002; Kilian et al., 2007). Wild einkorn was then cultivated and produced the domesticated form (T. monococcum L.).
Subsequently, a tetraploid wheat emmer (T. dicoccum Schübl., genome AuAuBB)
became the most important crop in the Fertile Crescent. Emmer was domesticated from its wild progenitor, T. dicoccoides Koern., which was derived from the hybridisation between a wild diploid wheat (T. urartu Thum. ex Gandil., genome
AuAu) and a relative of goat grass (Aegilops speltoides Tausch., genome SS, as the
donor of the B genome) occurring during 300,000–500,000 years ago (Bottley et al.,
2006; Peng et al., 2011). Next, expansion of domesticated tetraploid wheat resulted in sympatry with another goat grass (Ae. tauschii Coss., genome DD) and a spontaneous hybridisation between them took place about 9,000 years ago that gave rise to the
emergence of hexaploid spelt (T. spelta L., genome AuAuBBDD) (McFadden and
Sears, 1946; Dubcovsky and Dvorak, 2007; Peng et al., 2011). Finally, free-threshing forms (bread wheat T. aestivum L. and durum wheat T. durum Desf.) are usually considered as a result of mutations in spelt and emmer, respectively, about 8,500 years ago (Peng et al., 2011). However, the evolutionary sequence of spelt and bread wheat is still in debate. It has been proposed that spelt was derived from a hybridisation between free-threshing hexaploid wheat and hulled emmer (Blatter et al., 2004; Dvorak et al., 2012).
During wheat evolution, domestication was largely responsible for the appearance of current wheat. This process was a series of events for genetic selection to alter some key traits such as rachis fragility, glume tenacity and threshability, for better harvesting performance (Salamini et al., 2002). Wild einkorn and emmer have brittle spikes (spikes disarticulating into spikelets at maturity), and transformation of a brittle into non-brittle spike gave rise to domesticated forms (Salamini et al., 2002; Gill et al., 2007). The second domestication trait is tenacious glumes, which hinder the release of
3
seeds from spikelets. Einkorn and emmer (both wild and domesticated forms) as well as spelt, usually have tenacious glumes, whereas bread and durum wheats have soft ones. The free-threshing phenotype represents the final step of wheat domestication (Salamini et al., 2002). The most crucial gene governing this trait is Q, which is pleiotropic, not only conferring the free-threshing character but also influencing the threshability-related traits (e.g. glume tenacity and spike fragility) and spike morphology (e.g. spike shape, spike length, spikelet number and spike compactness) (Muramatsu, 1963; Jantasuriyarat et al., 2004; Simons et al., 2006).
1.2 Wheat cultivation today
On the basis of area grown, wheat is the most important crop in the world today; it
ranks the 3rd behind maize and rice in terms of production (FAO, 2014). In 2014, it
was globally grown on 222 million hectares of land, with a production of 723 million tonnes (Fig. 1-1) (FAO, 2014; USDA, 2015). The main type of wheat currently cultivated is hexaploid bread wheat, accounting for c. 95% of the total production; most of the remaining 5% is from tetraploid durum wheat (Shewry, 2009; Peng et al., 2011). Ancient wheats like einkorn, emmer and spelt, are grown as minor crops in some regions for use of traditional foods and organic farming (Konvalina et al., 2010; Zaharieva et al., 2010).
Fig. 1-1 Global wheat production, area harvested and yield from 1960 to 2014. Data sources from FAO
and the United States Department of Agriculture (FAO, 2014; USDA, 2015).
Compared with other crops, wheat has a number of advantages contributing to its success: adaptability, productivity and end-use value. Wheat cultivation expands from South America and southern Oceania to North America, northern Europe and Asia, and from sea level to c. 3000 m (Slafer and Whitechurch, 2001). Adaptability to
4
diverse environments (latitude, radiation, temperature, water and soil) makes it serve as a key food source for humans worldwide. When grown under a broad range of environments, wheat can produce satisfactory yield, enabling it to provide 19% of the calories and 20% of the proteins to the world population (Braun et al., 2010). In addition, the unique properties of dough from wheat flour allow it to be processed into various foods such as bread, cake, noodle, dessert, pasta and biscuit (Shewry, 2009).
1.3 Challenges for wheat production
Since the Green Revolution, wheat production has increased greatly (Fig. 1-1), and played a key role in global food security. As a component of production, arable land area for wheat cultivation has decreased since the 1980s, although there seems a slight increase in recent years. Decline in land area predominantly results from urbanisation and land degradation in many countries, especially developing ones. During urbanisation, a large area of arable land is replaced with growing or new cities or towns, leading to irreversible land loss. Pollution from new cities, towns and factories worsens this process, making the nearby land unsuitable for cropping. Additionally, arable land degradation is accelerated, including erosion, desertification and salinisation, mainly as a result of the mismanagement of land and agricultural intensification. In future decades, increasing demands for meat and milk, as well as biofuels, will lead to a further competition for land to grow feed and biofuel crops. While area under cultivation has decreased, wheat production has increased through the other component, i.e. yield, in the past 30 years. Yield has been increasing continuously, on average at a growth rate of 2.1% per year (USDA, 2015), benefiting from both plant genetic improvement and crop management. In 1960s, the dwarfing genes (Rht) were used to reduce plant height, leading to a substantial increase in grain number and harvest index (the proportion of grain weight to total plant biomass) (Brooking and Kirby, 1981; Youssefian et al., 1992; Flintham et al., 1997), and a reduced loss caused by lodging. Improvement of the post Green Revolution cultivars in resistance to diseases and pests has also contributed to yield gain (Singh and Trethowan, 2007). At the same time, wheat plants can grow under relatively favourable conditions by irrigation and applications of fertilisers (e.g. nitrogen, phosphate and potash) and biocides (e.g. pesticide, fungicide and herbicide), which reduces the gap between on-farm yields and yield potential.
5
A close look, however, reveals that yield progress has slowed down in the last two decades. Currently, annual yield growth rate is only around 1.0%, lower than that of demand (1.7%) (Reynolds et al., 2012; Ray et al., 2013; The Wheat Initiative, 2013). Rising demand for wheat production mainly stems from the increasing world population, predicted to exceed 9 billion by 2050 (United Nations, 2013), which, together with the changing dietary preferences, requires that global crop production is doubled by then (Ray et al., 2013). A further increase in wheat yield is essential to meet future food security. However, this is being challenged by global climate change. A warmer climate would result in high temperature and drought significantly influencing crop production, while an increase in frequency and magnitude of extreme weather makes crop production unpredictable. It has been predicted that there would be more frequent heat stress from booting to anthesis during wheat growth and development (Semenov et al., 2014), a key period to define grain number and potential grain size in wheat (Calderini et al., 2001; González et al., 2011). Heat stress
occurring during this time decreases grain yield by 8–30%, due to reduction in both
yield components (Lizana and Calderini, 2013; Semenov et al., 2014). Apart from global climate change, diminishing natural resources (e.g. fossil fuels) and rising prices for fertilisers, also limit yield advance in wheat (FAO, 2015).
1.4 Genetic improvement for wheat yield gain
As there is little new land to bring into production, future progress in wheat production will depend on improvement in grain yield. Genetic improvement of wheat plants has played a central role in boosting yield since the Green Revolution by changes in plant architecture (e.g. height) and increases in resistance to biotic and abiotic stresses. It is believed that this trend will continue, and that more efforts are needed to develop novel varieties with even higher yield (and quality). This is more important when considering environmental concerns from intensive agriculture. Ideal wheat varieties would require fewer fertilisers and biocides, minimising detrimental effects on agricultural ecosystems in a cost-effective way. Moreover, modifying key developmental periods and increased resistance to high temperature and drought, will enable wheat to grow and produce adequate yield under climate change. These can be achieved in conventional breeding by exploiting genetic variation in various agronomically important traits existing in elite varieties. There is much larger genetic variation in the Triticeae consisting of numerous relatives of wheat (approximately
6
350 species in 30 genera) (Feuillet and Muehlbauer, 2009). Desirable traits and genes in these relatives are able to be introduced into bread wheat by either traditional hybridisation (e.g. for hexaploid spelt), or wide crosses followed by cytogenetic techniques (e.g. for diploid rye).
1.5 Grain yield determination in wheat
To achieve genetic gain for wheat yield improvement, a first step is to understand its determination at genetic and physiological levels. Grain yield itself is an outcome of plant growth and development over the whole lifecycle, as well as interactions with environmental cues. Given its complexity, yield component approaches have long been used to dissect this trait. That is, yield can be divided into a number of relatively simpler components either numerically or physiologically (Slafer, 2007). Numerical components include grain number per unit land area and individual grain weight; the former has four sub-components, i.e. plants per unit land area, spikes per plant, spikelets per spike and grains per spikelet. The other approach is physiological, considering yield as a product of biomass and harvest index. Thus, factors affecting these components would determine final grain yield indirectly. Following this strategy, the next step is to identify the genetic and physiological basis underlying yield components and their secondary factors, taking account of trade-off between different traits.
For numerical components, plant number per unit land area depends on seed sown and
establishment. Seed rates on farms are normally high (> 250 seeds m-2 in UK) to
produce dense plant populations. Establishment includes seed germination, emergence and overwinter survival (if winter type), and is affected by sowing date, sowing depth, soil type (lower for loams and clays), soil moisture, overwinter weather (e.g. temperature), and pest and disease damage (Sylvester-Bradley et al., 2008). However, yield would not be reduced by slightly lower plant population due to compensatory tillering (Sylvester-Bradley et al., 2008). Tillering can occur from autumn to spring after plant emergence, depending on sowing time and temperature thereafter. A key function of tillering is to establish final spike number per plant. A plant can produce
up to 35 shoots in total; however, not all tillers initiated finally form spikes: 10−80%
usually die between the onset of stem elongation and anthesis, as affected by genotype, season, growing location, seeding rate and nutrient supply (Ishag and Taha, 1974; Hucl and Baker, 1989; Sharma, 1995; Berry et al., 2003; Sylvester-Bradley et al.,
7
2008). During tillering, spikelets are also being initiated (Slafer and Whitechurch,
2001), and a spike encompasses c. 16−25 spikelets. At the later stage of spikelet
initiation, floret initiation takes place within spikelets. A spikelet has up to 10 florets, but fewer than five finally set grains (grains per spikelet); the remaining florets are aborted around anthesis (Kirby, 1988; González-Navarro et al., 2015). Different from grain number components, individual grain weight is mainly determined during postanthesis period, when the assimilates from current photosynthesis and vegetative organs are translocated and stored into grains until desiccation. It has been found that the preanthesis period (from booting to anthesis) is also critical for final grain weight. During this period, carpels grow rapidly, and may set an upper limit to grain weight (Calderini et al., 1999; Hasan et al., 2011).
Turning to physiological components, plant biomass is accumulated from emergence to whole-plant senescence via photosynthesis and resource capture from soil. Internally, plant biomass consists of different organs, including leaves, stems, spikes (plus grains), and roots. Externally, it is a product of light interception and radiation use efficiency (RUE, biomass per unit of radiation intercepted) (Reynolds et al., 2012). Canopy characteristics and photosynthetic capacity, therefore, are important traits increasing biomass. In addition, only grains are harvestable for direct food use. Harvest index (HI) has been used to describe the proportion of harvestable biomass.
Current modern wheat varieties have HI of c. 0.45−0.50 (spring type) and 0.50−0.55
(winter type), approaching its theoretical maximum value (c. 0.64 in winter wheat) (Foulkes et al., 2011; Reynolds et al., 2012).
1.6 Objectives and hypotheses of this project
Despite many studies focusing on grain yield to date, how yield is determined at physiological and genetic levels is still unclear because of its complexity. As stated above, yield includes a number of components, and each component is formed through different physiological processes at different stages during plant growth and development. This requires that future studies should encompass all aspects of yield components to provide a comprehensive understanding of grain yield determination; at the same time, each aspect has to be demonstrated in detail to clarify the underlying mechanism, so that the knowledge can be transferred and realised in breeding. While analysing multiple yield components and their secondary traits, care must be taken to optimise any trade-offs between them to minimise negative effects.
8
Based on these concepts, this project was carried out to understand the physiological and genetic basis of yield and yield components of wheat. The specific objectives included:
Determining the relationships between yield and yield components;
Identifying a wide range of physiological traits associated with yield and yield components;
Optimising the trade-offs between yield components and between the
physiological traits;
Understanding the genetic basis of the relationships between yield, yield components and associated physiological traits.
To achieve this, two field trials and one glasshouse experiment were conducted in three growing seasons, using a recombinant inbred line (RIL) mapping population. This population was derived from a cross between the Swiss winter bread wheat
‘Forno’ and Swiss winter spelt ‘Oberkulmer’, and consists of 226 F5 RILs (Messmer et
al., 1999). As a hexaploid relative and potential genetic resource of bread wheat, spelt Oberkulmer was deployed to introduce genetic variation in yield and yield components (e.g. larger but fewer grains) (Winzeler et al., 1994; Zanetti et al., 2001).
In this mapping population, a number of hypotheses were to be tested, each of which is
presented in a chapter (Chapters 2−6).
Chapter 2: Spelt is a useful gene source to enlarge genetic variation in yield and yield
components in the Forno × Oberkulmer mapping population; based on this variation, the relationships between yield and yield components are observed.
Chapter 3: Tillering dynamics determines final fertile shoots per plant, a major
component of yield. Tiller production and survival are controlled by both genetic and environmental (e.g. light quality) factors.
Chapter 4: Biomass accumulation and partitioning, especially during preanthesis
period, determine yield and yield components.
Chapter 5: Flowering time and subsequent leaf senescence affect individual grain
9
Chapter 6: During grain filling, grain dry matter accumulation, grain water uptake
and loss, and grain morphological expansion, are the physiological drivers of individual grain weight, and these traits share their genetic architectures to some extent. As these chapters are prepared as journal papers, the references cited are included at the end of each chapter.
10
1.7 References
Abbo S, Lev-Yadun S, Heun M, Gopher A. 2013. On the ‘lost’ crops of the
neolithic Near East. Journal of Experimental Botany 64, 815-822.
Berry PM, Spink JH, Foulkes MJ, Wade A. 2003. Quantifying the contributions
and losses of dry matter from non-surviving shoots in four cultivars of winter wheat. Field Crops Research 80, 111-121.
Blatter R, Jacomet S, Schlumbaum A. 2004. About the origin of European spelt
(Triticum spelta L.): allelic differentiation of the HMW Glutenin B1-1 and A1-2 subunit genes. Theoretical and Applied Genetics 108, 360-367.
Bottley A, Xia GM, Koebner RMD. 2006. Homoeologous gene silencing in
hexaploid wheat. The Plant Journal 47, 897-906.
Braun HJ, Atlin G, Payne T. 2010. Multi-location testing as a tool to identify plant
response to global climate change. In: Reynolds MP, ed. Climate Change and Crop Production. Surrey: CABI, 115-138.
Brooking IR, Kirby EJM. 1981. Interrelationships between stem and ear
development in winter wheat: the effects of a Norin 10 dwarfing gene, Gai/Rht2.
Journal of Agricultural Science 97, 373-381.
Calderini DF, Abeledo LG, Savin R, Slafer GA. 1999. Effect of temperature and
carpel size during pre-anthesis on potential grain weight in wheat. Journal of Agricultural Science 132, 453-459.
Calderini DF, Savin R, Abeledo LG, Reynolds MP, Slafer GA. 2001. The
importance of the period immediately preceding anthesis for grain weight determination in wheat. Euphytica 119, 199-204.
Dubcovsky J, Dvorak J. 2007. Genome plasticity a key factor in the success of
polyploid wheat under domestication. Science 316, 1862-1866.
Dvorak J, Deal KR, Luo M, You FM, von Borstel K, Dehghani H. 2012. The
origin of spelt and free-threshing hexaploid wheat. Journal of Heredity 103, 426-441.
FAO. 2014. FAOSTAT. http://faostat.fao.org/.
11
Feuillet C, Muehlbauer GJ. 2009. Genetics and Genomics of the Triticeae. New
York: Springer.
Flintham JE, Borner A, Worland AJ, Gale MD. 1997. Optimizing wheat grain
yield: effects of Rht (gibberellin-insensitive) dwarfing genes. Journal of Agricultural Science 128, 11-25.
Foulkes MJ, Slafer GA, Davies WJ, Berry PM, Sylvester-Bradley R, Martre P, Calderini DF, Griffiths S, Reynolds MP. 2011. Raising yield potential of wheat. III.
Optimizing partitioning to grain while maintaining lodging resistance. Journal of Experimental Botany 62, 469-486.
Gill BS, Li W, Sood S, Kuraparthy V, Friebe BR, Simons KJ, Zhang Z, Faris JD.
2007. Genetics and genomics of wheat domestication-driven evolution. Israel Journal of Plant Sciences 55, 223-229.
González-Navarro OE, Griffiths S, Molero G, Reynolds MP, Slafer GA. 2015.
Dynamics of floret development determining differences in spike fertility in an elite population of wheat. Field Crops Research 172, 21-31.
González FG, Miralles DJ, Slafer GA. 2011. Wheat floret survival as related to
pre-anthesis spike growth. Journal of Experimental Botany 62, 4889-4901.
Hasan AK, Herrera J, Lizana C, Calderini DF. 2011. Carpel weight, grain length
and stabilized grain water content are physiological drivers of grain weight determination of wheat. Field Crops Research 123, 241-247.
Hucl P, Baker RJ. 1989. Tillering patterns of spring wheat genotypes grown in a
semiarid environment. Canadian Journal of Plant Science 69, 71-79.
Ishag HM, Taha MB. 1974. Production and survival of tillers of wheat and their
contribution to yield. Journal of Agricultural Science 83, 117-124.
Jantasuriyarat C, Vales M, Watson C, Riera-Lizarazu O. 2004. Identification and
mapping of genetic loci affecting the free-threshing habit and spike compactness in wheat (Triticum aestivum L.). Theoretical and Applied Genetics 108, 261-273.
Kilian B, Özkan H, Walther A, Kohl J, Dagan T, Salamini F, Martin W. 2007.
Molecular diversity at 18 loci in 321 wild and 92 domesticate lines reveal no reduction of nucleotide diversity during Triticum monococcum (Einkorn) domestication:
12
implications for the origin of agriculture. Molecular Biology and Evolution 24, 2657-2668.
Kirby EJM. 1988. Analysis of leaf, stem and ear growth in wheat from terminal
spikelet stage to anthesis. Field Crops Research 18, 127-140.
Konvalina P, Capouchova I, Stehno Z, Moudry J. 2010. Agronomic characteristics
of the spring forms of the wheat landraces (einkorn, emmer, spelt, intermediate bread wheat) grown in organic farming. Journal of Agrobiology 27, 9-17.
Lev-Yadun S, Gopher A, Abbo S. 2000. The cradle of agriculture. Science 288,
1602-1603.
Lizana XC, Calderini DF. 2013. Yield and grain quality of wheat in response to
increased temperatures at key periods for grain number and grain weight determination: considerations for the climatic change scenarios of Chile. Journal of Agricultural Science 151, 209-221.
McFadden ES, Sears ER. 1946. The origin of Triticum spelta and its free-threshing
hexaploid relatives. Journal of Heredity 37, 107-116.
Messmer MM, Keller M, Zanetti S, Keller B. 1999. Genetic linkage map of a wheat
× spelt cross. Theoretical and Applied Genetics 98, 1163-1170.
Muramatsu M. 1963. Dosage effect of the spelta gene q of hexaploid wheat. Genetics 48, 469-482.
Peng JH, Sun D, Nevo E. 2011. Domestication evolution, genetics and genomics in
wheat. Molecular Breeding 28, 281-301.
Ray DK, Mueller ND, West PC, Foley JA. 2013. Yield trends are insufficient to
double global crop production by 2050. PLoS ONE 8, e66428.
Reynolds M, Foulkes J, Furbank R, Griffiths S, King J, Murchie E, Parry M, Slafer G. 2012. Achieving yield gains in wheat. Plant Cell and Environment 35,
1799-1823.
Salamini F, Özkan H, Brandolini A, Schäfer-Pregl R, Martin W. 2002. Genetics
and geography of wild cereal domestication in the Near East. Nature Reviews Genetics 3, 429-441.
13
Semenov MA, Stratonovitch P, Alghabari F, Gooding MJ. 2014. Adapting wheat
in Europe for climate change. Journal of Cereal Science 59, 245-256.
Sharma RC. 1995. Tiller mortality and its relationship to grain yield in spring wheat.
Field Crops Research 41, 55-60.
Shewry PR. 2009. Wheat. Journal of Experimental Botany 60, 1537-1553.
Simons KJ, Fellers JP, Trick HN, Zhang Z, Tai YS, Gill BS, Faris JD. 2006.
Molecular characterization of the major wheat domestication gene Q. Genetics 172, 547-555.
Singh RP, Trethowan R. 2007. Breeding Spring Bread Wheat for Irrigated and
Rainfed Production Systems of the Developing World. Iowa, USA: Blackwell Publishing.
Slafer GA. 2007. Physiology of determination of major wheat yield components. In:
Buck HT, Nisi JE, Salomón N, eds. Wheat production in stressed environments. The Netherlands: Springer, 557-565.
Slafer GA, Whitechurch EM. 2001. Manipulating wheat development to improve
adaptation. In: Reynolds MP, Ortiz-Monasterio JI, McNab A, eds. Application of Physiology in Wheat Breeding. Mexico: CIMMYT, 160-170.
Sylvester-Bradley R, Berry P, Blake J, Kindred D, Spink J, Bingham I, McVittie J, Foulkes J. 2008. The wheat growth guide. London: HGCA.
The Wheat Initiative. 2013. An International Vision for Wheat Improvement. Paris,
France.
United Nations. 2013. World Population Prospects: the 2012 Revision. New York:
United Nations.
USDA. 2015. World wheat supply and disapperance.
http://www.ers.usda.gov/data-products/wheat-data.aspx.
Winzeler H, Schmid JE, Winzeler M. 1994. Analysis of the yield potential and yield
components of F1 and F2 hybrids of crosses between wheat (Triticum aestivum L.) and spelt (Triticum spelta L.). Euphytica 74, 211-218.
14
Youssefian S, Kirby EJM, Gale MD. 1992. Pleiotropic effects of the GA-insensitive
Rht dwarfing genes in wheat. 2. Effects on leaf, stem, ear and floret growth. Field Crops Research 28, 191-210.
Zaharieva M, Ayana N, Hakimi A, Misra S, Monneveux P. 2010. Cultivated
emmer wheat (Triticum dicoccon Schrank), an old crop with promising future: a review. Genetic Resources and Crop Evolution 57, 937-962.
Zanetti S, Winzeler M, Feuillet C, Keller B, Messmer M. 2001. Genetic analysis of
15
Chapter 2
Physiological and Genetic Dissection of Grain Yield in the
Bread Wheat Forno × Spelt Oberkulmer Mapping
16
2.1 Abstract
Novel germplasm resources are required to broaden the genetic diversity of bread wheat (Triticum aestivum L.) for further yield improvement. In this study, the usefulness of spelt (Triticum spelta L.) as a genetic resource to improve yield and yield components of bread wheat was determined. A recombinant inbred line mapping population of bread wheat cultivar Forno and spelt cultivar Oberkulmer was used to quantify the yield and yield components. Subsequently, quantitative trait loci (QTL) for the yield traits, together with grain threshability, were identified. Oberkulmer had larger grains (in 2012 season), more fertile tillers per plant, higher biomass, longer and laxer spikes than Forno. QTL analysis revealed six alleles for low threshability and two for tenacious glumes from the spelt, and the Q gene had major effects. Furthermore, 48 favourable alleles for yield and yield components were detected from Oberkulmer, and 85% of them were independent of those for low threshability and tenacious glumes. Therefore, spelt is a useful genetic resource for yield improvement of bread wheat, while maintaining the free-threshing habit. In addition, most of QTL for grain number components were coincident with those for grain weight. Analysis of allelic effects of the coincident QTL showed that increased grain number was associated with decreased grain weight, which explained their negative phenotypic relationships. Thus, the independent alleles of spelt could be used for simultaneous improvement of grain number and weight in bread wheat.
17
2.2 Introduction
Wheat is a dominant crop worldwide, providing 19% of the calories and 20% of the
proteins consumed by humans (Braun et al., 2010). In the light of burgeoning world’s
population, 9.4 billion by 2050 as forecasted by the UN, a substantial increase in grain yield of wheat is needed to ensure global food security. The progress in grain yield, however, has fallen in the past 20 years (3.8% per annum from 1961 to 1989, but only 2% in 1990s and 1.6% in 2000s); should this trend continue over the next 30 years, the growth rate will drop to 1.1% per annum (FAO, 2014). Factors such as climate change, natural resource shortage and environmental pollution further threaten wheat productivity. Genetic improvement in wheat has greatly contributed to yield growth since the Green Revolution, and will still be the key requirement under environmental challenges in future decades. Grain yield is a complex trait, consisting of two major components, grain number per unit land area and individual grain weight. The former can be divided into four sub-components, i.e. plants per unit land area, spikes per plant, spikelets per spike, and grains per spikelet (Slafer, 2007). To further improve grain yield, both grain number and individual grain weight should be increased in parallel. In empirical breeding, new varieties are usually selected from the progeny of the crosses of elite lines, with respective advantages of yield components or resistance to biotic or abiotic stresses. To hasten the development of new varieties, a limited number of currently used varieties are often adopted as parents. This strategy, however, has reduced genetic diversity in modern wheat, and made it harder to further raise yield potential. Exploitation of novel genetic resources has been considered as an alternative, as proposed by the international Wheat Yield Consortium (WYC) in 2009 (Reynolds et al., 2011). In the tribe Triticeae, the large number of relatives of wheat provide the potential to improve yield performance of bread wheat.
Spelt is an old-world crop cultivated since 5,000 BC; however, it currently remains a minor crop for the use of bread and feed in Europe and North America (Campbell, 1997). The height of cultivated spelts ranges from 90 to 130 cm, and the spikes are laxer and 4 to 7 cm longer than those of bread wheat (Campbell, 1997). As one of the hexaploid wheats, spelt has the same genome constitution as bread wheat (genome AABBDD). It can be hybridised with bread wheat easily, and their hybrids are fertile, which facilitates the transfer of desirable traits and genes to bread wheat. A high level of genetic diversity in spelt germplasm collections has been revealed by molecular
18
markers (Bertin et al., 2004). In addition, genetic variation in bread-making quality (Caballero et al., 2001, 2004; An et al., 2005), protein concentration (Stallknecht et al., 1996; Gomez-Becerra et al., 2010), lipid content (Ruibal-Mendieta et al., 2002) and mineral nutrient concentrations (for example, Zn, Fe and Se) (Ruibal-Mendieta et al., 2005; Zhao et al., 2009; Gomez-Becerra et al., 2010), has been reported. Spelt also shows resistance to abiotic and biotic stresses, such as aluminium (Raman et al., 2009), flooding (Burgos et al., 2001b), leaf rust (Dyck and Sykes, 1994; Wang et al., 2010; Mohler et al., 2012), yellow rust (Sun et al., 2002), leaf and glume blotch (Aguilar et al., 2005; Simon et al., 2010). Many genes and quantitative trait loci (QTL) associated with bread-making quality and stress resistance have been identified from spelt (Burgos et al., 2001a; Zanetti et al., 2001; Aguilar et al., 2005; Guzman et al., 2012; Mohler et al., 2012).
In contrast, only a few studies have focused on the yield and yield components of spelt, mainly because of its tenacious glumes and low threshability that make it difficult to separate grains from chaff. Significant genetic variation in yield and yield components
has been observed in spelt: 4.2−6.0 t ha-1 for grain yield, 0.8−2.0 g for grain weight
per spike, 15.3−47.1 mg for individual grain weight, 20−30 grains per spike, 18−33
spikelets per spike, 1.1−1.6 grains per spikelet, 10−47 tillers per plant, 6−24 spikes
per plant, 14.3−15.7 t ha-1
for above-ground biomass, and 0.3−0.4 for harvest index
(HI, the ratio of total grain to total shoot dry weight) (Winzeler et al., 1994; Stallknecht et al., 1996; Troccoli and Codianni, 2005; Hou et al., 2010; Konvalina et al., 2010; Koutroubas et al., 2012). Compared with bread wheat, spelt tends to have larger but fewer grains, and higher biomass but lower HI, resulting in less or comparable yield (Stallknecht et al., 1996; Abdel-Aal et al., 1997; Campbell, 1997; Konvalina et al., 2010; Koutroubas et al., 2012). Crosses between bread wheat and
spelt have been made, and the F1 hybrids show large heterosis effects on grain yield
per spike, individual grain weight, and grain number per spike (Schmid and Winzeler, 1990; Winzeler et al., 1994), indicating different genetic architectures between the two hexaploid wheats. This genetic difference implies that spelt may provide a new gene source for yield improvement in bread wheat.
In this study, we aimed to investigate the usefulness of spelt as a genetic resource to improve yield and yield components of bread wheat, while avoiding its non-free-threshing habit. To achieve this, a recombinant inbred line mapping population,
19
derived from a cross between the bread wheat cultivar ‘Forno’ and spelt land variety
‘Oberkulmer’, was used. The previous studies indicated that Oberkulmer has larger but fewer grains, more spikes per plant and lower HI than Forno (Winzeler et al., 1994;
Zanetti et al., 2001), and their F1 hybrids exhibit a very high relative heterosis
(Winzeler et al., 1994). Therefore, significant genetic variation in yield and yield components in this mapping population could be expected. This gave a chance to understand their genetic basis, and in turn, to exploit the favourable alleles from spelt for yield improvement in bread wheat. Genetic basis of yield and yield components was dissected by a QTL analysis. Furthermore, The QTL associated with grain threshability traits were also determined.
20
2.3 Materials and methods
2.3.1 Plant materials and field experiments
A total of 226 F5 recombinant inbred lines (RILs) were produced from a cross between
Swiss winter bread wheat (T. aestivum L. ‘Forno’) and Swiss winter spelt land variety
(T. spelta L. ‘Oberkulmer’) (Messmer et al., 1999). Field experiments were carried
out in two growing seasons: 2011–2012 (referred hereafter as 2012) and 2012–2013
(referred hereafter as 2013), at University of Nottingham Farm, Leicestershire, UK
(52o 50' N, 1o 15' W, 50 m above sea level). Weather conditions during the two
seasons are summarised in Fig. 2-1. The data of air temperature, rainfall and solar radiation were collected from the nearby meteorological station, and the historic station data from the Met Office (http://www.metoffice.gov.uk/) were compiled. The soil was a sandy loam (soil indices: N = 0, P = 4, K = 4, Mg = 4, pH = 7.6 in 2012; N = 0, P = 5, K = 4, Mg = 4, pH = 7.3 in 2013). An additional 140 (in 2012) and 160 (in
2013) kg N ha-1 in the form of ammonium nitrate prills were applied (three splits:
early March, April and May). All the RILs, together with the parents, were arranged in a randomised complete block design with three replicates. The seeds were sown in 6 × 1.6 m plots on 19 October 2011 and in 12 × 1.6 m plots on 31 October 2012, with 250
seeds m-2. A prophylactic programme of disease, weed and pest management was
utilised to maintain undisturbed healthy crop growth. Nitrogen, potassium and phosphorus levels were maintained according to standard recommended agronomic practice. Phenotypic measurements such as grain threshability, machine-harvested
grain yield, grains m-2 and thousand grain weight (TGW) were based on all 226 RILs.
A subset including 72 RILs was selected in 2011−2012 season, with considerable
differences in traits of interest, but similar flowering time (± 4 d in 2009−2010 and ± 1
d in 2010−2011) to minimise the confounding effect of different phasic development. This subset was enlarged to 110 RILs in 2012−2013 season. The remaining phenotypic measurements were carried out in the subsets.
21
Fig. 2-1 Mean air temperature, rainfall and solar radiation at University of Nottingham Farm in
2011−2012 and 2012−2013 seasons. The long-term means of temperature (1959−2010), rainfall (1961−2010) and radiation (2000−2010) are also given.
0 2 4 6 8 10 12 14 16 18 20
Oct Nov Dec Jan Feb Mar Apr May June July Aug Sept
M e a n t e m p e ra tu re ( oC) 2011−2012 2012−2013 Long-term mean 0 20 40 60 80 100 120 140 160
Oct Nov Dec Jan Feb Mar Apr May June July Aug Sept
M o n th ly ra in fa ll (m m ) 2011−2012 2012−2013 Long-term mean 0 5 10 15 20 25
Oct Nov Dec Jan Feb Mar Apr May June July Aug Sept
So la r ra d ia ti o n (M J m -2 day -1) 2011−2012 2012−2013 Long-term mean