A less-than-truckload carrier collaboration planning problem under
dynamic capacities
Salvador Hernández
a,⇑, Srinivas Peeta
b, George Kalafatas
c aDepartment of Civil Engineering, University of Texas at El Paso, El Paso, TX 79968-0517, United States b
School of Civil Engineering, 550 Stadium Mall Drive, Purdue University, West Lafayette, IN 47906-2051, United States c
Department of Civil Works Technology, Technological University of Athens, Ag. Spyridonos Str. 12210, Egaleo-Athens, Greece
a r t i c l e
i n f o
Article history:
Received 16 June 2010
Received in revised form 21 October 2010 Accepted 11 January 2011
Keywords:
Collaborative logistics Freight transportation Less-than-truckload trucking Minimum cost flow
a b s t r a c t
This paper addresses the deterministic dynamic single carrier collaboration problem for the small- to medium-sized less-than-truckload (LTL) industry. It is formulated as a binary (0–1) multi-commodity minimum cost flow problem and solved using a branch-and-cut algorithm. Its inherent network structure is exploited to generate the lower bounds to the branch-and-cut algorithm using the network simplex method and by relaxing the inte-grality constraints. Results from numerical experiments indicate inherent trade-offs at the higher degrees of collaboration between waiting for more affordable collaborative capacity and incurring higher holding costs. They also suggest that collaborating LTL carriers expe-rience increased capacity utilization.
Ó2011 Elsevier Ltd. All rights reserved.
1. Introduction
Less-than-truckload (LTL) carriers, which operate on thin margins, have significant negative impacts due to empty trips, idled capacity on lots, and rising energy costs. The impacts can cascade to other industries; for example, empty trips may affect global food prices. Recent advances in Internet and information communication technologies (ICT) foster the possibil-ity of innovative new business and operational paradigms within the small- to medium-sized LTL industry to address these concerns. One promising innovation is the concept of LTL carrier–carrier collaboration, which provides opportunities for LTL carriers to exploit synergies in operations (such as excess capacity), reduce costs associated with fleet operation, decrease lead times, increase asset utilization (power units), and enhance overall service levels (Esper and Williams, 2003).
LTL carrier–carrier collaboration is a relatively unexplored concept within the freight domain. Past studies have focused on collaboration within the truckload (TL) carrier, liner shipping, and rail industries (Agarwal and Ergun, 2008, in prepara-tion; Song and Regan, 2004; Figliozzi, 2006; Kuo et al., 2008). Recently,Hernandez and Peeta (2010)introduced and exam-ined the viability of LTL carrier–carrier collaboration from a static planning perspective for a single carrier, termed the carrier of interest. The study explored the potential benefits of the LTL carrier–carrier collaborative paradigm for the carrier of inter-est based on the degree of collaboration. It formulated single and multiple product collaboration problems as binary (0–1) multi-commodity minimum cost flow problems. The study insights from numerical experiments suggest that collaboration can reduce deadheading for the collaborating carriers, alleviate the consequences of fuel price increases, and reduce operat-ing costs relative to a non-collaborative leasoperat-ing option. However, the time dimension is not considered in the problem for-mulation due to its static planning perspective.
1366-5545/$ - see front matterÓ2011 Elsevier Ltd. All rights reserved. doi:10.1016/j.tre.2011.03.001
⇑Corresponding author. Tel.: +1 915 747 6348; fax: +1 915 747 8037.
E-mail addresses:[email protected](S. Hernández),[email protected](S. Peeta),[email protected](G. Kalafatas). Contents lists available atScienceDirect
Transportation Research Part E
j o u r n a l h o m e p a g e : w w w . e l s e v i e r . c o m / l o c a t e / t r eThe time dimension is a key operational factor in freight carrier operations, as a carrier is under the clock after it elects to serve a shipment. It raises additional sources of complexity in the enabling of a LTL collaborative network due to the need to route shipments over multiple origin–destination (O–D) pairs. First, the carrier of interest must be able to identify which collaborative carriers are available and determine their available time-dependent capacities for collaboration on the various network links. There are two challenges from a time dimension in this context. The required collaborative capacity may not be available at a transfer location at the time a load arrives to it, indicating the possibility of holding costs. Further, a poten-tial collaborative capacity may itself be in transit to the transfer location or waiting to unload its cargo at the transfer point. Second, as a consequence of the aforementioned complexity, there is a need to factor the holding costs in addition to the capacity acquisition costs to determine the various permutations of collaborative routes to generate the operational plan. Hence, the dynamics associated with the time-dependent availability of the collaborative capacity in conjunction with the costs of holding loads at transfer points are essential to generating the optimal collaboration strategy for the carrier of interest.
Delays at transfer points can occur due to mechanical breakdowns of power units, and congestion on the physical net-work as well as at terminals, depots and/or warehouses. These delays manifest as holding costs in the LTL collaboration con-text due to increased driver pay, delivery delay costs (especially on the perishable items), potential revenue loss from idled capacity, and increased transfer site fees for utilized space. The LTL carrier–carrier collaboration paradigm provides an opportunity to explore the impacts of increased asset utilization (collaborative capacity) and crossdocking practices on alle-viating the monetary impacts of delays.
This study addresses a dynamic LTL carrier–carrier collaboration problem among a group of small- to medium-sized LTL carriers. Here, a carrier of interest seeks collaborative routes to service multiple shipments so as to minimize costs while factoring the availability and cost structure of the time-dependent collaborative capacity on the associated network links and holding costs at transfer points (nodes). The problem, addressed from a dynamic planning perspective, is labeled the deterministic dynamic single carrier collaboration problem (DDSCCP). In the DDSCCP, the demand between an O–D pair for the carrier of interest is fixed, but subject to thresholds on the latest entry into the carrier service network and the earliest exit from it to meet the load time windows associated with pickup and delivery, respectively. Further, the time-dependent availability of the collaborative capacities and the corresponding magnitudes on the network links are knowna priorifor the entire planning horizon. The problem is deterministic because the demand is fixed and the time-dependent collaborative capacities are known for the planning horizon. It is dynamic in the sense that the demand has time windows for load pick-up/delivery, the collaborative capacities are time-dependent, and the actual holding costs encountered by a load depend on the number of intervals it is held at a transfer location (though the holding cost rate itself is fixed for a location). Due to the planning perspective of the DDSCCP, operational aspects related to link travel time variability are ignored here. Thereby, the link travel times are fixed. However, the costs associated with congestion effects due to both traffic and terminal delays are captured through holding costs that vary with transfer locations.
The remainder of this paper is organized as follows: Section 2 reviews related literature on dynamic carrier collaboration and holding costs in the context of the TL, liner shipping, and rail industries. Section3describes the formulation of the DDSCCP problem. It also discusses the formulation characteristics and illustrates some of its properties. Section4 summa-rizes the design of experiments for the DDSCCP. Section5summarizes the insights from the experimental results. It conducts sensitivity analyses and studies the effects of collaboration by comparing the DDSCCP strategies to the short-term leasing option, analyzing the effects of holding costs on the carrier of interest, and estimating the levels of collaborative capacity utilization. Section6presents some concluding comments.
2. Literature review
For the freight transportation and carrier industries, the carrier collaborative paradigm is an emerging trend that ad-dresses system inefficiencies and lost profits. From the dynamic perspective, most studies center on liner shipping, rail, and TL industries. While the literature does not address the issue of time in relation to LTL collaboration, the time dimension is a vital aspect of LTL carrier–carrier collaboration in an operational context, both for operational planning and deployment. By introducing the time dimension to the LTL collaborative paradigm, we seek to capture the dynamic effects of the spatial availability of time-dependent collaborative capacity over an LTL point-to-point network and understand the impacts of con-gestion effects on the collaborative routes.
Past studies that employ a dynamic context in relation to the collaborative paradigm in the liner shipping and rail indus-tries primarily consider the issue of efficient allocation of collaborative capacity. They rely on techniques from the operations research domain, such as vehicle routing problems and simulation, to model the problem.Agarwal and Ergun (in prepara-tion)studied the collaborative paradigm from the perspective of the liner shipping industry. They analyzed the collaboration of liner shipping companies over a large-scale dynamic network and formulated a network design problem that considered both transshipment (transfer) and holding costs (costs related to overnight stays) at ports.Kuo et al. (2008)proposed a dis-crete-time carrier collaboration simulation-assignment framework to address an international rail-based intermodal freight transport problem. Figliozzi (2006) introduced dynamic auction-based mechanisms for TL carrier–carrier collaboration where loads are dynamic and collaboration is through the auctioning of loads to members in the collaborative. There are some key differences between the characteristics of the aforementioned studies and the LTL context.
First, the liner shipping, rail, and TL industries operate under planning periods which range from a few days to many weeks. By contrast, the small- to medium-sized LTL carriers operate on much shorter operational delivery planning periods that range from a few hours to a day or two. These shorter planning periods add complexity to LTL networks due to the short-er pickup and delivshort-ery time windows for shipments. Also, due to the shortshort-er planning pshort-eriods, congestion effects have a greater impact on LTL operations (Golob and Regan, 2001).
Second, the aforementioned carrier collaboration studies from liner shipping, rail, and TL industries do not explicitly ac-count for congestion. However, for the small- to medium-sized LTL carrier industry, congestion effects can represent up to 50% of the time spent in moving a shipment (Cheung and Muralidharan, 2000; Kawamura, 1999; Boardman, 1997). Conse-quently, congestion effects can have significant monetary impacts on LTL operations. Hence, in the LTL collaboration context, there is a need to model these effects and develop efficient strategies that can alleviate the associated costs. As discussed in Section1, in the DDSCCP context, we account for these congestion effects through the holding costs.
Third, the physical characteristics of the liner shipping, rail, and TL industries cannot be generalized to the small- to med-ium-sized LTL carrier collaboration problem in scale, and possibly other aspects. For example, the liner shipping industry operates on large-scale sea-based networks that span the globe, and routes can change due to demand fluctuations which dictate the service area. Rail industry networks are typically large point-to-point networks with fixed routes, and hence, the shipments are restricted to the fixed network. By contrast, the small- to medium-sized LTL carriers operate under much smaller point-to-point network systems; that is, with fewer number of interconnected transfer facilities (Belman and White III, 2005). Point-to-point networks move LTL shipments directly between facilities, such as end-of-line terminals, without intermediate stops to consolidate loads.
Large LTL carriers use hub-and-spoke networks. The point-to-point network configuration has two significant advantages over the hub-and-spoke models: (i) the carriers do not have to digress to potentially distant intermediate terminal locations, thus making the trips faster, and (ii) they save carriers additional transfer and transit costs because they bypass consolida-tion terminals (Belman and White III, 2005; Taylor et al., 1995). Another key advantage of the LTL point-to-point network structure over others is the spatial flexibility in terms of routing shipments between points. For example, in the case of a single shipment, the minimum amount a carrier of interest incurs is the total cost associated with the least cost collaborative route over the point-to-point network. That is, a minimum cost flow problem (Ahuja et al., 1993) can be solved for each shipment.
To this point, the current dynamic carrier collaborative literature and the dynamic LTL carrier collaboration problem have been compared in terms of the planning horizon, congestion effects, and characteristics of the operating networks. There are two additional key conceptual differences between them. The first relates to the handling of shipments and the second to the deterministic time-dependent collaborative capacities. In the first context, shipments are fixed but are subject to entry and exit time thresholds. This allows us to capture the decision processes of load dispatchers with regard to meeting the ship-ment time windows over a collaborative network. The second aspect enables us to capture the combinatorial aspect of the DDSCCP routes over a time-expanded graph.
To the best of our knowledge, no previous study has explicitly modeled a time-dependent carrier–carrier collaborative problem for the small- to medium-sized LTL industry. As discussed in Section1,Hernandez and Peeta (2010)address car-rier–carrier collaboration for small- to medium-sized LTL firms from a static perspective. It focuses on analyzing the influ-ence of relevant factors on the potential for collaboration. The current study differentiates itself fromHernandez and Peeta (2010)and the previous studies discussed heretofore in terms of how shipments enter and exit the collaborative system and how combinatorial routes are captured in a dynamic context. While the planning-focused DDSCCP addressed in this study represents congestion effects through holding costs and assumes prior knowledge of the time-dependent collaborative capacities, it also provides a starting point to address the small- to medium-sized LTL collaborative paradigm in an opera-tional context. For example, a rolling horizon method (Peeta and Mahmassani, 1995; Mitrovic´-Minic´ et al., 2004) can be used to operationally deploy the dynamic LTL carrier collaborative problem, as better estimates of the available collaborative capacities can be obtained closer to real-time.
3. Mathematical formulation of DDSCCP
3.1. Problem description and assumptions
The DDSCCP seeks to determine a time-dependent collaborative strategy for the carrier of interest by identifying a set of collaborative routes that minimize the total cost to service its demand needs. Thereby, the carrier of interest may acquire some capacity from the collaborative partners for some legs of an origin–destination route based on the available time-dependent collaborative capacities. The operational networks of the various collaborating carriers can be completely iden-tical geographically or overlap in some segments relative to the carrier of interest. The associated network characteristics include the available collaborative capacities and collaborative rates.
The following assumptions are made in the DDSCCP: (i) all carriers first utilize their available capacity before committing excess capacity for collaboration, (ii) the costs associated with loading/unloading a shipment (transfers) and the costs asso-ciated with the holding of a shipment at a transfer location (collaborative holding costs) are divided equally between the collaborative carriers and the carrier of interest. Although in this work we assumed that the costs are divided equally, there
exist methods based on cooperative game theory and auction theory that allocate either resources or monetary gains based on the level of participation in the collaboration (Krajewska et al., 2008; Agarwal and Ergun, in preparation). Lastly, (iii) transfer locations are capable of crossdocking operations. Further, the DDSCCP assumes that shipments are not split under the collaborative strategy: (i) a shipment is not split to multiple carriers during a transfer in a time period, and (ii) a ship-ment is not split to multiple truck routes (arcs) of the same carrier during a transfer in a time period.
3.2. Problem formulation
This section describes the mathematical programming formulation of the DDSCCP. The notation, constraints, and objec-tive function are discussed, followed by the characterization of the formulation properties.
3.2.1. Sets
Let a shipmentk2Kbe served in time intervalt2Tof the planning horizon (24-h period) by a set of fixed transshipment facilitiesi2N(labeled facilities or nodes) which are interconnected by transit corridorsa2A(labeled arcs). The transit cor-ridorsa2Athat originate from facilityi2Nare depicted as
a
2C(i) and those heading to facilityi2Narea
2C1(i). A ship-mentk2Kmay be served by a transit corridora2Aonly through a collaborative carrierq2Qoperating in this corridor in time intervalt2T. Fixed transshipment facilitiesi2Nand collaborative carriersq2Qform our collaborative network. A shipmentk2Kenters the collaborative network through an origin facilityO(j
) and exits through a destination facility D(j
). For a shipmentk2K, its origin facilityO(j
) and its destination facilityD(j
) constitutes its origin–destination pair. 3.2.2. ParametersEach shipmentk2Khas an associated volumedj, a latest entry time thresholdbjat its origin facilityO(
j
), and an earliestexit time thresholdkjat its destination facilityD(
j
).The travel time of any shipment through transit corridora2Aiss
afor all collaborative carriersq2Q. The cost of acquiring a unit of capacity (volume) from a collaborative carrierq2Qon transit corridora2Ais the collaborative rate1
aq. The functional form of the collaborative rate1
aqis as follows:1
aq¼CTCþCAC ð1ÞwhereCTCrepresents the transfer cost per shipmentdj. In Eq.(1),CACdenotes the per unit collaborative capacity acquisition
cost as defined inHernandez and Peeta (2010):
CAC¼ ð1dÞLaþSa ð2Þ
whereLarepresents the per unit linehaul cost for arca,Sarepresents the fuel surcharge cost for arca, anddrepresents the collaborative discount rate. The discount ratedis associated only with the linehaul costs as in practice carriers do not dis-count the fuel surcharge costs which are usually a percentage of the non-disdis-counted linehaul costs. We viewdas represent-ing the degree of collaboration among the carriers. Hence, a largerdvalue would imply a greater degree of collaboration among the various carriers in terms of enabling the collaboration.
For each time interval a shipment in a facilityi2Nis not transshipped immediately (as in cross-docking operations) and held in the same facility for the next time interval, we assign a holding cost#iper time interval. As discussed inSection1, the holding costs#iare assumed to vary for each facilityi2N. They are obtained using the ranges specified inKawamura (1999)
on the value of time per unit of shipment for LTLs. As stated in Section3.1, they are divided equally between the carrier of interest and the collaborating carriers related to that transfer.
The available collaborative capacity of a carrierq2Qfor transit corridora2Aat time intervalt2Tiswaqt. If a collabo-rative carrierq2Qdoes not provide service for transit corridora2A, it is assumed that its available collaborative capacity waqfor that corridor is 0.
3.2.3. Variables
There are two set of decision variables. The first variable set models the shipments’ entrance and exit in the collaborative network. If a shipmentk2Kenters the collaborative network from facilityi2Nin time intervalt2Twe define variableUkit to take the value of 1, and 0 otherwise. If a shipmentk2Kexits the collaborative network from facilityi2Nin time interval t2Twe define variableHkitto take the value of 1, and 0 otherwise.
The second variable set represents the collaborative decision variables. If a shipmentk2Kis served through transit cor-ridora2Aby collaborative carrierq2Qin time intervalt2Twe defineYkaqtto take the value of 1, and 0 otherwise. If a ship-mentk2Kis held in facilityi2Nin time intervalt2Twe defineXkitto take the value of 1, and 0 otherwise. It should be noted here that while holding of shipments at facilities entails costs, it may be required in the dynamic collaborative network to either establish the feasibility of transshipment or allow optimal routing of shipments in later time intervals when con-gestion effects are lower.
3.2.4. Modeling latest entry and earliest exit time widows
A key conceptual difference between the more conventional dynamic network problems and the problem addressed here is how shipments enter and exit the collaborative system for the carrier of interest. Conventional dynamic network problems
treat shipments dynamically while holding arc capacities constant (Aronson, 1989; Hall et al., 2007). By contrast, in the DDSCCP the shipmentsdjare fixed, but capacities are dynamic and knowna priori. To ensure consistency with real-world
freight operations, the shipmentsdjare subject to thresholds on the latest entry into the carrier service network and the
earliest exit from it to meet the shipment time windows associated with pickup and delivery, respectively. By introducing shipments into a time-expanded network in this manner, we are able to reduce the number of variables and constraints, entailing greater computational savings. This is because the number of time periods for a shipment to enter or exit a system is constrained by the time window thresholdst: 16t6bkandt:kk6t6jTj, respectively. From an operational perspective, this representation is important because we are now able to more closely model load dispatchers decisions when faced with the task of ensuring the timely routing of their shipments over a dynamic collaborative network. To illustrate this further,
Figs. 1–3represent graphical depictions for the latest entry, intermediate, and earliest exit ‘‘flow’’ decisions through a time-expanded network, respectively. They are discussed hereafter.
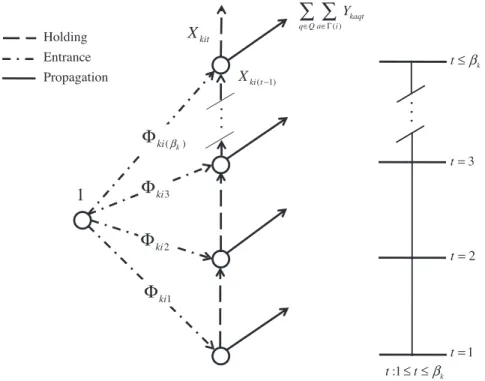
3.2.4.1. Latest entry. Fig. 1illustrates the dynamic graph representation of a shipment entrance decision under a latest entry time thresholdt: 16t6bk. A unit decision of ‘‘flow’’Ukitenters the system in a time intervaltsubject to the latest time entry thresholdt: 16t6bkvia an origin facility instantaneously. Further, this unit decision is either heldXkitat that facility or it is transshipped to the next facility through a collaborative carrier acquisition decisionYkaqt. This represents the decision of the load dispatcher having received the shipment, and it either being held for some time period (that is, waiting to be loaded) until collaborative capacity is available or it being immediately assigned to an available collaborative carrier for further ship-ment. From a model formulation standpoint, using this explicit time-expanded approach reduces the problem computational complexity by circumventing the need for several more time-dependent entry time variables and the associated feasible search space.
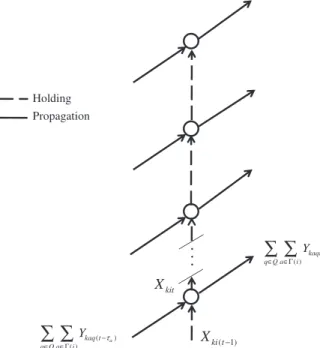
3.2.4.2. Intermediate. Fig. 2illustrates the dynamic graph representation of a shipment propagating through intermediate facilities. Here, shipment flow decisions propagate through the time-expanded graph and are either held (Xkit) at a facility or propagated through by collaborative carrier acquisition decisions (Ykaqt).
3.2.4.3. Earliest exit. Fig. 3illustrates the dynamic graph representation of a shipment exit decision under earliest exit time thresholdt:kk6t6jTj. A unit decision of ‘‘flow’’Hkitexits the system instantaneously in a time intervaltsubject to the earliest time exit thresholdt:kk6t6jTjin one of the following two ways. First, it may be an upstream-acquired collabo-rative capacity acquisition decision Ykaq(t
s
a) related shipment exit. Here, as stated in Section3.2.2,s
arepresents the amount of time for the shipment to travel the length of the transit corridora. Second, the exit may be from a holding decision Xkit, where the holding represents the waiting of a shipment to be unloaded due to congestion at the facility.:1
kt
≤ ≤
t
β
kitX
( ) kaqt q Q a iY
∈ ∈Γ∑ ∑
1
t
=
2
t
=
3
t
=
kt
≤
β
1 kiΦ
Holding
Entrance
Propagation
X
ki t(−1) • • •1
Φ
ki3 2 kiΦ
( k) ki βΦ
• • •3.2.5. Constraints
Next, we formulate the constraint set of the DDSCCP. It consists of two sets of constraints. The first set of Constraints(3)– (5)models the independent transshipment of shipments through the collaborative networks. The second set of Constraints (6) establishes an upper bound on the available collaborative carrier capacity (in terms of volume). The constraints are as follows: kit
X
( ) ( ) a kaq t q Q a i Y −τ ∈ ∈Γ∑ ∑
Holding Propagation ( 1) ki tX
− • • • ( ) kaqt q Q a i Y ∈ ∈Γ∑ ∑
Fig. 2.Dynamic graph representation of shipment propagating through intermediate facilities.
2 k t=λ + : k t
λ
≤ ≤t T 1 ( ) ( ) a kaq t q Q a i Y τ − − ∈ ∈Γ∑ ∑
k t≥λ t≤T ( k) kiλΘ
Holding Exit Propagation ( 1) ki t X −1
ki TΘ
1 k t=λ + ( k 1) kiλ +Θ
( k 2) kiλ +Θ
kit X • • • • • •X t:16t6bk
U
kit¼18
k2K; i2OðkÞ ð3Þ X q2Q X a2CðiÞYkaqtXkitþ
U
kit¼08
k2K; i2OðkÞ; t2T ð4aÞ X q2Q X a2C1 ðiÞ YkaqðtsaÞþXkitðt1Þ X q2Q X a2CðiÞ YkaqtXkit¼08
k2K; i2NfOðkÞ;DðkÞg; t2T; tPs
a ð4bÞ X q2Q X a2C1ðiÞYkaqðtsaÞþXkitðt1Þ
H
kit¼08
k2K; i2DðkÞ; t2T; ts
a ð4cÞ X t:kk6tjTjH
kit¼18
k2K; i2DðkÞ ð5Þ X k2K dkYkaqt6waqt8
a2A; q2Q; t2T ð6ÞU
kit;H
kit;Xkit2 f0;1g8
k2K; i2N; t2T ð7ÞYkaqt2 f0;1g
8
a2A; k2K; q2Q; t2T ð8ÞConstraints(3)–(5)are the mass balance constraints. Constraint(3)ensures that a shipmentKenters the collaborative net-work at exactly one time instance while satisfying the latest entry time thresholdbk(as discussed in Section3.2.4and illus-trated inFig. 1).
Constraint (4) consists of three node flow propagation conservation constraints corresponding to the origin, intermediate, and destination nodes in the network, respectively. Constraint set(4a)corresponds to the origin nodes (facilities). It states that at most one unit of flow may enter an origin facility, and that it will either be serviced to the next facility or remain in the same facility for that time interval (as shown inFig. 1). Constraint set(4b)is the mass balance equation at intermediate nodes (at non-origin and non-destination facilities). The shipments at an intermediate facility may arrive from upstream facilities or may be held at that facility in the previous time interval. They can either be shipped out of the facility to a down-stream facility or remain in the same facility for that time interval (as shown inFig. 2). Constraint set(4c)corresponds to the destination nodes. A shipment may originate from an upstream facility that reaches the destination facility in this time inter-val or be held at the destination facility in the previous time interinter-val. This shipment either exits from the network at this destination facility or is held in it for this time interval (as shown inFig. 3). Constraint(5)ensures that a shipmentkexits the collaborative network at exactly one time instance while satisfying the earliest exit time thresholdkk(as discussed in Section3.2.4and illustrated inFig. 3).
Constraint(6)represents the collaborative capacity constraints. It ensures that the capacity acquired from a collaborative carrier (left-hand side of(6)) is less than its time-dependent available capacity (right-hand side of(6)) on that transit cor-ridor. Constraint sets(7) and (8)represent the 0–1 integrality conditions for the decision variables.
3.2.6. Objective function
The objective function of the DDSCCP problem seeks to minimize the total costs incurred by the carrier of interest and is represented as follows: MinX k2K X a2A X q2Q X t2T
1
aqdkYkaqtþ X k2K X i2N X t2T #idkXkit ð9ÞIt consists of two terms. The first term represents the collaborative capacity acquisition costs, and the second term denotes the holding costs at the facilities. The overall acquisition costs are obtained as the summation of the product of the collab-orative capacity acquisition rate
1
aq, the demanddk, andYkaqt(the decision on whether time-dependent capacity is acquired on a transit corridor). The overall holding costs are obtained as the summation of the product of the holding costs0ifor that facility, the demanddk, andXkit(the decision on whether this demand is held by this facility in this time interval). Hence, Eq. (9) subject to Constraints(3)–(8)represents the formulation of the DDSCCP.3.2.7. Properties
This section discusses some properties of the proposed DDSCCP formulation.
3.2.7.1. Classification.The proposed formulation of the DDSCCP belongs to the class of binary (0–1) multi-commodity mini-mum cost flow problems. This is because, as depicted inFigs. 1–3, Constraints(3)–(5)are node flow conservation constraints. They illustrate how a shipment will ‘‘flow’’ through a time-expanded network. The (static) nodes of this time-expanded net-work are the fixed transshipment facilities and the (static) arcs are collaborative carriers at each of the transit corridors. It
can be noted that Constraints(3), (4a)–(4c),(5) can be written independently for each shipment. Constraint set(6)is the equivalent shared capacity constraint, which binds the rest of the formulation together.
Due to the above mathematical structure, branch-and-cut algorithms can be applied to modest-sized problem instances (Mitchell, 2002), as is the case here since small- to medium-sized LTL carriers operate under modest collaborative network sizes. Another common approach to solve multi-commodity minimum cost flow problems is the Lagrangian relaxation method, especially for large problem instances (such as large operating networks) involving the shared capacity Constraint
(6). By dualizing this constraint, independent multiple minimum cost flow problems can be solved. However, due to the (0– 1) binary nature of the formulation, this implies solving multiple independent shortest path problems. Other mathematical decomposition methods have also been proposed for this class of problems (Ahuja et al., 1993; Martin, 1999).
3.2.7.2. The DDSCCP corresponding graphs are acyclic.The acyclic property is characteristic of time-expanded graphs. It is proved for the DDSCCP by contradiction. Assume that there is a directed cycle in the graph structure. The directed cycle will allow a flow to pass either from anXkitorYkaqtarc twice in time intervalt2T. But the flow entering theXkitorYkaqtarc arrives from previous time intervals and exits at later time intervals, which are exclusively connected by adjacentXkitorYkaqtarcs following the single direction that time flows. Hence, a flow can never go back in time in order to re-enter the sameXkitor Ykaqtarcs in time intervalt2T. This contradicts the initial assumption and completes the proof.
The physical interpretation is that there is no path in the corresponding graphs of the DDSCCP allowing a decision unit of capacity acquisition to return back in time. This property allows the implementation of the reaching shortest path algorithm for acyclic networks (Ahuja et al., 1993), which has a running time complexity ofO(|A|).
3.2.7.3. Total unimodularity.The DDSCCP formulation is characterized by total unimodularity, which guarantees optimum integer decision variable values. The proof for this guarantee is provided inAhuja et al. (1993)as the DDSCCP is classified as a binary (0–1) multi-commodity minimum cost flow problem. This property enables the circumvention of much slower integer programming solution algorithms through the use of computationally less expensive linear programming techniques.
The total unimodularity property aids our problem in the following ways. First, in this study, we use the GAMS/CPLEX package to solve the DDSCCP. In the context, the branch-and-cut algorithm in GAMS/CPLEX is utilized which solves the linear program without the integer constraints to obtain the optimal solution. The unimodularity property precludes the need for triggering the cutting plane algorithm here. Second, for larger problems instances’ involving large networks, where decom-position methods may be appropriate (as discussed in Section3.2.7.1), unimodularity helps in the context of the decompo-sition to multiple independent shortest path problems. Therefore, for each independent shortest path problem, the integrality constraints can be dropped and the problem can be solved using linear shortest path algorithms (like the reaching shortest past algorithm) to obtain integer 0–1 solution sets which satisfy the original integrality constraints.
Third, the total unimodularity property implicitly addresses the two key assumptions related to precluding the splitting of shipments as stated in Section3.1. Constraints(3)–(5), along with integrality Constraints (7) and (8), intrinsically ensure that a shipment is not split to multiple carriers during a transfer in a time period, and that a shipment is not split to multiple truck routes (arcs) of the same carrier during a transfer in a time period. Therefore, the following constraints, which would otherwise be required, are redundant:
X q2Q Ykaqt61
8
a2A; k2K;t2T ð10Þ X a2CðiÞ Ykaqt618
k2K; i2N;q2Q; t2T ð11Þ 4. ExperimentsThe study experiments analyze the performance of the DDSCCP model for various scenarios in terms of the numbers of shipments and network sizes. The performance is assessed in terms of the computational time required to solve the prob-lems to optimality. In addition, experiments are conducted to explore the benefits of collaboration in a dynamic setting: (i) as a viable option to the non-collaborative strategy of short-term leasing, through varying degrees of collaboration, and (ii) as a means to reduce the effects of holding costs.
4.1. Data generation
The data generated for this study closely follows the industry ranges introduced inHernandez and Peeta (2010)for: (i) the collaborative rates from Eq.(1), (ii) the short-term leasing costs, (iii) the O–D demand for multiple O–D pairs, (iv) the col-laborative capacities, and (v) the holding costshiusing the value of time ranges fromKawamura (1999)for commercial vehi-cle operations. A diesel fuel price of $2.79 per gallon is assumed.
4.2. Solution and implementation details
The computing environment consists of a DELL XPS machine with an Intel Core™ 2 Duo processor T8300, under the Win-dows Vista™ operating system with 2.40 GHz and 4 GB of RAM. The GAMS/CPLEX optimization software version 22.9 with ILOG CPLEX 11.0 is used.
The binary (0–1) multi-commodity minimum cost flow problem representation of the DDSCCP is solved using the branch-and-cut algorithm (Caprara and Fischetti, 1997;Martin, 1999) in GAMS/CPLEX. This algorithm is used because the scope of the operations in this study represents that of the small- to medium-sized LTL carrier industry. That is, these carriers can be classified as local (carriers that typically operate within the confines of a state) or regional (carriers that typically operate between two or more states in a region), and may at most be associated with about a dozen or so transfer facilities (Belman and White III, 2005). Hence, their network sizes are modest. A network simplex (NS) method is used to exploit the inherent network structure of the DDSCCP and to provide the branch-and-cut algorithm with an initial solution (Ahuja et al., 1993; Hindim and Basta, 1994). This initial solution represents an optimal solution when the integrality constraints are relaxed for the DDSCCP problem, and is obtained before the branch-and-bound portion of the branch-and-cut algorithm is utilized. The optimal initial solution is then used to initiate the branch-and-bound portion of the branch-and-cut algorithm. Also, the NS method is imbedded in the branch-and-cut algorithm and is used to determine the solutions for the subproblems in the fath-oming and pruning portions after the algorithm has been initiated (Mitchell, 2002).
Node ID State City
1 Iowa Des Moines 2 Illinois Chicago 3 Indiana Indianapolis 4 Ohio Toledo 5 Missouri Springfield 6 Illinois East St. Louis 7 Kentucky
Lexington-Fayette 8 West Virginia Charleston 9 Arkansas Littlerock 10 Mississippi Jackson 11 Tennessee Knoxville 12 North Carolina Charlotte
(a)
(b)
Similarly, initial solutions are also generated for the branch-and-cut algorithm through the use of the dual simplex (DS) method. As with the NS method, an optimal initial solution is obtained by relaxing the integrality constraints and using a DS method for the resulting linear program, which is then used to initiate the branch-and-cut algorithm. This DS method is also imbedded in the branch-and-cut algorithm and is used to solve the subproblems in the fathoming and pruning portions of the algorithm. The NS and DS based branch-and-cut algorithms are then compared. As discussed in Section3.2.7, for larger and more complex LTL carrier operations, decomposition methods are expected to be more appropriate due to the added computational burden from larger operating networks and number of shipments.
4.3. Experiment setup
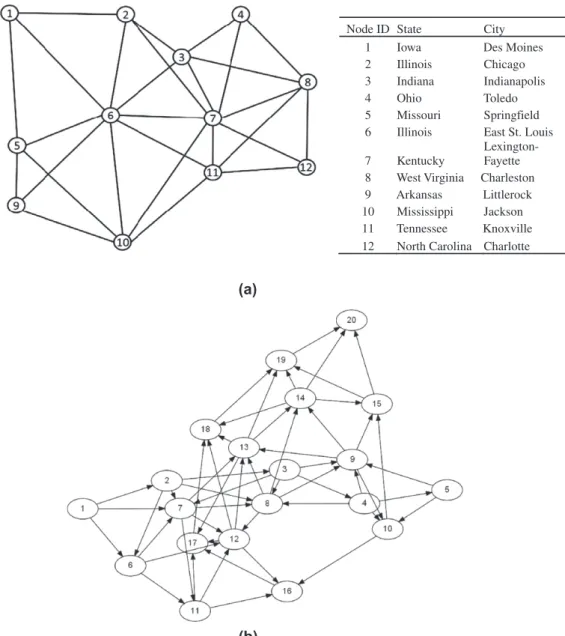
The experimental set up consists of the carrier of interest and four collaborating carriers, for a total of five collaborating carriers for the DDSCCP problem. The additional problem parameters take values according to the following ranges: network size in terms of the number of nodes (12 and 20), and the corresponding number of shipments (1, 5, 10, and 15), and (1, 5, 10, 15, and 20), respectively. The 12-node network represents the U.S. Midwest region, and the 20-node network was randomly generated using MATLAB as shown inFig. 4. We use four degrees of collaboration, 0%, 30%, 50%, and 80%, to assess the via-bility of the collaboration. As the data is simulated, ten randomly generated data sets consistent with the small- to medium-sized LTL industry observed ranges are created for each test scenario (in terms of network size and number of shipments). For each network size and number of shipment configuration, the collaborative rates and holding costs are identical in the randomly generated data. However, the demand and collaborative capacities are different for all cases.
5. Analysis of results
5.1. Collaboration versus short-term leasing option
The potential for collaboration among carriers is investigated by focusing on the level of monetary savings due to collab-oration. As stated earlier, the level of collaboration is reflected through the degree of collaboration, which takes values 0%, 30%, 50% and 80%. Here, the 0% case represents a collaborative strategy in which the collaborative capacity is made available to the carrier of interest without any discount on the rate (Hernandez and Peeta, 2010). As seen inTable 1, even the 0% col-laborative discount rate case for all scenarios led to savings over the short-term leasing option (which is the ‘‘no collabora-tion’’ case), indicating improved potential profits due to collaboration. Accordingly, the increased benefit under the higher discounted rates illustrates that higher discounted rates leads to greater operational efficiencies in terms of collaboration for the carrier of interest. Further,Table 1illustrates that the cost to the carrier of interest increases with the number of ship-ments for both the collaborative and short-term leasing alternatives.
5.2. Effects of holding costs
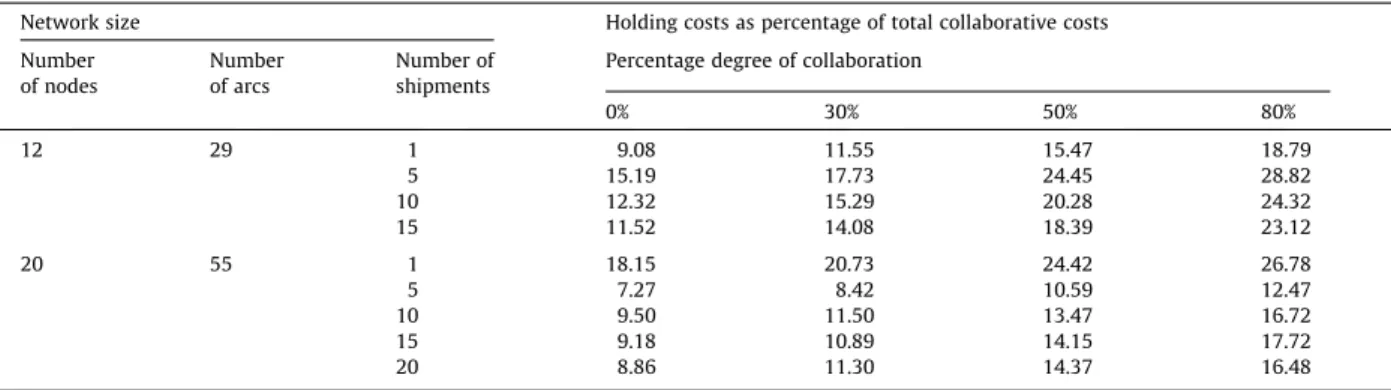
Holding costs reduce the profits of the carrier of interest and can be attributed to waiting for a transfer to occur (queue at terminal) or to mechanical breakdowns.Table 2illustrates the effect of holding costs on the carrier of interest as the degree of collaboration increases. This is done by illustrating the holding costs as a percentage of the total collaborative costs. The results indicate that the holding costs incurred by the carrier of interest increase as the degree of collaboration increases. This is because the capacity acquisition costs decrease with the degree of collaborative due to the lower acquisition rates. Further, shipments may experience longer wait times in order to access more cost-attractive capacity. For the scenarios involving the 12-node network with five shipments, and 20-node network and one shipment, the percentage holding costs for each level of collaboration are relatively higher. This is attributed to the higher randomly generated values of the holding costs for these scenarios. Additionally, lower holding costs imply greater efficiency for the collaborative system. As seen in Table 1
Comparison of short-term leasing (no collaboration) and carrier–carrier collaboration considering the effects of holding costs.
Network size Collaborative cost ($) Percentage savings over no collaboration
Number of nodes Number of arcs Number of shipments No collaboration ($)
Percentage degree of collaboration Percentage degree of collaboration
0% 30% 50% 80% 0% 30% 50% 80% 12 29 1 1171 1156 909 679 559 1.34 21.34 41.27 51.67 5 9050 8765 7507 5444 4618 3.25 14.35 37.89 47.31 10 17,584 16,799 13,540 10,209 8510 4.67 19.40 39.23 49.34 15 21,816 21,230 17,366 13,303 10,581 2.76 18.20 37.34 50.16 20 55 1 1283 1267 1109 942 859 1.23 12.45 25.67 32.21 5 5650 5569 4808 3823 3247 1.45 13.67 31.36 41.70 10 10,975 10,832 8944 7642 6153 1.32 17.43 29.45 43.20 15 17,067 16,721 14,101 10,850 8661 2.07 15.67 35.11 48.20 20 24,273 23,414 18,366 14,439 12,592 3.67 21.56 38.33 46.22
Table 2, even if the carrier of interest takes advantage of an 80% discount in collaboration, inefficiencies may occur due to the increased holding times. However, in most instances, the holding times for the collaborative discount scenarios represent a significant improvement over the values observed byBartholdi and Gue (2000)of about 21.8%, who focus on improving ter-minal design to decrease holding time for LTLs.
Table 3shows the average number of holding time periods for each arc that comprises the optimal collaborative route for each test scenario overall levels of collaboration. The average number of holding time periods ranges from 1.01 to 1.24. The results illustrate that carrier collaboration can conceivably reduce the effects of delays by decreasing the amount of time spent idled at terminals, which can potentially be achieved by the adoption of crossdocking practices by these terminals (Bartholdi and Gue, 2000).
5.3. Capacity utilization
Table 4illustrates the capacity utilization by the carrier of interest as a percentage of the available capacity from the col-laborating carriers overall levels of collaboration. The values represent the average over 10 runs conducted for each scenario Table 2
Effect of holding costs on collaborative costs for the carrier of interest.
Network size Holding costs as percentage of total collaborative costs
Number of nodes Number of arcs Number of shipments
Percentage degree of collaboration
0% 30% 50% 80% 12 29 1 9.08 11.55 15.47 18.79 5 15.19 17.73 24.45 28.82 10 12.32 15.29 20.28 24.32 15 11.52 14.08 18.39 23.12 20 55 1 18.15 20.73 24.42 26.78 5 7.27 8.42 10.59 12.47 10 9.50 11.50 13.47 16.72 15 9.18 10.89 14.15 17.72 20 8.86 11.30 14.37 16.48 Table 3
Average number of holding time periods for each arc that comprise the optimal collaborative route overall levels of collaboration.
Network size
Number of nodes Number of arcs Number of shipments Average number of holding time
periods for each arc
12 29 1 1.04 5 1.14 10 1.20 15 1.24 20 55 1 1.19 5 1.01 10 1.07 15 1.07 20 1.04 Table 4
Percentage collaborative capacity utilization overall levels of collaboration.
Number of nodes Number of arcs Number of shipments Average percentage collaborative
capacity utilization 12 29 1 48 5 51 10 47 15 60 20 55 1 51 5 48 10 50 15 54 20 61
consisting of the network size and number of shipments. The utilization percentages range from 48% to 61%. The results indi-cate the potential for carriers to reduce deadheading and produce returns on excess capacity, which is vital for the surviv-ability of small- to medium-sized LTL carriers in a highly competitive industry.
5.4. Computational experience
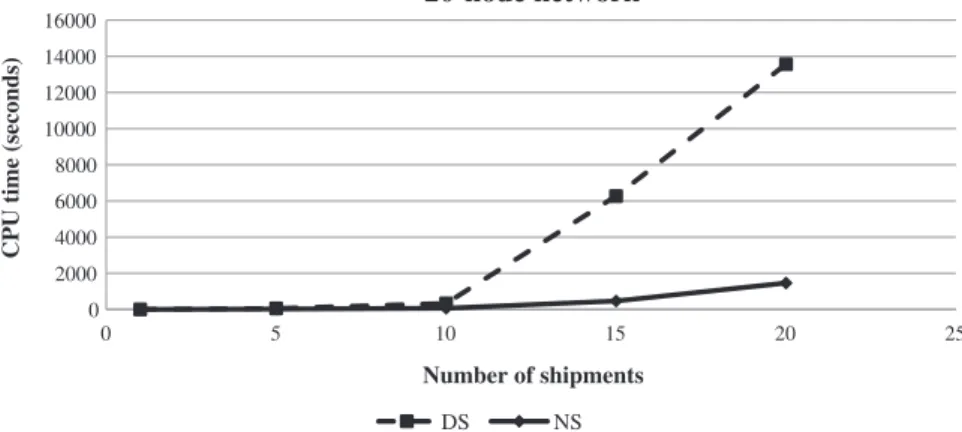
Table 5 summarizes the CPU computational times for the optimal solutions obtained through the DS and NS based branch-and-cut algorithms. The computational times increase with the number of shipments and the network size. Optimality
Table 5
DS and NS based branch-and-cut algorithm optimal solution computational time results for the 12-node and 20-node networks.
Network size Optimal solution times
Number of nodes Number of arcs Number of shipments DS (s) NS (s)
12 29 1 1.34 0.36 5 178.32 8.77 10 789.63 201.93 15 3175.30 678.21 20 55 1 1.49 0.56 5 55.78 21.34 10 334.77 67.89 15 6269.72 468.34 20 13564.52 1462.67 0 500 1000 1500 2000 2500 3000 3500 0 5 10 15 20
CPU time (seconds)
Number of shipments
12-node network
DS NS
Fig. 5.Comparison of the computational performance for the 12-node network for the DS and NS based branch-and-cut algorithms.
0 2000 4000 6000 8000 10000 12000 14000 16000 0 5 10 15 20 25
CPU time (seconds)
Number of shipments
20-node network
DS NS
for each scenario was achieved through the DS and NS based branch-and-cut algorithms, and the solutions are identical irre-spective of the method. However, as seen inTable 5, the DS and NS based branch-and-cut algorithms differ in the amount of time taken to reach an optimal solution for all scenarios.
This is further reinforced byFigs. 5 and 6, which illustrate the CPU computational times for the optimal solutions obtained through the DS and NS based branch-and-cut algorithms under the 12- and 20-node network configurations. They indicate that the NS initial solutions and solutions obtained for the fathoming and pruning segments provided to the branch-and-cut algorithm require lesser time to solve the DDSCCP as the number of shipments increases, as reflected by the substantial de-crease in computational times over the DS based branch-and-cut algorithm. The significantly lower computational times un-der the NS based branch-and-cut algorithm are a direct result of the NS method exploiting the unun-derlying network structure of the problem by taking advantage of the unimodularity property (as discussed in Section3.2.7.3) when the integrality con-straints are relaxed (Ahuja et al., 1993).
6. Concluding comments
The contributions of the paper to the literature are twofold. First, this paper proposes a deterministic dynamic single car-rier collaboration problem (DDSCCP) that provides a mechanism to analyze the potential benefits of carcar-rier–carcar-rier collab-oration for the small-to medium-sized LTL industry by analyzing the effects of dynamic collaborative capacity and system delays. Second, addressed from a planning perspective, the DDSCCP assumes that the time-dependent collaborative capac-ities are knowna priori, and demand is fixed but subject to latest entry and earliest exit time thresholds consistent with LTL carrier operational networks. By viewing demand in this manner, we can model how load dispatchers make shipment deci-sions when faced with the task of ensuring the timely routing of their loads over a dynamic collaborative network. To the authors’ knowledge, this represents the first time that both these aspects have been addressed in the literature. In addition, the DDSCCP problem seeks to leverage advances in ICT technologies to manage excess capacity made available by partner carriers so as to address the issue of deadheading. Practices such as crossdocking in turn synergistically aid the collaboration paradigm by reducing system delays through improved delivery times.
A binary (0–1) multi-commodity minimum cost flow problem is presented for the DDSCCP, and solved using a branch-and-cut algorithm. A network simplex (NS) method is used to exploit the inherent network structure of the binary (0–1) multi-commodity minimum cost flow problems and to provide initial solutions to initiate the branch-and-cut algorithm and to also solve the subproblems for the fathoming and pruning segments of the branch-and-cut algorithm. The perfor-mance of the NS based and DS based branch-and-cut algorithms is compared. Significant computational gains are obtained using the NS-based branch-and-cut algorithm relative to the DS-based branch-and-cut algorithm in that the NS method leverages the underlying network structure of the problem. This approach is sufficient to address carrier collaboration in the small- to medium-sized LTL carrier networks due to their modest geographical extent of operation.
The study results indicate that holding costs are a key factor for the carrier of interest to consider while forming the col-laborative routes. That is, the carrier of interest has to consider the inherent trade-offs at the higher degrees of collaboration in terms of waiting for more affordable collaborative capacity and incurring higher holding costs. The study insights suggest that further improvement can be made through the common adoption of crossdocking practices. The results further indicate that as the degree of collaboration increases, the relative attractiveness of acquiring collaborative capacity also increases compared to the short-term leasing option, leading to increased capacity utilization. In summary, the study illustrates that carrier collaboration can be a viable strategy for reducing the effects of delays in a highly competitive industry where time has a direct impact on profits. To our knowledge, this is the first attempt to formulate a LTL carrier collaboration strategy which accounts for the effects of holding costs on LTL carrier collaboration from the perspective of small- to medium-sized LTL trucking firms.
References
Agarwal, R., Ergun, Ö., 2008. Ship scheduling and network design for cargo routing in liner shipping. Transportation Science 42 (2), 175–196. Agarwal, R., Ergun, Ö., in preparation. Network design and allocation mechanism for carrier alliances in liner shipping. Operations Research. Ahuja, R.K., Magnanti, T.L., Orlin, J.B., 1993. Network Flows: Theory, Algorithms, and Applications. Prentice Hall, Upper Saddle River, New Jersey. Aronson, J.E., 1989. Survey of dynamic network flows. Annals of Operations Research 20, 1–66.
Bartholdi III, J.J., Gue, K.R., 2000. Reducing labor costs in an LTL crossdocking terminal. Operations Research 48 (6), 823–832. Belman, D., White III, C., 2005. Trucking in the Age of Information. Ashgate Publishing Company, Burlington, VT.
Boardman, B.S., 1997. Real-time Routing of Shipments Considering Transfer Costs and Shipment Characteristics. PhD Dissertation. University of Arkansas. Caprara, A., Fischetti, M., 1997. Branch and cut algorithms. In: Dell’Amico, M., Maoli, F., Martello, S. (Eds.), Annotated Bibliographies in Combinatorial
Optimization. John Wiley, pp. 46–64 (Chapter 4).
Cheung, R.K., Muralidharan, B., 2000. Dynamic routing for priority shipments in LTL service networks. Transportation Science 34 (1), 86–98.
Esper, T.L., Williams, L.R., 2003. The value of collaborative transportation management (CTM): its relationship to CPFR and information technology. Transportation Journal, ABI/INFORM Global, 55–65.
Figliozzi, M.A., 2006. Analysis and Evaluation of Incentive Compatible Dynamic Mechanism for Carrier Collaboration. Transportation Research Record: Journal of the Transportation Research Board, No. 1966, Transportation Research Board of the National Academies, Washington, DC, pp. 34–40. Golob, T.F., Regan, A.C., 2001. Impacts of highway congestion on freight operation: perceptions of trucking industry managers. Transportation Research Part
A: Policy and Practice 35 (7), 577–599.
Hall, A., Hippler, S., Skutella, M., 2007. Multicommodity flows over time: efficient algorithms and complexity. Theoretical Computer Science 379, 387–404. Hernandez, S., Peeta, S., 2010. Static single carrier collaboration problem for less-than-truckload carriers. In: Proceedings of the 89th Annual Meeting of the
Hindim, K.S., Basta, T., 1994. Efficient solution of multiproduct, two-stage distribution-location problem. The Journal of the Operational Research Society 45 (11), 1316–1323.
Kawamura, K., 1999. Commercial Vehicle Value of Time and Perceived Benefit of Congestion Pricing. PhD Dissertation, University of California, Berkeley. Krajewska, M.A., Kopfer, H., Laporte, G., Ropke, S., Zaccour, G., 2008. Horizontal cooperation among freight carriers: request allocation and profit sharing.
Journal of the Operational Research Society 59 (11), 1483–1491.
Kuo, A., Miller-Hooks, E., Zhang, K., Mahmassani, H., 2008. Train Slot Cooperation in Multicarrier, International Rail-Based Intermodal Freight Transport. Transportation Research Record: Journal Transportation Research Board, No. 2043, Transportation Research Board of the National Academies, Washington, DC, pp. 31–40.
Martin, R.K., 1999. Large Scale Linear and Integer Optimization: A Unified Approach. Kluwer Academic Publishers, Norwell, Massachusetts.
Mitrovic´-Minic´, S., Krishnamurti, R., Laporte, G., 2004. Double-horizon based heuristics for the dynamic pickup and delivery problem with time windows. Transportation Research Part B 38 (8), 660–685.
Mitchell, J.E., 2002. Branch-and-cut algorithms for combinatorial optimization problems. In: Pardoslos, P.M., Resende, M.G.C. (Eds.), Handbook of Applied Optimization. Oxford University Press, Inc., New York, NY.
Peeta, S., Mahmassani, H.S., 1995. Multiple user classes real-time traffic assignment for on-line operations: a rolling horizon solution framework. Transportation Research Part C 3 (2), 83–98.
Song, J., Regan, A., 2004. An auction based collaborative carrier network. In: Proceedings of the 83rd Annual Meeting of the Transportation Research Board, Washington, DC.
Taylor, G.D., Harit, S., English, J.R., Whicker, G.L., 1995. Hub and spoke networks in truckload trucking: configuration, testing and operational concerns. The Logistics and Transportation Review 31 (3), 209–237.