Report No. 434 – A1
March 2010
P
Global experience
The International Association of Oil & Gas Producers has access to a wealth of technical knowledge and experience with its members operating around the world in many different terrains. We collate and distil this valuable knowledge for the industry to use as guidelines for good practice by individual members.
Consistent high quality database and guidelines
Our overall aim is to ensure a consistent approach to training, management and best prac-tice throughout the world.
The oil and gas exploration and production industry recognises the need to develop consist-ent databases and records in certain fields. The OGP’s members are encouraged to use the guidelines as a starting point for their operations or to supplement their own policies and regulations which may apply locally.
Internationally recognised source of industry information
Many of our guidelines have been recognised and used by international authorities and safety and environmental bodies. Requests come from governments and non-government organisations around the world as well as from non-member companies.Disclaimer
Whilst every effort has been made to ensure the accuracy of the information contained in this publication, neither the OGP nor any of its members past present or future warrants its accuracy or will, regardless of its or their negligence, assume liability for any foreseeable or unforeseeable use made thereof, which liability is hereby excluded. Consequently, such use is at the recipient’s own risk on the basis that any use by the recipient constitutes agreement to the terms of this disclaimer. The recipient is obliged to inform any subsequent recipient of such terms.
This document may provide guidance supplemental to the requirements of local legislation. Nothing herein, however, is intended to replace, amend, supersede or otherwise depart from such requirements. In the event of any conflict or contradiction between the provisions of this document and local legislation, applicable laws shall prevail.
Appendix I Data Presented in 1996 Datasheet:
ESD and Blowdown
Systems
This Appendix presents data previously given in the OGP (then E&P Forum) QRA
datasheet
ESD and Blowdown Systems
. The current data is copyright, as stated in
Section 2.1; the data previously presented is given in Table I.1 and Table I.2 for
reference but should be regarded as illustrative and checked against one of the
current sources listed in Table 2.1.
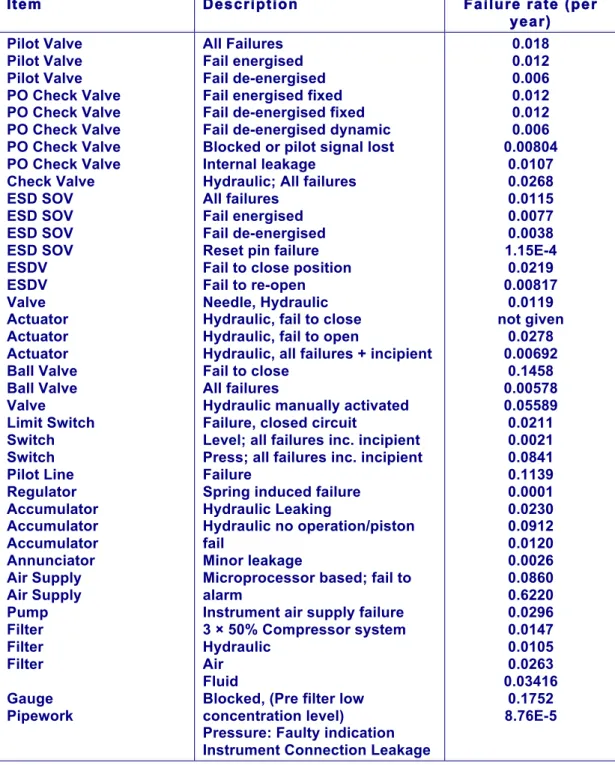
Table I.1 Illustrative Data for a Riser ESD Valves System
Item Description Failure rate (per
year) Pilot Valve Pilot Valve Pilot Valve PO Check Valve PO Check Valve PO Check Valve PO Check Valve PO Check Valve Check Valve ESD SOV ESD SOV ESD SOV ESD SOV ESDV ESDV Valve Actuator Actuator Actuator Ball Valve Ball Valve Valve Limit Switch Switch Switch Pilot Line Regulator Accumulator Accumulator Accumulator Annunciator Air Supply Air Supply Pump Filter Filter Filter Gauge Pipework All Failures Fail energised Fail de-energised Fail energised fixed Fail de-energised fixed Fail de-energised dynamic Blocked or pilot signal lost Internal leakage
Hydraulic; All failures All failures
Fail energised Fail de-energised Reset pin failure Fail to close position Fail to re-open Needle, Hydraulic Hydraulic, fail to close Hydraulic, fail to open
Hydraulic, all failures + incipient Fail to close
All failures
Hydraulic manually activated Failure, closed circuit
Level; all failures inc. incipient Press; all failures inc. incipient Failure
Spring induced failure Hydraulic Leaking
Hydraulic no operation/piston fail
Minor leakage
Microprocessor based; fail to alarm
Instrument air supply failure 3 × 50% Compressor system Hydraulic
Air Fluid
Blocked, (Pre filter low concentration level)
Pressure: Faulty indication Instrument Connection Leakage
0.018 0.012 0.006 0.012 0.012 0.006 0.00804 0.0107 0.0268 0.0115 0.0077 0.0038 1.15E-4 0.0219 0.00817 0.0119 not given 0.0278 0.00692 0.1458 0.00578 0.05589 0.0211 0.0021 0.0841 0.1139 0.0001 0.0230 0.0912 0.0120 0.0026 0.0860 0.6220 0.0296 0.0147 0.0105 0.0263 0.03416 0.1752 8.76E-5
Appendix II Data Presented in 1996 Datasheet:
Active Fire Protection
Systems
This Appendix presents data previously given in the OGP (then E&P Forum) QRA
datasheet
Active Fire Protection Systems
. The current data is copyright, as stated in
Section 2.1Error! Reference source not found.; the data previously presented is
given in Table II.1 to Table II.9 for reference but should be regarded as illustrative and
checked against one of the current sources listed in Table 2.1.
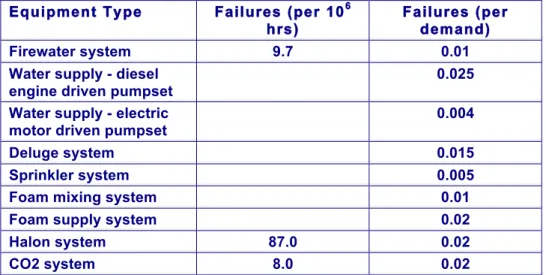
Table II.1 Typical failure rates for fire protection systems
Equipment Type Failures (per 106 hrs)
Failures (per demand)
Firewater system 9.7 0.01
Water supply - diesel engine driven pumpset
0.025 Water supply - electric
motor driven pumpset
0.004
Deluge system 0.015
Sprinkler system 0.005
Foam mixing system 0.01
Foam supply system 0.02
Halon system 87.0 0.02
CO2 system 8.0 0.02
Table II.2 Failure rates for pumps (source 1, oil and gas industry)
Pump type Failures
per demand Failures per 106 hrs operating Failures per 106 hrs calendar Electric motor (offshore) 0.0033 4719 56 (process industry) 0.043
Diesel engine (offshore) 0.023 25808 185
(process industry) 0.019
Table II.3 Failure rates for pumps
Pump type Failure mode Failures
per 106 calendar hrs Failures per demand All 22 0.094 While running 1.9 0.019 Positive displacement Fail to start 1.9 Centrifugal All 99 0.033
Table II.4 Failure rates for firewater distribution valves
Type Failures per
demand Failures per 106 operating hrs Air/hydraulic 0.0003 10 Motorised 0.001 10 Solenoid 0.001 10 Pressure regulating 50 Pressure relief 2.3
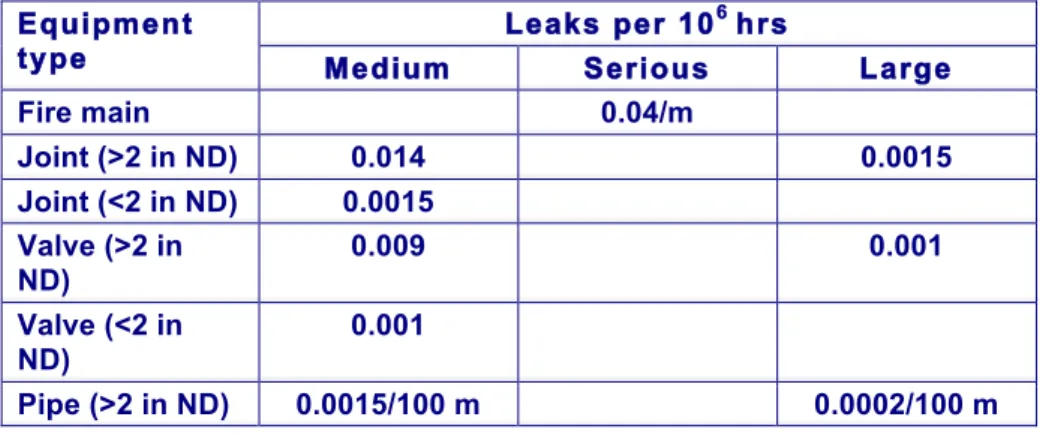
Table II.5 Failure rates for firewater distribution mains
Leaks per 106 hrs Equipment
type Medium Serious Large
Fire main 0.04/m Joint (>2 in ND) 0.014 0.0015 Joint (<2 in ND) 0.0015 Valve (>2 in ND) 0.009 0.001 Valve (<2 in ND) 0.001 Pipe (>2 in ND) 0.0015/100 m 0.0002/100 m
Table II.6 Failure rates for sprinklers
Equipment type Failure per demand Failures per 106 hrs System 0.005 Control valve 0.001 10 Automatic head 0.001
Table II.7 Failure rates for deluge sets
Equipment type Failure per demand Failures per 106 hrs System 0.015 Butterfly valve 0.001 10 Swing type valve 0.001 10 Pneumatic valve 0.0099 21
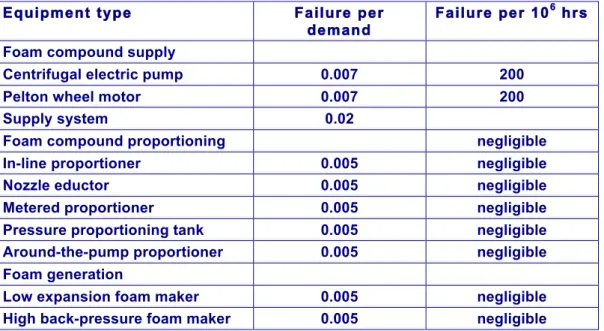
Table II.8 Failure rates for foam supply systems
Equipment type Failure per
demand
Failure per 106 hrs Foam compound supply
Centrifugal electric pump 0.007 200
Pelton wheel motor 0.007 200
Supply system 0.02
Foam compound proportioning negligible
In-line proportioner 0.005 negligible
Nozzle eductor 0.005 negligible
Metered proportioner 0.005 negligible
Pressure proportioning tank 0.005 negligible
Around-the-pump proportioner 0.005 negligible
Foam generation
Low expansion foam maker 0.005 negligible
High back-pressure foam maker 0.005 negligible
Table II.9 Failure rates for gaseous systems
Equipment type Failure per demand Failure per 106 hrs Halon System 0.0004* 0.02* 87 Discharge nozzle 0.27 CO2 System 8
Appendix III Data Presented in 1996 Datasheet:
Fire and Gas
Detection
This Appendix presents data previously given in the OGP (then E&P Forum) QRA
datasheet
Fire and Gas Detection
. The current data is copyright, as stated in Section
2.1; the data previously presented is given in Table III.1 for reference but should be
regarded as illustrative and checked against one of the current sources listed in Table
2.1.
Table III.1 Typical failure rates for fire and gas detection systems
Failure rate per 106 hrs Component λcrit per 106 hrs Cove-rage c λ det λSO λFTO TIF (Test Independent Failures) Gas detector, conventional catalytic 5.5 50% 3.0 1.0 1.5 3 × 10⁻⁴ - 0.1 Gas detector, conventional IR 4.0 70% 2.9 0.1 1.0 3 × 10⁻⁴ to 0.1
Gas detector, beam 7 70% 5 1 1 3 × 10⁻⁴ to 0.1
Smoke detector 4.0 40% 1.5 2.0 0.5 10-3 to 0.05
Heat detector 2.5 40% 1.0 1.0 0.5 0.05 to 0.5
Flame detector 7.0 40% 2.5 3.0 1.5 3 × 10⁻⁴ to 0.5
ESD push button 1.0 20% 0.2 0.6 0.2 10-5
FGD node (single PLC system)
80.0 90% 72.0 6.0 2.0 5 × 10⁻⁵ to 5 × 10⁻⁴
Field bus coupler 0.2 90% 0.18 0.02 0.001 10-5
Field bus CPU/ Communications unit
0.2 90% 0.18 0.02 0.001 10-5
λcrit = Total critical failure rate of the component. Rate of failures that will cause either
trip or unavailability of safety function (unless detected and prevented from causing such failure).
λdet = Rate of critical failure which will be detected by automatic self-test or by control
room monitoring. The effect of these failures on the Spurious Trip Rate (STR) depends on the operational philosophy of the system.
c = det / crit = Coverage of the automatic self-test + control room operator.
λSO = Rate of Spurious Operation (SO) failures, undetectable by automatic self-test.
The rate of Spurious Operation (SO) failures of a component contributes to the STR of the system (independent of operation philosophy).
λFTO = Rate of failures causing Fail-To-Operate (FTO) failures, undetectable by
automatic self-test. The FTO failures contribute to the Critical Safety Unavailability (CSU) of the component/system.
TIF = Test Independent Failures. The probability that a component which has just been functionally tested will fail on demand (applies for FTO failures only). The TIF probability is the probability that a component which has just been tested will fail on demand. This will include failures caused by for example improper location or inadequate design (software error or inadequate detection principle). An imperfect functional testing procedure will also contribute. Finally, the
possibility that the maintenance crew perform an erroneous functional test or fail to return the component to a working state (which is usually not detected before the next test) also contributes to the TIF probability.
Appendix IV Data Presented in 1996 Datasheet:
Blowout Prevention
Equipment
This Appendix presents data previously given in the OGP (then E&P Forum) QRA
datasheet
Blowout Prevention Equipment
. The current data is copyright, as stated in
Section 2.1; the data previously presented is given in Table IV.1 to Table IV.5 for
reference but should be regarded as illustrative and checked against one of the
current sources listed in Table 2.1.
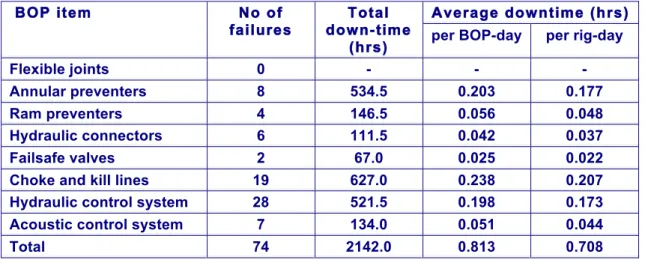
Table IV.1 Subsea BOP item specific average downtime
Average downtime (hrs)
BOP item No of
failures
Total down-time
(hrs) per BOP-day per rig-day
Flexible joints 0 - - -
Annular preventers 8 534.5 0.203 0.177
Ram preventers 4 146.5 0.056 0.048
Hydraulic connectors 6 111.5 0.042 0.037
Failsafe valves 2 67.0 0.025 0.022
Choke and kill lines 19 627.0 0.238 0.207
Hydraulic control system 28 521.5 0.198 0.173
Acoustic control system 7 134.0 0.051 0.044
Total 74 2142.0 0.813 0.708
Notes:
1.
BOP-days are all days from the time the BOP is first landed on the wellhead, until it is pulled the last time.2.
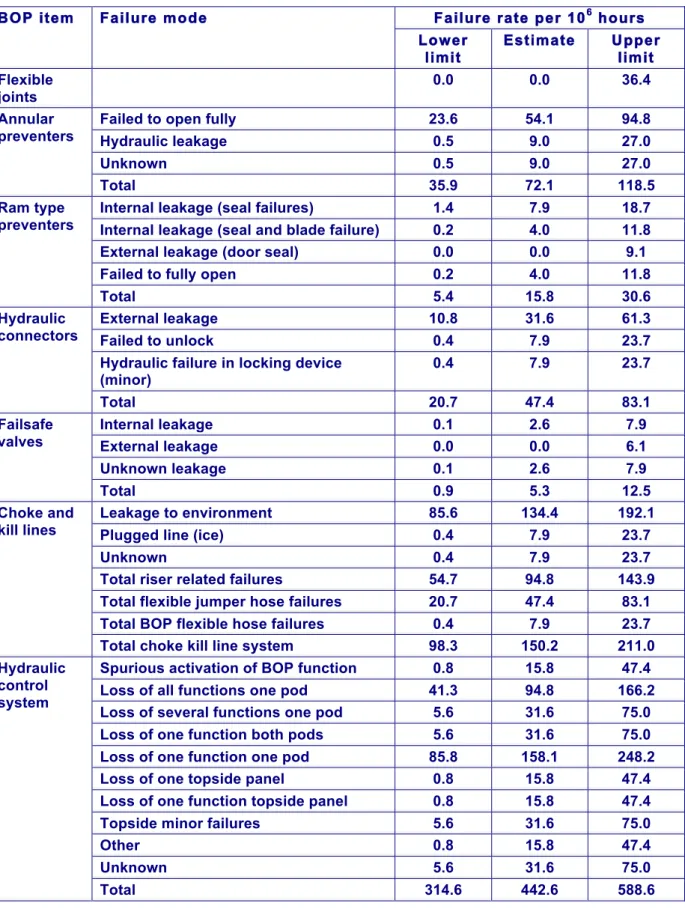
Rig-days is the time from when the rig arrives on location and drops the anchors, until the last anchor is pulled prior to leaving the location.Table IV.2 Subsea BOP item specific failure rate with 90% confidence
limits
Failure rate per 106 hours BOP item Failure mode
Lower limit Estimate Upper limit Flexible joints 0.0 0.0 36.4
Failed to open fully 23.6 54.1 94.8
Hydraulic leakage 0.5 9.0 27.0
Unknown 0.5 9.0 27.0
Annular preventers
Total 35.9 72.1 118.5
Internal leakage (seal failures) 1.4 7.9 18.7
Internal leakage (seal and blade failure) 0.2 4.0 11.8
External leakage (door seal) 0.0 0.0 9.1
Failed to fully open 0.2 4.0 11.8
Ram type preventers
Total 5.4 15.8 30.6
External leakage 10.8 31.6 61.3
Failed to unlock 0.4 7.9 23.7
Hydraulic failure in locking device (minor) 0.4 7.9 23.7 Hydraulic connectors Total 20.7 47.4 83.1 Internal leakage 0.1 2.6 7.9 External leakage 0.0 0.0 6.1 Unknown leakage 0.1 2.6 7.9 Failsafe valves Total 0.9 5.3 12.5 Leakage to environment 85.6 134.4 192.1
Plugged line (ice) 0.4 7.9 23.7
Unknown 0.4 7.9 23.7
Total riser related failures 54.7 94.8 143.9
Total flexible jumper hose failures 20.7 47.4 83.1
Total BOP flexible hose failures 0.4 7.9 23.7
Choke and kill lines
Total choke kill line system 98.3 150.2 211.0
Spurious activation of BOP function 0.8 15.8 47.4
Loss of all functions one pod 41.3 94.8 166.2
Loss of several functions one pod 5.6 31.6 75.0
Loss of one function both pods 5.6 31.6 75.0
Loss of one function one pod 85.8 158.1 248.2
Loss of one topside panel 0.8 15.8 47.4
Loss of one function topside panel 0.8 15.8 47.4
Topside minor failures 5.6 31.6 75.0
Other 0.8 15.8 47.4 Unknown 5.6 31.6 75.0 Hydraulic control system Total 314.6 442.6 588.6
Failure rate per 106 hours BOP item Failure mode
Lower limit
Estimate Upper limit
Failed to operate BOP 5.6 31.6 75.0
Spurious operation one BOP function 0.8 15.8 47.4 One subsea transponder failed to
function
0.8 15.8 47.4
Portable unit failed 0.8 15.8 47.4
Function failure LMRP function 0.8 15.8 47.4
Transducer arm failed 0.8 15.8 47.4
Acoustic control system
Total 51.9 110.6 187.2
Total subsea BOP system 955.4 1169.7 1402.5
Table IV.3 Detection of subsea BOP failures
Activity when failure detected BOP Item Total BOP on rig Run-ning BOP Installation test Regular tests/ drilling Flexible joints 0 - - - - Annular preventers 8 0 0 1 7 Ram preventers 4 1 0 3 0 Hydraulic connectors 6 3 0 1 2 Failsafe valves 2 1 0 1 0
Choke and kill lines 19 1 5 1 12
Hydraulic. Control system 28 4 3 9 12
Acoustic control system 7 0 1 5 1
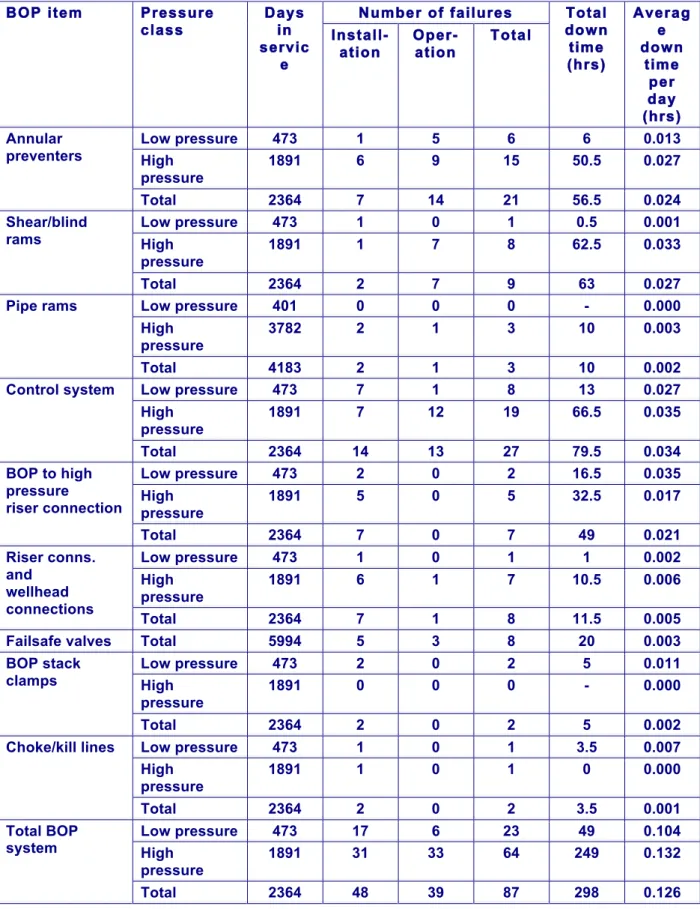
Table IV.4 Overview of surface BOP item specific number of failures and
down times
Number of failures
BOP item Pressure
class Days in servic e Install-ation Oper-ation Total Total down time (hrs) Averag e down time per day (hrs) Low pressure 473 1 5 6 6 0.013 High pressure 1891 6 9 15 50.5 0.027 Annular preventers Total 2364 7 14 21 56.5 0.024 Low pressure 473 1 0 1 0.5 0.001 High pressure 1891 1 7 8 62.5 0.033 Shear/blind rams Total 2364 2 7 9 63 0.027 Low pressure 401 0 0 0 - 0.000 High pressure 3782 2 1 3 10 0.003 Pipe rams Total 4183 2 1 3 10 0.002 Low pressure 473 7 1 8 13 0.027 High pressure 1891 7 12 19 66.5 0.035 Control system Total 2364 14 13 27 79.5 0.034 Low pressure 473 2 0 2 16.5 0.035 High pressure 1891 5 0 5 32.5 0.017 BOP to high pressure riser connection Total 2364 7 0 7 49 0.021 Low pressure 473 1 0 1 1 0.002 High pressure 1891 6 1 7 10.5 0.006 Riser conns. and wellhead connections Total 2364 7 1 8 11.5 0.005
Failsafe valves Total 5994 5 3 8 20 0.003
Low pressure 473 2 0 2 5 0.011 High pressure 1891 0 0 0 - 0.000 BOP stack clamps Total 2364 2 0 2 5 0.002 Low pressure 473 1 0 1 3.5 0.007 High pressure 1891 1 0 1 0 0.000 Choke/kill lines Total 2364 2 0 2 3.5 0.001 Low pressure 473 17 6 23 49 0.104 High pressure 1891 31 33 64 249 0.132 Total BOP system
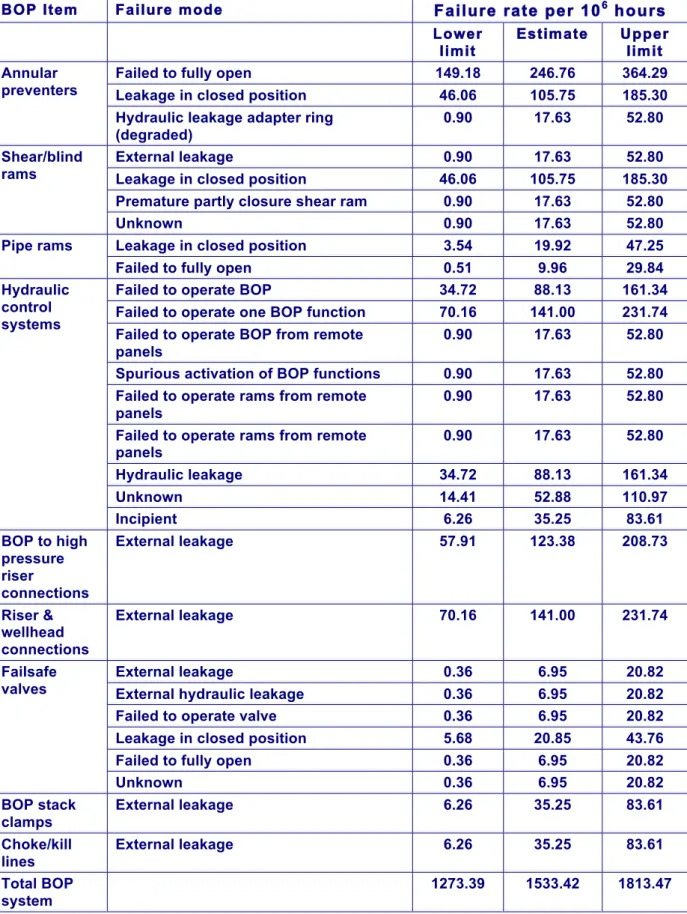
Table IV.5 Surface BOP item specific failure modes and frequencies with
90% confidence limits (all failures included)
BOP Item Failure mode
Failure rate per 10
6hours
Lower limit
Estimate Upper limit
Failed to fully open 149.18 246.76 364.29
Leakage in closed position 46.06 105.75 185.30
Annular preventers
Hydraulic leakage adapter ring (degraded)
0.90 17.63 52.80
External leakage 0.90 17.63 52.80
Leakage in closed position 46.06 105.75 185.30
Premature partly closure shear ram 0.90 17.63 52.80 Shear/blind
rams
Unknown 0.90 17.63 52.80
Leakage in closed position 3.54 19.92 47.25
Pipe rams
Failed to fully open 0.51 9.96 29.84
Failed to operate BOP 34.72 88.13 161.34
Failed to operate one BOP function 70.16 141.00 231.74 Failed to operate BOP from remote
panels
0.90 17.63 52.80
Spurious activation of BOP functions 0.90 17.63 52.80 Failed to operate rams from remote
panels
0.90 17.63 52.80
Failed to operate rams from remote panels 0.90 17.63 52.80 Hydraulic leakage 34.72 88.13 161.34 Unknown 14.41 52.88 110.97 Hydraulic control systems Incipient 6.26 35.25 83.61 BOP to high pressure riser connections External leakage 57.91 123.38 208.73 Riser & wellhead connections External leakage 70.16 141.00 231.74 External leakage 0.36 6.95 20.82
External hydraulic leakage 0.36 6.95 20.82
Failed to operate valve 0.36 6.95 20.82
Leakage in closed position 5.68 20.85 43.76
Failed to fully open 0.36 6.95 20.82
Failsafe valves Unknown 0.36 6.95 20.82 BOP stack clamps External leakage 6.26 35.25 83.61 Choke/kill lines External leakage 6.26 35.25 83.61 Total BOP system 1273.39 1533.42 1813.47
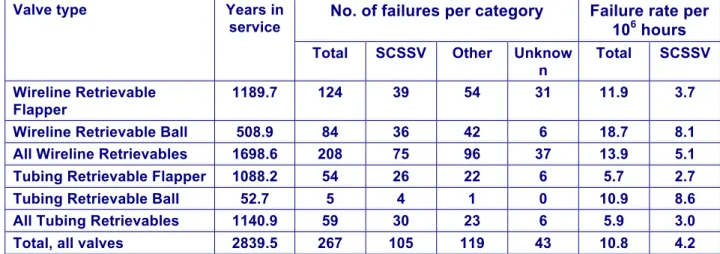
Table IV.6 Overall failure categories for SCSSVs (production and
injection wells)
No. of failures per category
Failure rate per
10
6hours
Valve type Years in
service
Total SCSSV Other Unknow n
Total SCSSV Wireline Retrievable
Flapper
1189.7 124 39 54 31 11.9 3.7
Wireline Retrievable Ball 508.9 84 36 42 6 18.7 8.1
All Wireline Retrievables 1698.6 208 75 96 37 13.9 5.1
Tubing Retrievable Flapper 1088.2 54 26 22 6 5.7 2.7
Tubing Retrievable Ball 52.7 5 4 1 0 10.9 8.6
All Tubing Retrievables 1140.9 59 30 23 6 5.9 3.0
Total, all valves 2839.5 267 105 119 43 10.8 4.2
Note: When SCSSV is stated, the valve itself failed mechanically. “Other” may typically be control line failure or scale in the well.