Residential New Construction (RNC)
Programs.
Impact Evaluation – Volume I.
California Investor-Owned Utilities’ Residential New
Construction Program Evaluation for Program Years
2006-2008
Study ID: CPU0030.01
Final Evaluation Report - Prepared by:
KEMA, Inc.
The Cadmus Group, Inc.
Itron, Inc.
Nexus Market Research, Inc.
Prepared for:
California Public Utilities Commission – Energy Division
February 8, 2010
Submitted to: Ayat Osman, PhD 505 Van Ness Avenue
California Public Utilities Commission Energy Division
San Francisco, CA 94102
Submitted by:
John Stoops, Principal KEMA, Inc.
155 Grand Avenue, Suite 500 Oakland, CA 94612
Abstract
This report contains the final impact evaluation results of the California investor-owned utilities’ (IOUs) 2006-08 residential new construction (RNC) programs. The report also incorporates a few smaller residential and non-residential programs that provided low energy savings during that period. The RNC programs that received a full impact evaluation included SCG’s Advanced Home Program (SCG 3502), SDG&E’s Advanced Home Program (SDG&E 3007), SCE’s California New Homes Program (SCE 2505), and PG&E’s RNC Program (PG&E 2009), with the focus of the evaluation on single-family whole-house measures, which accounted for the vast majority of RNC savings. Three programs that received verification-guided evaluations were PG&E’s California Multifamily Homes New Construction Program (PG&E 2059), and SCG’s and SCE’s Designed for Comfort Programs (SCG 3537 and SCE 2543).
With the exception of SDG&E, which claimed no savings for the whole house approach, all of the IOUs exceeded their claims for electric and demand savings for whole house single family RNC, but fell short of their claimed gas savings. The overall statewide realization rates for net savings were 1.78 for kWh, 1.92 for kW, and 0.36 for gas savings. The high realization rates for the electric and demand savings and low realization rates for gas savings largely stemmed from the fact that the compliance model that was used to generate the ex-ante savings estimates (MICROPAS) underestimates cooling energy use, but overestimate heating energy use. This finding was based on a comparison of metered (field measurement data) and modeled data (using MICROPAS). Ex-post electricity NTG ratios for the RNC programs varied widely across IOUs and climate regions. The NTG varied from 0.45 to 1.06 for the Inland region (where values greater than 1 imply that the typical baseline home is below code). The NTG for the coastal and high desert regions were below one, implying that baseline homes in those areas were built above code.
Document access information and public comment and meeting period information: Website: http://www.energydataweb.com/cpuc/
New Construction and Codes and Standards Programs:
• December 02, 2009: Draft evaluation report posted for public comments
• December 9, 2009: Public meeting and webinar to address questions and comments on the Residential New Construction report
• December 22, 2009: Public comment period closed
Table ES-1: Key Evaluator Contact Information, by Firm
Name Address Email Phone
KEMA John Stoops 155 Grand Avenue, Suite 500
Oakland, CA 94612 [email protected]
510-891-0446
The Cadmus Group Allen Lee
720 SW Washington, Suite 400 Portland, OR 97205 [email protected] 503-467-7127 Itron Rachel Harcharik 11236 El Camino RealSan Diego, CA 92130 [email protected] (858) 724-2620 Nexus Market Research, Inc. Lynn Hoefgen 22 Haskell Street Cambridge, MA 02140 [email protected] 617-497-7544
Name Address Email Phone
CPUC: Energy Division
Ayat Osman, PhD CPUC
Energy Division 505 Van Ness Avenue
San Francisco, CA 94102 [email protected] MECT: Ken
Keating Ken Keating, PhD
6902 SW 14th Ave
Portland, OR 97219
Table of Contents
1. Executive Summary ...1-1 1.1 RNC Whole House Single Family Evaluation...1-3
1.1.1 RNC Program Projected and Claimed Expenditures, Energy and Demand Savings...1-4 1.1.2 RNC Single Family Evaluation Results...1-5 1.1.3 RNC Single Family Key Findings and Recommendations...1-9 1.2 Verification Guided Program Evaluations...1-11 1.3 Tracking-Only Program Evaluations...1-13 2. Introduction ...2-1 2.1 EM&V Activities Grouping ...2-1 2.1.1 Residential New Construction Impact Evaluation Overview ...2-2 2.1.2 Verification-Guided Program Evaluation Overview...2-3 2.1.3 Tracking-Only Programs Overview...2-5 2.2 Description of Programs Included in this Evaluation ...2-5 2.2.1 Residential New Construction Program Descriptions ...2-5 2.2.2 Verification-Guided Evaluation Program Descriptions...2-9 2.2.3 Tracking Only Evaluation Program Descriptions ...2-10 3. Residential New Construction Single-Family Programs: Full Impact Evaluation ...3-1 3.1 RNC Single Family Evaluation Methodology...3-1 3.1.1 Single-Family Whole-House Evaluation Methodology...3-2 3.1.2 Ex Ante Energy and Demand Savings Methodology...3-12 3.1.3 Gross Energy and Demand Savings Methodology...3-13 3.1.4 Evaluation Plan Modifications...3-14 3.2 Confidence and Precision of Key Findings...3-17 3.3 Validity and Reliability...3-17 3.4 RNC Single-Family Whole House Detailed Results ...3-18 3.4.1 RNC Single-Family Program Participation...3-19 3.4.2 RNC Single-Family Ex Ante Gross and Net Savings Results...3-20 3.4.3 RNC Single-Family Ex-Post Gross Energy Savings...3-24 3.4.4 RNC Single-Family Ex-Post Net Energy Savings...3-35 3.4.5 RNC Single-Family Ex-Post Net Peak Demand (kW) Reduction ...3-42 3.5 RNC Single-Family Discussion of Findings and Recommendations ...3-43
Table of Contents
3.5.2 RNC Single-Family Ex-Post Net Energy Savings...3-45 4. PG&E California Multifamily New Homes Program: Verification-Guided Evaluation ...4-1 4.1 Evaluation Objectives ...4-1 4.2 Methods Used ...4-2 4.2.1 Initial Evaluation Plan ...4-2 4.2.2 Modifications to Initial Evaluation Plan ...4-2 4.2.3 Final Evaluation Tasks...4-3 4.2.4 Final Evaluation Plan ...4-3 4.3 Confidence and Precision of Key Findings...4-4 4.4 Validity and Reliability...4-4 4.5 Detailed Results ...4-5 4.5.1 Net-to-Gross Interview Results...4-5 4.5.2 Overall Net-to-Gross...4-18 4.6 Program Results...4-20 4.6.1 Claimed Savings...4-20 4.6.1.1 DEER Measure Analysis ...4-21 4.6.2 Adjusted Gross Savings ...4-23 4.6.3 Net Savings ...4-24 4.7 Discussion of Findings and Recommendations...4-24 5. SCE and SCG Designed for Comfort Programs: Verification-Guided Evaluation...5-18 5.1 Evaluation Objectives ...5-18 5.2 Methods Used ...5-19 5.2.1 Initial Evaluation Plan ...5-19 5.2.2 Changes to Initial Evaluation Plan ...5-20 5.2.3 Final Evaluation Plan ...5-21 5.3 Confidence and Precision of Key Findings...5-22 5.4 Validity and Reliability...5-22 5.5 Detailed Results ...5-23 5.5.1 HVAC Systems ...5-23 5.5.2 Water Heating Systems ...5-24 5.5.3 Windows ...5-24 5.5.4 Attic Insulation ...5-25
Table of Contents
5.7 Discussion of Findings and Recommendations...5-27 6. SCE and SDG&E Sustainable Communities Programs, SCE Demand Response Emerging
Technologies Program, SCE AERS Program, SCE Transforming the Market for ENERGY STAR Manufactured Homes Program: Tracking-Only Program Evaluations ...6-18 6.1 Evaluation Objectives ...6-18 6.2 Methodology and Specific Methods Used ...6-18 6.2.1 Initial Evaluation Plan ...6-18 6.2.2 Changes to Initial Evaluation Plan ...6-18 6.2.3 Final Evaluation Plan ...6-19 6.3 Detailed Findings...6-19
6.3.1 SCE 2534 Demand Response Emerging Technologies Program Detailed Findings ...6-19 6.3.2 SDGE 3021 Sustainable Communities Program Detailed Findings ...6-19 6.3.3 SCE 2514 Sustainable Communities Program Detailed Findings ...6-20 6.3.4 SCE 2558 Automatic Energy Review for Schools Detailed Findings ...6-20 6.3.5 SCE 2557 Transforming the Market for New Energy Star Manufactured Homes Detailed Findings ...6-20 6.4 Program Specific Results ...6-21
6.4.1 SCE 2534 Demand Response Emerging Technologies Program Specific Results...6-21 6.4.2 SDGE 3021 Sustainable Communities—Program-Specific Results...6-21 6.4.3 SCE 2514 Sustainable Communities—Program-Specific Results ...6-22 6.4.4 SCE 2557 Transforming the Market for New Energy Star Manufactured Homes—Program-Specific Results ...6-22 6.5 Discussion of Findings...6-23
List of Tables:
Table 1-1: Program Evaluations Included in Volume (I) ...1-1 Table 1-2: RNC Total Program Projected and Claimed Expenditures, Energy and Demand
Saving...1-5 Table 1-3: RNC Single-Family Whole House Ex-Ante and Ex-Post Gross Savings ...1-7
Table of Contents
Table 1-4: RNC Single-Family Whole House Ex-Ante and Ex-Post Net Electric and Demand Savings and Realization Rates...1-9 Table 1-5: PG&E California Multifamily New Home Original and Claimed Budget and
Savings ...1-11 Table 1-6: PG&E California Multifamily New Home Program Adjusted Gross Savings...1-11 Table 1-7: PG&E Multifamily New Home Program Net Savings...1-12 Table 1-8: Designed For Comfort Program Savings through December 2008 ...1-12 Table 1-9: Tracking-Only Program Target and Claimed/Adopted Savings through December
2008...1-14 Table 2-1: RNC Program Descriptions Full Impact Evaluation Group ...2-7 Table 2-2: RNC Program Descriptions: Verification-Guided Evaluation Group ...2-9 Table 2-3: RNC Program Descriptions: Tracking Only Evaluation Group...2-10 Table 3-1: Mapping of CEC Climate Zones to Climate Regions for Analysis ...3-3 Table 3-2: Original RNC Program Participant Sample Sizes...3-6 Table 3-3: Final RNC Non-Participant and Participant Sample Sizes...3-7 Table 3-4: RNC Baseline Study Completed Sample Sites: On-Site Surveys (Non-Metered)
and Site End-Use Measurement (Metered) ...3-8 Table 3-5: Comparison of Original Evaluation Plan to the Final Implemented Plan ...3-17 Table 3-6: Summary of RNC Single Family Program Participation ...3-20 Table 3-7: PG&E Ex-Ante Savings Claimed through Fourth Quarter of 2008 (March, 2009
Tracking DB)...3-21 Table 3-8: SCE Ex-Ante Savings Claimed through Fourth Quarter of 2008 (March, 2009
Tracking DB)...3-22 Table 3-9: SCG Ex-Ante Savings Claimed through Fourth Quarter of 2008 (March, 2009
Tracking DB)...3-22 Table 3-10: PG&E Per-Unit Ex-Ante Savings Claimed through Fourth Quarter of 2008 (March,
2009 Tracking DB)...3-23 Table 3-11: SCE Per-Unit Ex-Ante Savings Claimed through Fourth Quarter of 2008 (March,
2009 Tracking DB)...3-23 Table 3-12: SCG Per-Unit Ex-Ante Savings Claimed through Fourth Quarter of 2008 (March,
2009 Tracking DB)...3-24 Table 3-13: Single Family CHEERS/CalCERTS Savings and Orientation Adjusted Savings..3-25
Table of Contents
Table 3-15: RNC Single-Family Cooling Meter-adjusted Per-Unit Savings (kWh/unit)...3-33 Table 3-16: Single-Family Heating Meter-adjusted Per-Unit Savings (Therms/unit) ...3-33 Table 3-17: Single-Family Water Heating Meter-adjusted Per-Unit Savings (Therms/unit)...3-34 Table 3-18: Single-Family Meter-adjusted Gross Per-Unit Electricity Savings (kWh)...3-35 Table 3-19: Single-Family Meter-adjusted Gross Per-Unit Gas Savings (therms)...3-35 Table 3-20: Per-Unit kWh Impacts and Net to Gross Ratios by Climate Region ...3-36 Table 3-21: Therm Impacts Net to Gross Ratios By Climate Region...3-37 Table 3-22: Single-Family Annual Electricity Savings & Realization Rates – Inland ...3-38 Table 3-23: Single-Family Annual Electricity Savings & Realization Rates – Coastal ...3-38 Table 3-24: Single-Family Annual Electricity Savings & Realization Rates – Desert...3-39 Table 3-25: Single-Family Annual Gas Net Savings & Realization Rates—Inland ...3-39 Table 3-26: Single-Family Annual Gas Net Savings & Realization Rates—Coastal...3-40 Table 3-27: Single-Family H-Factors ...3-43 Table 3-28: RNC Single-Family Whole House IOUs’ Ex-ante Claimed Savings per Housing Unit ...3-46 Table 3-29: RNC Single-Family Whole House Ex-Post Savings per Housing Unit...3-46 Table 3-30: RNC Single Family Whole House Total Electricity and Gas Savings Realization
Rates ...3-47 Table 4-1: Performance Track Free-ridership Allocation ...4-9 Table 4-2: Performance Net-to-Gross Estimate for Partial Free Riders ...4-10 Table 4-3: Performance Track Net to Gross Values for Each Project ...4-11 Table 4-4: Initial Appliance Free-ridership Allocation...4-12 Table 4-5: Initial Appliance Free-ridership Allocation...4-14 Table 4-6: Appliance Net-to-Gross Estimate for Partial Free Riders ...4-15 Table 4-7: Appliance Track Net-to-Gross Values for Each Project (Appliance Track
projects) ...4-16 Table 4-8: Appliance Savings and Net-to-Gross Estimate...4-18 Table 4-9: Overall Net Program Savings ...4-18 Table 4-10: PGE 2059 Claimed Savings through December 2008 ...4-21 Table 4-11: Annual Savings Values from CMFNH Program and DEER Database...4-23 Table 4-12: Adjusted Gross Savings ...4-24 Table 4-13: Net Savings ...4-24
Table of Contents
Table 6-1: Demand Response Emerging Technologies Program Savings through December 2008...6-21 Table 6-2: SDG&E Sustainable Communities Program Savings through December 2008 ...6-22 Table 6-3: SCE Sustainable Communities Program Savings through December 2008 ...6-22 Table 6-4: SCE 2558 Program Expenditures and Claimed Savings through December
2008...6-22
List of Figures:
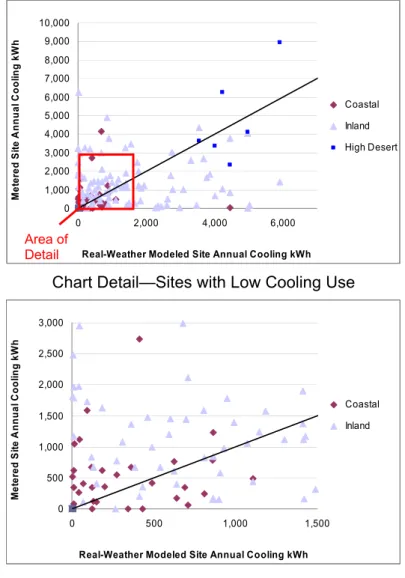
Figure 3-1: Single Family Whole House Analysis ...3-9 Figure 3-2: Estimate of “Gross” and Net Savings ...3-11 Figure 3-3: Residential New Home Starts...3-15 Figure 3-4: Single-family Metered Annual kWh Cooling Compared to Modeled kWh
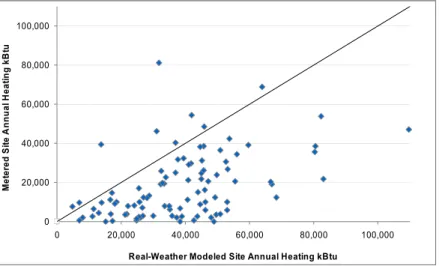
Cooling...3-27 Figure 3-5: Single-family Metered Annual kBtu Heating Compared to Modeled kBtu
Heating ...3-28 Figure 3-6: Single-family Metered Annual kBtu Water Heating Compared to Modeled
kBtu Water Heating...3-28 Figure 3-7: Single Family Metered vs. Modeled Energy Usage Shares, Coastal ...3-31 Figure 3-8: Single Family Metered vs. Modeled Energy Usage Shares, Inland ...3-32 Figure 3-9: Single-Family Per-unit Estimated Electricity Savings ...3-40 Figure 3-10: Single-Family Per-unit Estimated Natural Gas Savings ...3-41 Figure 4-1: Flow Diagram of Performance Track Net-to-Gross Criteria...4-7 Figure 4-2: Flow Diagram of Appliance Track Net-to-Gross Criteria...4-13
Table of Contents
The following appendices are included in a separate document: “RNC Program Impact Evaluation. Appendices to Volume I”:
Appendix A. Calculation of Adjusted Tracking Savings Estimates Appendix B. Residential New Construction Onsite Data Collection Appendix C. End Use Meter Data Analysis
Appendix D. Net Savings: Difference-of-Differences Calculation Methodology and Comparison Groupings
Appendix E. The RNC Interface Appendix F. Baseline Study Results Appendix G. Verification-Guided Programs
Appendix H. California Multifamily New Homes Net-to-Gross Interview Guide Appendix I. Designed for Comfort Onsite Inspection Forms
Appendix J. California Multifamily New Homes Detail Tables
Appendix K. Baseline Study and RNC Evaluation Recruitment Details Appendix L. Comments on the Draft Report with Responses
Acronyms
A/C (AC) Air Conditioning
ACCA Air Conditioning Contractors of America
ACM Alternative Calculation Method
ACP Air Care Plus
ADM ADM Associates
AEAP Annual Earning Assessment Proceeding
AEC Architectural Energy Cooperation
AERS Automated Energy Review for Schools
AHP Analytic Hierarchy Process
ARI Air Conditioning and Refrigeration Institute
ASHRAE American Society of Heating, Refrigerating and Air-Conditioning Engineers
BEA Building Efficiency Analysis
Bldg Building C&I Commercial C&S Codes & Standards
CASE Codes and Standards Enhancement Initiative CATI Computer Assisted Telephone Interviewing CBEE California Board of Energy Efficiency
CBPCA California Building Performance Contractor’s Association
CEC California Energy Commission
CFL Compact Fluorescent Lamp
CG Contract Group
CHEERS California Home Energy Efficiency Rating Services CIEE California Institute for Energy Efficiency
CMFNH California Multifamily New Homes Program
CMMHP Comprehensive Manufactured-Mobile Home Program
CPUC California Public Utilities Commission CRCA Computerized Refrigerant Charge & Airflow
CTZ Climate Thermal Zone
CV Coefficient of Variation
CZ Climate Zone
DEER Database for Energy Efficiency Resources
DfC Designed for Comfort
DHW Domestic Hot Water
DRET Demand Response Emerging Technologies
DSA Division of the State Architect
ECM Energy Conservation Measure
ED Energy Division
EE Energy Efficiency
EEGA Energy Efficiency Groupware Application
Acronyms
FLA Full Load Amps
GWh Gigawatt-hour
HERS Home Energy Rating System
HIM High Impact Measure
HMG Heschong-Mahone Group
HUD Housing & Urban Development
HVAC Heating, Ventilation & Air Conditioning
ICF ICF International
IDEEA Innovative Designs for Energy Efficiency Applications InDEE Innovative Design for Energy Efficiency
IOU Investor Owned Utility
IPMVP International Performance Measurement and Verification Protocol
ITD Installed To Date
kBtu Thousand Btu
kW Kilowatt
kWh Kilowatt Hour
LADWP Los Angeles Department of Water & Power LEED Leadership in Energy and Environmental Design
LPD Lighting Power Density
M&V Measurement & Verification
MECT Master Evaluation Contractor Team
MF Multifamily
MHRA Manufactured Housing Research Alliance Mil Million
MS Microsoft
n Sample Size
NAC Normalized Annual Consumption
NC New Construction
NCCS New Construction/Codes & Standards NOMAD Naturally Occurring Market Adoption NOSAD Normally Occurring Standards Adoption
NP Non Participant
NRNC Non Residential New Construction
NTG Net to Gross
NTGR Net to Gross Ratio
NTP Notice to Proceed
P Participant PG&E Pacific Gas & Electric
PIER Public Interest Energy Research
PTAC Packaged Terminal Air Conditioner
Acronyms
Q3 Third Quarter
Q4 Fourth Quarter
QA Quality Assurance
QC Quality Control
QII Quality Insulation Installation
RCA Refrigerant Charge and Airflow
Res Residential
RFP Request for Proposal
RH Relative Humidity
RLA Rated Load Amps
RMSE Root Mean Square Error
RNC Residential New Construction
ROB Replace on Burnout
RP Relative Precision
SAS Statistical Analysis Software
SBD Savings By Design
SCE Southern California Edison
SCG Southern California Gas
SCP Sustainable Communities Program
SDG&E San Diego Gas & Electric SDGE San Diego Gas & Electric
SEER Seasonal Energy Efficiency Rating
SF Single Family
sf Square Foot
SFA Single Family Attached
SHGC Solar Heat Gain Coefficient
SoCalGas Southern California Gas
SOW Statement of Work
sqft Square Foot
T24 Title 24 Building Energy Efficiency Standards
TBD To Be Determined
TDV Time-Dependent Valuation
TXV Thermostatic Expansion Valve
UES Unit Energy Savings
VFD Variable Frequency Drive
VSD Variable Speed Drive
VSP Verification Service Providers
W/SF Watts per square foot
1. Executive
Summary
This report is volume 1 of the final evaluation results of the California Investor Owned Utilities’ (IOUs’) new construction portfolio covering the residential, multifamily and non-residential programs as well as the Codes and Standards programs for the 2006-2008 program years, collectively referred to as the New Construction/Codes and Standards evaluation project group. This volume presents evaluation results for the Residential New Construction (RNC) programs and a number of smaller new construction programs that received verification-guided
evaluations or tracking-only evaluations as part of the New Construction/Codes and Standards evaluation project group. The results for non-residential new construction (NRNC) programs’ evaluation and Codes and Standards (C&S) programs’ evaluation are presented in separate volumes (NRNC final evaluation report in Volume II and C&S final evaluation report in Volume III).
Table 1-1 lists the programs included in this volume with the measurement and verification level employed for each evaluation. While most of these evaluations focus on residential new
construction, the tracking-only evaluations include some commercial programs.
Table 1-1: Program Evaluations Included in Volume (I)
Program
ID Program Name Evaluation Type
SCG 3502 Advanced Home Program Full Impact
SDG&E 3007
Advanced Home Program Full Impact
SCE 2505 CA New Homes Program Full Impact
PG&E 2009 Residential New Construction Program Full Impact SCG 3537 Designed for Comfort (DfC) program Verification SCE 2543 Designed for Comfort (DfC) program Verification PG&E 2059 California Multifamily Homes New Construction Program Verification SDG&E
3021
Sustainable Communities Tracking
SCE 2514 Sustainable Communities Tracking
SCE 2534 Demand Response Emerging Technologies Tracking SCE 2558 Automatic Energy Review for Schools (AERS) Tracking SCE 2557 Transforming the Market for ENERGY STAR Manufactured (Mobile)
Homes (IDEEA/InDEE) program
Tracking
The four residential new construction programs—the Advanced Home Program for SCG and SDG&E, the California New Homes Program for SCE, and the Residential New Construction
Program for PG&E—all offered energy efficiency incentives for residential new construction, including both whole house and prescriptive measures. The scope and focus of the Programs vary between the IOUs. PG&E’s program focuses primarily on single-family buildings, with multi-family buildings under a separate program. The remaining programs include both single-multi-family and multifamily components under the same program. This group of four RNC program received full impact program evaluation, designed to obtain unbiased, reliable estimates of program-level net energy and demand savings.
The two programs that received verification-guided evaluation are PG&E California Multi-family New Home program, and SCE and SCG Designed for Comfort programs. PG&E’s California Multifamily New Home Program facilitates energy-efficient design and construction in multifamily housing through design assistance, cash incentives and ENERGY STAR® marketing benefits to both low-rise and high-rise multifamily projects. SCE’s and SCG’s Designed for Comfort
Programs use a comprehensive building analysis approach that fills a gap not served by other programs. They provide incentives for the replacement of inefficient heating, cooling, and water heating equipment, insulation, and windows with models of higher efficiency.
The California Public Utilities Commission (CPUC) developed the category of “Verification-Guided Impact Evaluations” to address relatively small programs with appropriate levels of rigor and expense given their level of savings. Accordingly, the programs evaluated in this manner require only field verification of measure installation and operation in a binary manner—i.e., installed or not and operating or not. Gross energy and demand savings estimates are derived from other sources, with an option to either develop net-to-gross values or use default inputs. The five tracking-only programs expected little or no savings during the evaluation period. SDG&E’s and SCE’s Sustainable Communities Programs are local programs that target residential and nonresidential market segments by working with cities and counties. SCE’s Demand Response Emerging Technologies Program demonstrates the effectiveness of various energy efficiency measures on a community scale. SCE’s Automatic Energy Review for Schools (AERS) identifies potential energy-saving design modification opportunities in public schools and intervenes during a time in the process when changes to building project drawings normally occur. SCE’s Transforming the Market for ENERGY STAR Manufactured (Mobile) Homes provides incentives to encourage increased efficiency in new manufactured homes.
Tracking-only program evaluations expend minimal effort on programs that contribute little to the savings of the overall portfolio. Such evaluations involve a review of program reported savings and budget spent, which are compared to program goals and budgets. Interviews with program staff are conducted to explain any deviations from the planned goals.
1.1
RNC Whole House Single Family Evaluation
The Evaluation Team performed full impact evaluation on the four IOUs’ residential new
construction programs: the Advanced Home Program for SCG and SDG&E, the California New Homes Program for SCE, and the Residential New Construction Program for PG&E.
The primary objectives of the impact evaluation of Residential New Construction were to:
• Verify the installation of program measures;
• Conduct a baseline study of non-participating new single-family homes in California to
– establish current typical practices in new home construction,
– estimate the savings attributable to market effects of utility programs, and
– quantify the savings from utility involvement in promoting codes and standards changes;
• Establish annual performance profiles for a typical residential single-family home in climate regions of interest based on metering of major end uses, measurements, and site surveys; and
• Develop gross and net impact estimates for the whole-house energy and demand savings resulting from the Residential New Construction program cluster.
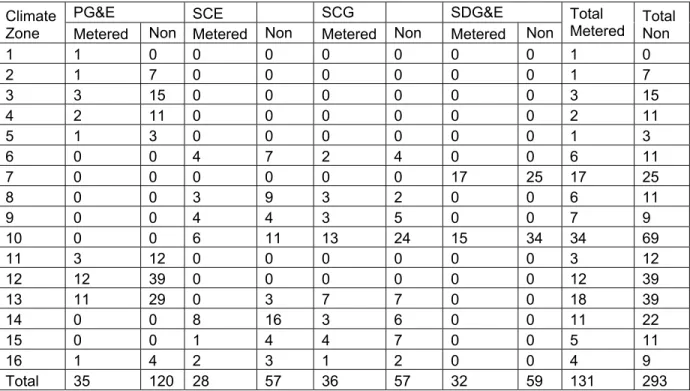
The study collected detailed on-site data and end-use metering at 31 participant and 131 non-participants sites across the state. The sample design is discussed in detail in section 3.1. The results of the data collection were used to characterize the energy use of typical new homes and to compare the metered energy use of homes in the study to the energy use of the same homes as modeled using the Title 24 compliance tool MICROPAS. Utility-claimed gross energy and demand savings were based on modeled energy usage, and any bias in the way the models calculated energy savings would affect the calculation of ex-post energy and demand. Metered energy use for the onsite homes was compared to modeled energy use for the same homes to develop a metered-to-modeled ratio that was used to adjust ex ante gross savings to correct for the bias introduced by the compliance tool. This approach also required making orientation adjustments to the modeled energy use, since the modeled use was typically not based on a home’s actual orientation, but on average or worst-case orientation.
The Evaluation Team calculated net savings using a Difference of Differences approach (described in section 3.4.4). We leveraged the results of the baseline study to characterize the energy use of typical new homes. We compared the non-participant naturally occurring baseline and participant gross savings by climate regions. The difference between the two (expressed as savings-per-square-foot for comparability), is the per-square-foot estimate of net savings for each climate region. These ratios were multiplied by the corresponding square footage of participant homes obtained from the IOUs' tracking database to yield net program savings by utility. We then estimated net-to-gross ratios by dividing net savings for each utility by the ex-post gross savings. The details of the tasks performed to conduct this evaluation are given in section 3.1.
1.1.1
RNC Program Projected and Claimed Expenditures, Energy and
Demand Savings
The following table compared projected and claimed utility RNC program goals and claimed (ex-ante) gross energy and demand savings, and budget spent for each utility. The program
claimed achievement values were obtained from the IOUs March 2009 tracking databases, covering the programs’ claims through the fourth quarter of 2008.
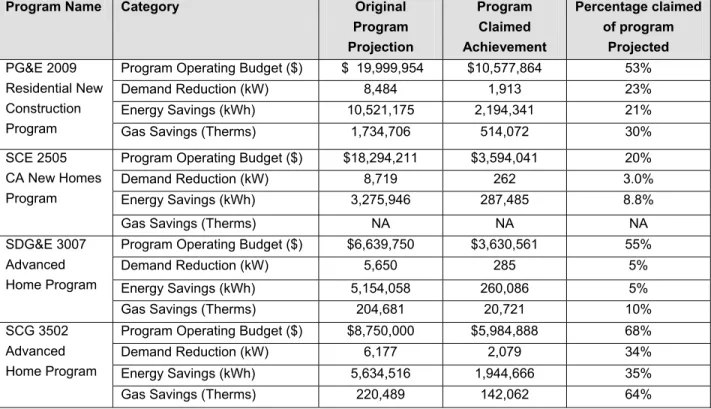
Table 1-2: RNC Total Program Projected and Claimed Expenditures, Energy and Demand Saving1
Program Name Category Original Program Projection Program Claimed Achievement Percentage claimed of program Projected Program Operating Budget ($) $ 19,999,954 $10,577,864 53%
Demand Reduction (kW) 8,484 1,913 23%
Energy Savings (kWh) 10,521,175 2,194,341 21% PG&E 2009
Residential New Construction
Program Gas Savings (Therms) 1,734,706 514,072 30%
Program Operating Budget ($) $18,294,211 $3,594,041 20%
Demand Reduction (kW) 8,719 262 3.0%
Energy Savings (kWh) 3,275,946 287,485 8.8%
SCE 2505 CA New Homes Program
Gas Savings (Therms) NA NA NA
Program Operating Budget ($) $6,639,750 $3,630,561 55%
Demand Reduction (kW) 5,650 285 5%
Energy Savings (kWh) 5,154,058 260,086 5%
SDG&E 3007 Advanced Home Program
Gas Savings (Therms) 204,681 20,721 10%
Program Operating Budget ($) $8,750,000 $5,984,888 68%
Demand Reduction (kW) 6,177 2,079 34%
Energy Savings (kWh) 5,634,516 1,944,666 35%
SCG 3502 Advanced Home Program
Gas Savings (Therms) 220,489 142,062 64%
1.1.2
RNC Single Family Evaluation Results
Gross Energy Savings and Demand Reduction Orientation Adjustments
The orientation of a home can significantly affect its space-cooling and heating energy
requirements, chiefly due to solar gain through windows. The CalCERTS registry only contains modeled energy for each plan’s worst orientation, but clearly not all homes are actually built in the worst possible orientation. On the other hand, the CHEERS registry contains the modeled energy consumption for all four orientations, and the average was used to calculate the gross
1 Please note that the savings presented in this table are for the total RNC program savings. The
evaluation of the RNC programs focused on the Whole House Single Family. The remaining (non-Whole House) measures found in the RNC programs will be treated though the Evaluation Reporting Tool (ERT) process. The final analysis for the overall program savings will be published in the ED report.
energy savings for each home. To adjust for this, the evaluation team used the CHEERS data to estimate “average” orientation energy as a function of worst orientation energy. Orientation adjustments (b-ratios) were estimated for the single-family homes. These b-ratios were used to calculate an orientation-adjusted estimate of gross savings, used in the following analysis. (More details on b-ratios are found in Appendix A).
The overall impact of the orientation adjustment on gross savings from the CHEERS/CalCERTS registries (for which savings estimates could be obtained) increased by total 6.42%. The
percentage change ratios are then applied to the IOUs claimed ex-ante gross savings to adjust for orientation problems with CalCERTS (Refer to Section 3.4.3 for further discussion).
Meter Adjustments
To account for the systematic ways in which actual energy use differs from modeled energy use, the evaluation team first adjusted gross savings from the CHEERS and CalCERTS 2
participant registries for building orientation and then applied the metered-to-modeled ratio to adjust for the actual energy use obtained from field measurements. Due to the differences between the larger, desert-located cooling sites and the rest of the inland homes data and the difference between coastal and inland results seen in the data, we broke out the analysis into three climate regions: coastal (CEC climate zones 1-7), inland (CEC climate zones 8-14 and 16), and high desert (CEC climate zone 15). These distinctions were used throughout the single-family portion of the metered-adjusted ratio analysis for the cooling end use. Heating was broken out by coastal and inland, with inland including climate zone 15. Since water heating was not weather-dependent in the compliance models, its adjustment factor was not separated out by climate region.
A comparison between the metered data collected at the participant and non-participant on-sites and the modeled 3energy usage for those homes showed that the compliance software
overestimates the amount of heating energy consumed at a site and underestimates the amount of cooling energy consumed. Coastal cooling usage was, on average, 40% higher than modeled usage for coastal homes. The inland ratio indicates 6% more usage than modeled, and the
2 CHEERS and CALCerts are databases that contain participant homes building characteristics and
modeled energy use, which were necessary for the analysis.
3 The basis of the utilities claimed gross energy and demand savings was based on the modeled energy
desert homes used 39% more energy than predicted. The heating ratios reflect a significant overestimation of usage. Both coastal and inland metered usages were about 44% of modeled projections. The hot water ratio shows an average metered usage of 93% of modeled usage across all homes. Table 1-3 shows ex-ante and ex-post gross saving with realization rates. The statewide realization rate was 1.43 for kWh savings and 1.54 for demand savings, but only 0.54 for gas savings.
Table 1-3: RNC Single-Family Whole House Ex-Ante and Ex-Post Gross Savings Program Name Category Ex-Ante Gross
Savings Ex-Post Gross Savings Realization Rates Demand Reduction (kW) 2,162 2,582 1.19 Energy Savings (MWh) 2,329 2,784 1.20 PG&E 2009 Residential New Construction
Program Gas Savings (Therms) 561,447 279,878 0.50
Demand Reduction (kW) 231 1101 4.77
Energy Savings (MWh) 150 726 4.83
SCE 2505 CA New Homes
Program Gas Savings (Therms) NA 32,854 NA
Demand Reduction (kW) NA NA NA
Energy Savings (MWh) NA NA NA
SDG&E 3007 Advanced Home
Program Gas Savings (Therms) NA NA NA
Demand Reduction (kW) 27 54 1.95
Energy Savings (MWh) 63 122 1.95
SCG 3502 Advanced Home
Program Gas Savings (Therms) 14,085 700 0.05
Demand Reduction (kW) 2,420 3,737 1.54
Energy Savings (MWh) 2,542 3,631 1.43
Total Statewide
Gas Savings (Therms) 575,532 313,432 0.54
Net Energy Savings and Demand Reduction
The final net impact estimates are presented in Table 1-4. Only programs that provide ex-ante savings estimates for individual end-uses are included, so realization rates are not presented for all utilities. A more detailed explanation of the effects of the lack of ex-ante estimates on
realization rate calculations can be found in section 3.4.4.
The electric energy savings realization rate is greater than one for all utilities, and is much greater than one for both PG&E and SCE. Because the code compliance models tend to
underestimate the amount of cooling energy use, and the ex ante per unit savings are based on the models, the ex-ante per unit savings estimates are low across the board.
KEMA used a peak factor or an “H-factor” approach to estimating coincident kW reduction4 .
KEMA used the same “H-factor” values that are found in the ex ante savings used by the utilities for program planning. These “H-factors” were applied to the ex-post net energy savings values by utility to obtain ex-post net kW savings. The demand reductions results show similar
realization rates to the electric energy savings for PG&E and SDG&E, which is expected due to the calculation method. Unlike PG&E and SDG&G, SCE's H-factors varied across climate zones (see Table 3-27). Because the geographical mix of claimed homes differed from the mix that was assumed in the ex-ante estimates, SCE's demand realization rate was different from the kWh realization rate. Because PG&E and SCG had uniform H-factors, their realization rates are equal. The therms realization rate is below one. This low realization rate is partially due to the overstatement of heating-based usage in the MICROPAS models.
Table 1-4: RNC Single-Family Whole House Ex-Ante and Ex-Post Net Electric and Demand Savings and Realization Rates
Program Name Category Ex-Ante Net Savings Ex-Post Net Savings Net Realization Rates Demand Reduction (kW) 1,730 2,648 1.53 Energy Savings (MWh) 1,863 2,854 1.53 PG&E 2009 Residential New Construction Program
Gas Savings (Therms) 449,158 137,945 0.38
Demand Reduction (kW) 185 1,039 5.63
Energy Savings (MWh) 120 703 5.85
SCE 2505 CA New Homes
Program Gas Savings (Therms) NA 27,988 NA
Demand Reduction (kW) NA NA NA
Energy Savings (kWh) NA NA NA
SDG&E 3007 Advanced Home
Program Gas Savings (Therms) NA NA NA
Demand Reduction (kW) 22 24 1.10
Energy Savings (MWh) 50 55 1.10
SCG 3502 Advanced Home
Program Gas Savings (Therms) 11,268 -205 -0.02
Demand Reduction (kW) 1,936 3,711 1.92
Energy Savings (MWh) 2,033 3,612 1.78
Total Statewide
Gas Savings (Therms) 460,426 165,728 0.36
1.1.3
RNC Single Family Key Findings and Recommendations
Key findings from the RNC evaluation
• With the exception of SDG&E, which claimed no savings for whole buildings, all of the IOUs exceeded their claims for electric and demand savings for whole house single family RNC, but fell short of their claimed gas savings.
• The compliance models used to estimate ex ante savings underestimate cooling energy use, but overestimate heating energy use, based on a comparison of metered and modeled data. This led to ex ante electric and demand savings (kWh and kW) estimates
that were too low compared to the ex-post results, and ex-ante gas savings (therms) estimates that were too high compared to the ex-post gas savings results.
• Ex-post electricity NTG ratios varied widely across IOUs and regions. The NTG varied from 0.45 to 1.06 for the Inland region (where greater than 1, implies that the typical baseline home is below code). The NTG for the coastal and high desert regions were below one, implying that baseline homes in those areas were above code.
Key recommendations from the RNC evaluation
• The estimates of baseline usage that come from the compliance software underestimate cooling energy use and overestimate heating energy use. We therefore recommend that utilities evaluate alternative modeling tools to investigate the capability of the tool to more accurately simulate energy usage for ex ante estimates.
• As evident from the evaluation results, the orientation of a home can significantly affect its space-cooling and heating energy requirements. The registries used to track building code compliance in California, CHEERS and CalCERTS, omit site-specific orientation information, which is a significant problem when using these databases to calculate energy use for specific homes Actual home orientation should be recorded in the participant registries, which should greatly improve the accuracy of program performance estimates.
• Utilities should track participation information in a common database. The discrepancies in formats between the two participant registries (CHEERS and CalCERTS) add a level of uncertainty in estimating savings and tracking program participation. In addition, there is no clear way to match homes in the registries to specific programs and participation periods, which adds an additional layer of uncertainty to the analysis. A single, well-constructed, accurate, and complete registry would save time and effort in the process of the evaluation of these programs.
• Further studies should be conducted on the metering data to learn more about residential usage patterns for builder-affected end-uses, such as HVAC, cooling and water heating.
1.2
Verification Guided Program Evaluations
The two programs that received verification-guided evaluation are PG&E California Multi-family New Home program; and SCE and SCG Designed for Comfort programs.
The key objective of the evaluation of the California Multifamily New Homes Program (CMFNH) was to estimate the program free ridership, and to adjust gross savings using current DEER values. Table 1 5 shows the projected savings and original budget for the program along side claimed savings and budget spent. The program only claimed about 10 percent of the original projected savings.
Table 1-5: PG&E California Multifamily New Home Original and Claimed Budget and Savings
Tracked Measure Original Adopted or Projected Claimed through December 2008 Percent of Original Demand Reduction (kW) 2,698 236 9% Electricity Savings (kWh) 4,489,813 405,333 9%
Gas Savings (therms) 839,084 83,804 10%
Budget $7,459,053 $2,336,091 31%
Savings for clothes washers and refrigerators were adjusted for current DEER 2008 values. Table 1 6 shows claimed and adjusted gross savings.
Table 1-6: PG&E California Multifamily New Home Program Adjusted Gross Savings Demand Reduction (kW) Electric Savings (kWh) Gas Savings (therms)
Claimed Gross Savings 236 405,333 83,804
Adjustments 05 -20,562 -46
Adjusted Gross Savings 236 384,771 83,758
In order to establish a NTG ratio for the post-2005 code multifamily program, the team
conducted interviews with developers, architects, and energy consultants regarding the level of program influence on building designs and appliance selection.
5 Demand reduction was not adjusted, because the DEER database did not consistently provide demand
In order to establish a NTG ratio for the post-2005 code multifamily program, the team
conducted interviews with developers, architects, and energy consultants regarding the level of program influence on building designs and appliance selection.
Table 1-7 presents the adjusted gross savings from Table 1-6, the net-to-gross estimates developed from the interviews with decision-makers, and the estimated net savings for the program. Note that this estimate includes free ridership but not spillover, and therefore is a conservative estimate of attribution of savings to the program.
Table 1-7: PG&E Multifamily New Home Program Net Savings Demand Reduction (kW) Electric Savings (kWh) Gas Savings (therms)
Adjusted Gross Savings 236 384,771 83,758
NTG Estimate 0.58 0.58 0.58
Net Savings 137 223,167 48,580
The goal of the Designed for Comfort Program evaluation was to determine whether program measures were installed (yes/no) and whether they were installed properly. The Designed for Comfort evaluation consisted of on-site evaluations at two multifamily affordable housing complexes. Auditors inspected heating systems, insulation and windows, and generally found them to be properly installed.
We did not adjust the reported net savings for the DfC program because there was no
information available from either the onsite verifications or the DEER database that could serve as the basis for adjustments to the program’s gross savings or its ex-ante NTG value. Table 1-8 shows the total ex-ante energy and demand savings for the program as of the fourth quarter of 2008. The evaluators recommend using these claimed values.
Table 1-8: Designed For Comfort Program Savings through December 2008 Tracked Measure Original Adopted or
Projected Claimed through December 2008 Percent of Original Demand Reduction (kW) 449 436 97.1% Electricity Savings (kWh) 234,138 252,167 107.7%
Gas Savings (therms) 33,935 0 0.0%
1.3 Tracking-Only
Program
Evaluations
A number of programs had small or non-existent savings by the end of 2008. These programs were tracked, but not evaluated. The goal of the evaluation for these programs was simply to follow the programs’ progress in achieving their program goals, and to provide a high-level explanation of the reasons behind the tracking results.
The following five tracking-only programs showed little or no savings during the evaluation period: SDG&E’s and SCE’s Sustainable Communities Programs, SCE’s Demand Response Emerging Technologies Program, SCE’s Automatic Energy Review for Schools (AERS), and SCE’s Transforming the Market for ENERGY STAR Manufactured (Mobile) Homes.
None of the tracking-only programs met their energy savings goals for the 2006-2008 period, falling significantly short of goals. Table 1-9 shows, for each program, the program targets, claimed saving through the end of 2008, and claimed savings as a percent of program targets. The reasons found for the programs falling short of their targets are discussed in the body of the report.
Table 1-9: Tracking-Only Program Target and Claimed/Adopted Savings through December 2008
Tracked Measure Demand Response Emerging Technologies SDG&E’s Sustainable Communities SCE Sustainable Communities AERS Manufactured Homes Demand Reduction (kW) 142 5,650 4,221 242 1,897 Electricity Savings (kWh) 75,752 5,154,058 1,642,400 1,167,466 1,153,691
Gas Savings (therms) 0 204,681 0 0 0
Claimed Savings through Q4 2008
Demand Reduction (kW) 1 161 0 0 167
Electricity Savings (kWh) 593 806,433 0 0 130,792
Gas Savings (therms) n/a 12,042 n/a n/a n/a
Percent of Original
Demand Reduction (kW) <1% 3% 0% 0% 8.8%
Electricity Savings (kWh) <1% 16% 0% 0% 11.3%
2. Introduction
This document presents the evaluation results of the Residential New Construction (RNC) component of the New Construction/Codes and Standards project evaluation group. This evaluation group comprises the California investor owned utilities’ (IOUs) extensive new
construction portfolio covering the residential, multifamily and non-residential markets. The IOUs include Pacific Gas and Electric (PG&E), San Diego Gas and Electric (SDG&E), Southern California Electric (SCE), and Southern California Gas (SCG).
The New Construction, Codes and Standards Evaluation group consists of twenty-one6 utility
energy efficiency programs focused on new construction or those supporting the California State Codes and Standards activities. Each of the four IOUs operates similar residential new construction programs and each supports a coordinated Codes and Standards effort. For non-residential new construction, SCE, SDG&E, and SCG operate similar Savings by Design
programs. PG&E organizes their programs by market segments, but for the non-residential new construction evaluation, PG&E have created a “virtual” Savings by Design program for the commercial sector as a whole. Finally, a sub-group of several smaller programs are aimed at testing new applications or improving efficiency among a relatively small target population. The Residential New Construction cluster of program evaluations covers a portfolio of products and services designed to increase the adoption of energy efficient equipment and practices in the single-family and multifamily building industry. The program provides support to encourage high-performance building design that exceeds the 2005 California Energy Efficiency Standards in overall performance design by 15% or more, while also aiming to increase the adoption and installation of individual high efficiency measures, such as efficient heating, cooling, lighting, and appliances in residential new construction.
2.1
EM&V Activities Grouping
The evaluation team structured the evaluation activities by grouping the IOUs programs into five evaluation clusters:
6 Including one “virtual” PG&E program that consists of commercial new construction projects found within
1) Residential New Construction (RNC) Evaluation (full impact evaluation), includes PG&E RNC program, SCE California New Homes program, SDG&E and SCG Advanced Home program, and PG&E Duct and Cover program;
2) Non-Residential New Construction (NRNC) Evaluation (full impact evaluation), includes the four IOUs’ Savings by Design programs (SBD);
3) Codes and Standards (C&S) Evaluation (full impact evaluation), includes the four IOU’s C&S programs;
4) Verification-Guided Program Evaluation, includes PG&E California Multifamily New Homes program, and SCG and SDG&E Designed for Comfort programs; and
5) Tracking-Only Program Evaluation includes SCE Demand Response Emerging Technologies program, SCE and SDG&G Sustainable Communities program, SCE Automatic Energy Review for Schools program, and SCE Transforming the Market for New Energy Start Manufactured Homes program.
This document presents the impact evaluation results for the statewide Residential New Construction (RNC) programs 7, verification-guided program evaluation, and tracking-only program evaluation for program years 2006-2008. Results for the other segments of the evaluated Group can be found in the following volumes: NRNC-Volume II and the C&S in Volume III.
2.1.1 Residential
New
Construction
Impact Evaluation Overview
Each IOU has a new construction program to incentivize the construction of homes that are more energy efficient. These include PG&E’s RNC Program, SCE’s California New Homes Program, and SDG&E’s and SCG’s Advanced Home Program, and PG&E’s Duct and Cover
7 The residential new construction evaluation group also includes an evaluation of the market effects of
the IOUs’ residential single-family new construction programs, but that portion of the study is reported separately from the impact evaluations (see KEMA, Nexus Market Research, Inc., Summit Blue Consulting, Itron, Inc., The Cadmus Group, Inc. 2009. Phase I Report: Residential New Construction (Single Family Home) Market Effects Study).
program. The evaluation team planned to evaluate these programs using energy simulation models of a sample of participating homes 8, informed by site surveys and end-use metering.
However, the ongoing collapse of the new housing market resulted in samples that were too small for the originally planned evaluations and so a simplified method was necessary. This contract group also conducted a study of non-participating new homes in California, referred to in this report as the “baseline study,” to establish current typical practices in new home
construction and to inform the net savings calculations9.
The primary objectives of the full impact evaluation of Residential New Construction were to:
• To verify the installation of program measures;
• To conduct a baseline study of non-participating new single-family homes in California to establish current typical practices in new home construction, estimate the savings
attributable to market effects of utility programs, and to help quantify the savings from utility involvement in promoting codes and standards changes;
• Establish annual performance profiles for a typical residential single-family home in climate regions of interest based on metering of major end uses, measurements, and site surveys; and
• To develop gross and net impact estimates for the whole building energy and demand savings resulting from the Residential New Construction program cluster.
2.1.2 Verification-Guided
Program Evaluation Overview
The California Public Utilities Commission developed the category of “Verification-Guided Impact Evaluations” to address relatively small programs with appropriate levels of rigor and expense given their level of savings, thus preserving evaluation resources for programs accounting for more savings. Accordingly, the programs evaluated in this manner require only field verification of measure installation and operation in a binary manner—i.e., installed or not
8 Participants in the RNC program are actually the builders who built homes to the program specifications.
Other homes were built during the same period without participation in the program. For simplicity sake, we may often refer to the buildings and their occupants as participants and non-participants, rather than using expressions like the “occupants of homes built by participating builders.”
and operating or not—with gross savings estimates derived from other sources, and with an option for either developing Net To Gross values or using default inputs.
The NCCS evaluation team performed verification-guided evaluations, as opposed to protocol-guided impact evaluations, on several smaller programs with relatively small energy and demand savings. One program in this group is PG&E’s California New Homes Multifamily program, which facilitates and encourages energy-efficient design in multifamily housing
through design assistance, cash incentives and marketing. This group also includes SCE’s and SCG’s Designed for Comfort (DfC) programs, which targets older affordable housing otherwise undergoing rehabilitation, and provides design assistance, training, and incentives to improve building energy efficiency.
The initial objectives of the evaluation of the CMFNH Program, as laid out in the work plan, in keeping with the guidelines for Verification-Guided Impact Evaluations, were to determine whether or not program measures have been installed and whether or not they have been installed properly, and to make use of available information to estimate energy impacts. However, the CPUC decided that the low savings from this program did not warrant the resources required for such an approach. Instead, the key objective of the evaluation became an estimation of program free ridership, and appropriate measures were adjusted for current DEER values.
The initial objectives of the evaluation of the DfC Program, as laid out in the work plan, in keeping with the guidelines for Verification-Guided Impact Evaluations, were to determine whether or not program measures have been installed and whether or not they have been installed properly, and to make use of available information to estimate energy impacts. However, the CPUC decided that the low savings from this program did not warrant the resources required for such an approach. Hence, while the physical inspections were conducted, the objective of re-estimating energy impacts was not addressed.
Two additional programs were assigned to this group in the original evaluation plan; SCE’s Transforming the Market for ENERGY STAR Manufactured (Mobile) Homes (IDEEA/InDEE) program and PG&E’s Duct & Cover Program (PGE 2083). When the Manufactured Home program recorded almost no program accomplishments, the CPUC Energy Division (ED) decided not to spend further resources evaluating this program. The Manufactured Home program evaluation was therefore grouped with the other tracking-only programs for the remainder of this document. PG&E discontinued the Duct & Cover Program, so the program was dropped from the evaluation as well.
2.1.3 Tracking-Only
Programs Overview
Three evaluations were planned to be restricted to tracking and reporting only, without
independent evaluation of energy savings. Savings were expected to be very small or possibly nonexistent by the end of 2008, not justifying even verification-guided evaluations. The goal of the evaluation of these programs was simply to follow the progress of the programs in achieving their program goals, if any, and to provide a high-level explanation of the issues behind the tracking results. The first two of these evaluations addressed SCE’s and SDG&E’s Sustainable Communities programs, which worked with developers, architects, engineers, and others to incorporate sustainable design practices into both residential and commercial developments. The third, Automatic Energy Review for Schools (AERS) (formerly known as the Modernization and New Construction Efficiency Enhancement for Schools Program in the IDEEA/InDEE project), sought to identify potential energy-saving design modification opportunities in public schools and intervene during a time in the process when changes to building project drawings normally occur. The fourth evaluation addressed SCE’s Demand Response Emerging
Technologies program, which is a pilot program providing incentives to builders to install emerging energy efficient technologies in newly constructed homes.
A fifth program, SCE’s Transforming the Market for ENERGY STAR Manufactured (Mobile) Homes (IDEEA/InDEE) program, originally planned as a verification-guided evaluation, was added to this group due to its lack of program accomplishments. This program provides incentives to encourage increased efficiency in new manufactured homes.
2.2
Description of Programs Included in this Evaluation
2.2.1
Residential New Construction Program Descriptions
Although PG&E, SCE, SCG, and SDG&E all offered energy efficiency incentives for residential new construction, the scope and focus of the Programs vary between the IOUs. PG&E’s program focuses primarily on single-family buildings because multifamily new construction efforts were organized under a separate program, PG&E 2059, which is implemented by a third party, HMG. We discuss PG&E’s multifamily program with the other verification-guided
evaluations. SCE also has third party implementers (ICF and HMG) for their single-family and multifamily components, but both components are included in SCE 2505. SCG and SDG&E are implementing both the single-family and multifamily portions of their programs themselves. While all of the programs include a whole house goal and incentive, the number and type of
prescriptive measure rebated by each IOU vary. The following illustrates some of the key similarities and differences between the Programs in this evaluation cluster.
The programs evaluated in the RNC evaluation cluster are listed in Table 2 1 with program descriptions10
10 Whole house measures may also be referred to as performance-based measures. For this report, we
Table 2-1: RNC Program Descriptions Full Impact Evaluation Group Programs Included in
this Evaluation
Program Description
Key Program Elements SCG 3502 Advanced
Home Program
• Promotes a comprehensive residential new construction approach with a focus on sustainable design and construction and energy efficiency;
• Uses a combination of education, design assistance and financial support to work with building and related industries;
• Includes single family, single family attached (town homes), and low-rise multifamily (3 or fewer stories) residences.
There are three whole-house approaches to participation:
1) California Energy Star New Homes Program. Home must meet the Energy Star criteria.
2) High-rise multi-family program, increasing overall energy efficiency by 15% or more compared to Title 24.
3) High-performing new homes program. Tier 1 must be at least 15% better than Title 24 as detailed in compliance models; Tier 2 must be 35% better. Due to the high volume of measures being rebated the program was temporarily shut down and then re-opened, offering only whole-house incentives for buildings exceeding the Standards by 15%.
SDGE 3007 Advanced Home Program
• Promotes a comprehensive residential new construction approach with a focus on sustainable design and construction and energy efficiency;
• Uses a combination of education, design assistance and financial support to work with building and related industries.
There are three whole-house approaches to participation:
1) California Energy Star New Homes Program. Home must meet the Energy Star criteria.
2) High-rise multi-family program, increasing overall energy efficiency by 15% or more compared to Title 24.
3) High-performing new homes program. Tier 1 must be at least 15% better than Title 24 as detailed in compliance models; Tier 2 must be 35% better. SCE 2505 CA New
Homes Program
• Awards a limited number of financial incentives to homebuilders who construct homes (single or multifamily) that exceed California's energy efficiency standards for new residential construction (Title 24);
• Provides training opportunities, technical support and marketing
1) Offers incentives for homes built 15% above the Standards.
2) Offers an additional whole-house incentive to homes built 20% or 35% (single-family only) above the Standards in their inland region (T24 CZ 8, 9, 10, 14, 15, and 16).
3) Offers a selection of prescriptive incentives for various energy efficiency measures, including appliances and lighting.
Table 2-1: RNC Program Descriptions Full Impact Evaluation Group Programs Included in
this Evaluation
Program Description
Key Program Elements resources that will help homebuilders to
build more energy efficient homes.
The program is implemented by two subcontractors, ICF and HMG. (HMG is also implementing SCE’s Affordable Housing Program (SCE 2542, which is co-sponsored by SCG 3537) and Designed for Comfort (SCE 2543))
PGE 2009 Residential New Construction Program
Builders of single-family homes within PG&E's service area can apply for financial incentives for maximizing the energy efficiency of their new homes. Energy efficient features may be individually added to homes through the Prescriptive Option, or builders can upgrade to the California ENERGY STAR® New Homes Program by meeting the specifications of the U.S. Environmental Protection Agency (EPA).
1) Includes whole-house incentives for houses built 15% above the 2005 Title 24 Standards that qualify as Energy Star new homes.
2) PG&E also has extensive prescriptive incentives, offering rebates for measures such as energy efficient dish and clothes washers, central natural gas furnaces, tankless water heaters, and cool roofs.
2.2.2 Verification-Guided
Evaluation Program Descriptions
The programs included in the verification-guided cluster are described in Table 2-2.
Table 2-2: RNC Program Descriptions: Verification-Guided Evaluation Group Programs Included in
this Evaluation
Program Description
Key Program Elements SCG 3537 Designed for
Comfort program SCE 2543 Designed for Comfort program
DfC uses a comprehensive building analysis approach that fills a gap not served by other programs by providing incentives for the replacement of older inefficient heating, cooling, and water heating equipment, insulation, and windows.
1) Targets older affordable housing, and provides design assistance, training, and incentives to improve building energy efficiency by 20% above existing conditions. The minimum efficiency requirement for any equipment or materials is specified by Title 24 code or Title 20 code.
2) The owner/developer is required to hire a HERS rater to establish the existing condition of the housing units; after the retrofit work is completed, all measure installations are verified by the HERS rater.
3) The DfC program implementer, Heschong-Mahone Group (HMG), provides quality control conducted by its own staff on 10% of all units.
PGE 2059 California Multifamily Homes New Construction Program
Facilitates energy-efficient design and construction in multifamily housing through design assistance, cash incentives and ENERGY STAR® marketing benefits to both low-rise and high-rise multifamily projects.
1) Designed to address several obstacles associated with the multifaceted structure of the multifamily new construction market. Barriers include owner-developer versus tenant split incentives, lack of market differentiation and tenant understanding, cost constraints, and market inertia.
2) Encourages the installation of qualifying energy-efficient products in individual tenant units and in the common areas of residential apartment buildings, mobile home parks, and condominium complexes.
3) The Energy Efficiency Rebates for Multifamily Properties are offered to multifamily property owners and managers of new residential dwellings that contain two or more units to achieve energy savings of 15% above Title 24.
2.2.3
Tracking Only Evaluation Program Descriptions
The programs evaluated as tracking only programs are described in Table 2 3.
Table 2-3: RNC Program Descriptions: Tracking Only Evaluation Group Programs Included in
this Evaluation
Program Description
Key Program Elements SDG&E 3021 Sustainable
Communities • Local program targets residential and nonresidential market segments
• Designed to work in concert with the cities and counties in the SDG&E service territory
• Promotes sustainable development, showcases energy-efficient design and building practices, and encourages local developers to incorporate clean on-site energy generation systems in their multifamily and commercial new construction projects. 11
Participating projects must
1) Be at least 20% better than Title 24 Energy Standards on a whole-building performance basis
2) Obtain LEED certification and
3) Evaluate the installation of on-site renewable energy.
SCE 2514 Sustainable
Communities • Designed to support building construction that will meet future higher efficiency standards.”12
1) Participating projects commit to a goal which is at least 20% better than Title 24 Energy Standards.
2) Other goals include on-site power generation with solar photovoltaics or the installation of a fuel cell.” 13
SCE converted the SCP from a resource program (i.e., one that would claim savings) to a non-resource one, with the Savings by Design program claiming all electricity savings resulting from projects that received design assistance through the SCP.
SCE 2534 Demand
Response Emerging • Demonstrates the effectiveness of various energy efficiency measures on
1) Installs emerging energy efficient technologies in newly constructed homes. 2) Home buyers will not directly control any of the measures or affect their
11 SDG&E 3021 Q308 Report Narrative to the CPUC (http://eega2006.cpuc.ca.gov/DisplayQuarterlyReport.aspx?ID=9) 12 SCE 2514 Q108 Report Narrative to the CPUC (http://eega2006.cpuc.ca.gov/DisplayQuarterlyReport.aspx?ID=7) 13 SCE 2514 Q108 Report Narrative to the CPUC (http://eega2006.cpuc.ca.gov/DisplayQuarterlyReport.aspx?ID=7)
Programs Included in
this Evaluation Program Description Key Program Elements
Technologies a community scale.
• Seeks to identify builders to participate in constructing approximately 95 homes with these technologies and exceed 2005 Title 24 standards by a minimum of 30%.14
proper operation—either they are installed and functioning properly, or they are not.
This demonstration program was originally intended to offer demand response technologies but removed them from the list of measures after staff decided that they duplicated offerings by other programs.
SCE 2558 Automatic Energy Review for Schools (AERS)
• Seeks to increase the energy performance of new and modernized school buildings beyond typical compliance with efficiency standards.
• Seeks to identify potential energy-saving design modification opportunities in public schools and intervene during a time in the process when changes to building project drawings normally occur.
1) Implemented by the Benningfield Group (Benningfield), which has overall responsibility for program management.
2) Designed to increase the energy efficiency of school building projects that meet or marginally exceed state Title 24 building standards.
3) Takes advantage of a narrow window of opportunity during the Division of the State Architect (DSA) review process.
4) Four key elements:
• Targets school building projects after they have been submitted to DSA for review but before DSA’s approval. All projects in the DSA pipeline are reviewed for their eligibility.
• Identifies candidate building projects by mining the DSA database
• Focuses on low-impact changes to building plans that provide maximum efficiency savings. Intervenes at a late stage in the design process and focuses on technologies with small impacts on design.
• Provides incentives to help defray the costs of design changes. Offers a stipend of $2,000 to cover the redesign costs and pays 100 percent of the DSA review fee up to $2,250.
SCE 2557 Transforming the Market for ENERGY STAR Manufactured (Mobile) Homes
• Provides incentives to encourage increased efficiency in new manufactured homes
1) Designed to move new manufactured homes from a basic level of energy efficiency to high performance Energy Star® levels by the strategic application of incentives.
2) Requires the installation of properly-sized cooling equipment.
3) The Manufactured Housing Research Alliance (MHRA) implements the program. The contract between SCE and MHRA includes a detailed Statement of Work (SOW) that defined the budget, objectives, and timeline for the program during the 2006 through 2008 program cycle.
Program incentives were designed to partly offset the increased cost of