Septic Shock: Providing Early Warnings Through
Multivariate Logistic Regression Models
by
Dewang Shavdia
Submitted to the Harvard-MIT Division of Health Sciences & Technology
in partial fulfillment of the requirements for the degree of
Master of Engineering in Biomedical Engineering
at the
MASSACHUSETTS INSTITUTE OF TECHNOLOGY
September 2007
@ Dewang Shavdia, MMVII. All rights reserved.
The author hereby grants to MIT permission to reproduce and distribute publicly
paper and electronic copies of this thesis document in whole or in part.
A uthor ... . . - . .. . . . ...
Harvard-MIT Division of Health Sciences & Technology
August 15, 2007
Certified by
..
:7y7...
..
...
Roger G. Mark, M.D., Ph.D.
Distinguished Professor in Health Sciences and Technology
Professor of Electrical Engineering
Thesis Supervisor
Accepted by.
MASSACHUSE;TS INS TF
OF TEOHNOLOGYLIBRARIES
...
V
.
... ..
...
.
..
... ...
Martha L. Gray, Ph.D.
Edward Hood Taplin Professor of Medical and Electrical Engineering
Director, Harvard-MIT Division of Health Sciences and Technology
ARCHNES
LIBRARIES
F eTOHNOLOT=DEC 0 6 2007
LIBRARIES
m• A w I =.(111_ý -
__
--
A /
Septic Shock: Providing Early Warnings Through Multivariate Logistic
Regression Models
by
Dewang Shavdia
Submitted to the Harvard-MIT Division of Health Sciences & Technology on August 15, 2007, in partial fulfillment of the
requirements for the degree of
Master of Engineering in Biomedical Engineering
Abstract
Early goal-directed therapy (EGDT) in severe sepsis and septic shock has shown to provide substantial benefits in patient outcomes. However, these preventive therapeutic interven-tions are contingent upon an early detection or suspicion of the underlying septic etiology. Detection of sepsis in the early stages can be difficult, as the initial pathogenesis can occur while the patient is still displaying normal vital signs. This study focuses on developing an early warning system (EWS) to provide clinicians with a forewarning of an impending hypotensive crisis-thus allowing for EGDT intervention. Research was completed in three main stages: (1) generating an annotated septic shock dataset, (2) constructing multivari-ate logistic regression EWS models using the annotmultivari-ated dataset, and (3) testing the EWS models in a forward, causal manner on a random cohort of patients to simulate performance in a real-life ICU setting.
The annotated septic shock dataset was created using the Multi-parameter Intelligent Monitoring for Intensive Care II (MIMIC II) database. Automated pre-annotations were generated using search criteria designed to identify two patient types: (1) sepsis patients who do not progress to septic shock, and (2) sepsis patient who progress to septic shock. Currently, manual review by expert clinicians to verify the pre-annotations has not been completed.
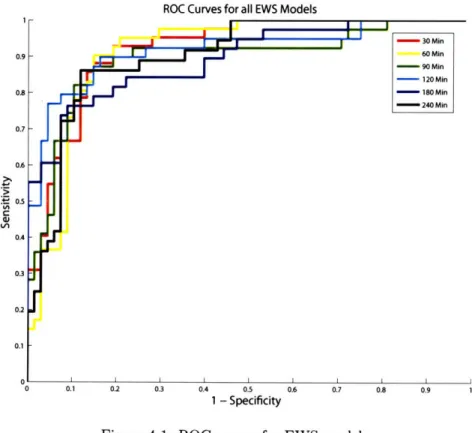
Six separate EWS models were constructed using the annotated septic shock dataset. The multivariate logistic regression EWS models were trained to differentiate between 107 high-risk sepsis patients of whom 39 experienced a hypotensive crisis and 68 who remained stable. The models were tested using 7-fold cross validation; the mean area under the receiver operating characteristic (ROC) curve for the best model was 0.940 ± 0.038.
The EWS models were then tested in a forward, casual manner on a random cohort of 500 ICU patients to mimic the patients' stay in the unit. The model with the highest performance achieved a sensitivity of 0.85 and a positive predictive value (PPV) of 0.70. Of the 35 episodes of hypotension despite fluid resuscitation present in the random patient dataset, the model provided early warnings for 29 episodes with a mean early warning time of 582 ± 355 minutes.
Thesis Supervisor: Roger G. Mark, M.D., Ph.D.
Title: Distinguished Professor in Health Sciences and Technology Professor of Electrical Engineering
Acknowledgments
I started working in the Laboratory for Computational Physiology (LCP) nearly a year and half ago during the IAP of my senior year. Well frankly, I can't say it has been anything besides an exceptional journey-and for that, there are many people to thank.
First and foremost, I would like to thank Dr. Roger Mark for the opportunity to be involved with this research project. I first met Dr. Mark as a student in his course; he is as dedicated and sincere a teacher as he is a PI. The personal attention Dr. Mark puts into each role is incredible. He would spend hours scrutinizing individual patient cases with me--not only increasing my intuition on the problem at hand but also making me feel like an important part of the team.
I would like to thank Dr. Andrew Reisner and Dr. Mohammed Saeed for sharing their insightful grasp on clinical data. Their recommendations have helped make many key decisions throughout this project.
I would like to thank the all-star crew at LCP. I would like to thank Dr. Gari Clifford for his sense of humor (and his conviction that every big corporation in America is out to get him); I would like to thank Mauro "the God of Linux" Villarroel for sabotaging my computer so it would only work after he fixed it; I would like to thank Dr. Li-Wei Lehman for her warm and friendly greetings; I would like to thank Dr. Tushar Parkliar for well, being Tushar; I would like to thank Dr. Thomas Heldt for his constructive criticisms; I would like to thank Shirley Li for making TAing a great experience; I would like to thank Ali Saeed for being there to watch Borat on YouTube when we were the only ones left in lab; and last but far from least, I would like to thank the future doctor Sherman Jia. Sherman, it's been quite a trip and it's been a pleasure to have had you along for the ride.
I would like to thank my family. I would like to thank my Mom and Dad for always being supportive of the decisions I make. For anything I've needed, they have always been there for me (and yes, I've been eating well). I would like to thank my sister, Bhairvee, for the countless life advice she has given me.
Contents
1 Introduction 13 1.1 M otivation . . . ... . . 13 1.2 Thesis Outline ... ... 14 2 Background 15 2.1 Defining Sepsis ... ... ... ... .. ... .. 152.1.1 1991 ACCP / SCCM Consensus Conference ... . . . . . 16
2.1.2 2001 International Sepsis Definition . ... 18
2.2 Epidem iology ... ... .. 20
2.2.1 Incidence ... . ... 20
2.2.2 M ortality . . .. . .. . . . .. .. . . . .. .. . . .. .. .. . .. . 21
2.3 Pathophysiology ... 22
2.3.1 Immune Mediated Injury ... 22
2.3.2 Reviewing the Traditional View . ... .. 24
2.4 Early Warnings of Sepsis ... 25
2.5 Use of Machine Learning Algorithms . ... ... 25
3 Generating an Annotated Septic Shock Dataset 27 3.1 MIMIC II Database ... 27
3.1.1 Input Data .... ... ... .... ... .... 28
3.1.2 Challenges of Manual Annotation . ... . 29
3.2 Automated Pre-Annotation ... 30
3.2.1 Pre-Annotation Process ... 30
3.2.2 Sample Patient Run ... 33
3.2.3 Baseline Patient Characteristics ... .. 33
3.2.4 Real-time Usage of the SSOD ... 33
3.3 M anual Review ... 33
3.4 Final Dataset ... ... ... .... .. 37
4 Constructing the Septic Shock Early Warning System 39 4.1 Training Dataset ... 39
4.1.1 Feature Extraction ... 40
4.2 Training the Classifier ... 41
4.3 Results . . . ... . 41
4.3.1 Cross Validation ... 41
4.3.2 Testing & Training on the Whole Dataset . ... 42
4.3.4 Calibration . ... 44
4.3.5 Conclusion . ... ... ... 45
5 Evaluating the Septic Shock Early Warning System 47 5.1 Evaluation Overview . ... ... ... .... 47
5.1.1 Overall Process . ... 47
5.1.2 Summing Algorithms . . . ... ... . 48
5.2 Evaluation Metrics ... ... .... . . . . . . . . . 49
5.2.1 Defining a Gold Standard . .... ... 49
5.2.2 Positive & Negative Predictive Value ... . . . . . . . . ..... 50
5.2.3 Sensitivity & Specificity ... ... . 51
5.3 Test Patient Characteristics . ... . 52
5.4 Results ... . . .... ... 54
5.4.1. Sensitivity versus Positive Predictive Value . ... ... 54
5.4.2 Detailed Results . . . ... .... ... . 55
6 Discussion & Conclusion 61 6.1 Discussion . ... . ... ... 61
6.1.1 Overall Performance ... . . . . . . 61
6.1.2 Clinical Applicability . . ... .. ... . . . . . . 63
6.2 Conclusion . ... ... . 65
A Calibration Plots for EWS Models 67
B Sensitivity versus PPV Plots for EWS Models 69
C Early Warning System: Sample Patient Runs 77
List of Figures
2-1 Clinical spectrum of sepsis ... 3-1
3-2
3-3
3-4Schematic of the automated pre-annotation process .. Septic shock onset detection: patient 69869 . . . . Septic shock onset detection: patient 63668 . . . . Screen shot of the manual review interface . ...
4-1 ROC curves for EWS models ...
Overall EWS evaluation process . . . . .
Definitions for PPV and NPV ... . . ...
Definitions for sensitivity. ...
Sample sensitivity versus PPV plot . . . . Overall classifier output value distribution . . . Maximum classifier value prior to gold-standard Sample patient run of the EWS model . . . . .
. . . . . 48 . . . . . 50 . . . . 52 . . . . . 55
. . . .
.
56
episodes . . ... . 57 . . . . . 59 6-1 PPV versus prevalence ...A-1 Calibration plots for EWS models . . . .
B-i Sensitivity versus PPV plots for 30 minute prior model.. Sensitivity versus PPV
Sensitivity versus PPV Sensitivity versus PPV Sensitivity versus PPV Sensitivity versus PPV
plots for 60 minute prior model. plots for 90 minute prior model. plots for 120 minute prior model.. plots for 180 minute prior model.. plots for 240 minute prior model.. Sample patient run of the EWS model . . . . Sample patient run of the EWS model . . . . Sample patient run of the EWS model . . . . Sample patient run of the EWS model . . . . Sample patient run of the EWS model . . . . 5-1 5-2
5-3
5-4 5-5 5-6 5-7B-2
B-3
B-4
B-5
B-6
C-1
C-2
C-3
C-4
C-5
List of Tables
2.1 1991 ACCP / SCCM SIRS Definition ... 16
2.2 2001 Updated SIRS Definition ... 19
2.3 Inflammatory Mediators of Sepsis ... ... 24
3.1 Clinical Input Data ... 29
3.2 Baseline Patient Characteristics. . ... ... 36
4.1 Normalization for the EWS Feature Matrix .. ... .... 40
4.2 General Performance Indices for EWS Models . ... 42
4.3 k-best Variables for EWS Models ... ... .. 43
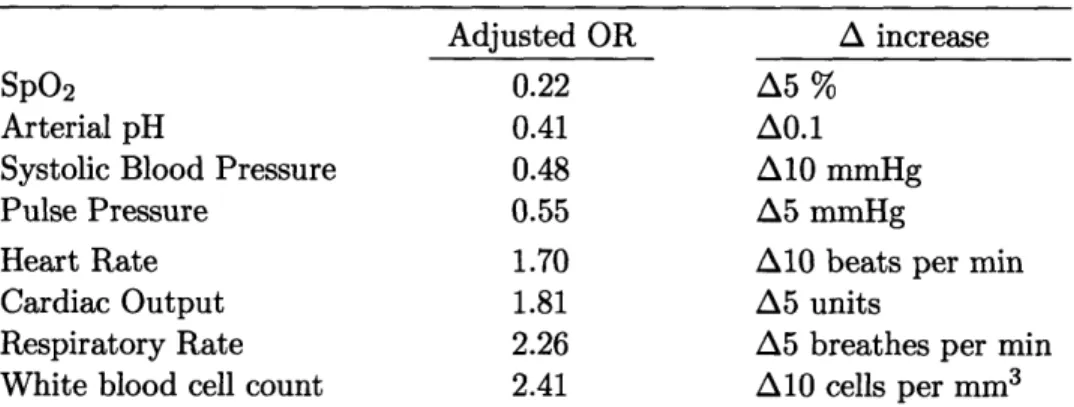
4.4 Risk Factors for Septic Shock ... 44
4.5 Hosmer-Lemeshow Goodness-of-Fit Testing. . ... . . 45
5.1 Baseline Patient Characteristics. . ... ... 53
5.2 Performance Measures for 120 Minute Prior Model ... . . . . 58
D.1 PIDs for All Septic Shock Patients ... .. 84
Chapter 1
Introduction
1.1
Motivation
Early goal-directed therapy (EGDT) for severe sepsis and septic shock has been shown to provide substantial benefits in patient outcome [1]. A retrospective meta-study found a significant decrease in sepsis related mortality rates in 10 out of 12 tertiary care hospitals after the implementation of EGDT protocols; mean mortality rate decreased from 44.8
± 7.8% to 24.5 ± 5.5% [1]. Furthermore, a study conducted by Kumar et al. found a
survival rate of 80% when effective antibiotic therapy was initiated within the first hour of hypotension [2]. Yet sepsis remains the leading cause of death in noncoronary intensive care units (ICUs) with associated mortality rates upwards of 50%.
The therapeutic benefits conferred through EGDT are solely contingent upon the early detection or suspicion of the underlying septic etiology. The difficulty of such a task is highlighted by the disparity between EDGT results and national epidemiological find-ings. Morality rates for sepsis remain high not because of the lack of effective therapeutic interventions-but rather the delay of their administration.
Currently, the majority of research on the early detection of sepsis focuses on the search for predictive biomarkers. The clinical utility of such a marker, assuming one is found, is still questionable. In order to request a measurement, the clinician would have to suspect an underlying septic etiology-which is often overlooked until the patient becomes grossly symptomatic. Furthermore, lab results may take several hours to return-potentially past the window of preventive therapeutic intervention.
instan-taneously sampled variable, or (2) commonly measured variables. Such a measure could be continuously monitored independent of the clinician's prior suspicions. Furthermore, there would be no delay from the measurement of the variable(s) to the issuance of an early warning.
The focus of this thesis is the development of a septic shock early warning system (EWS) which uses commonly measured clinical variables. The EWS takes form as a multivariate logistic regression model designed to predict the hallmark of septic shock: hypotension despite fluid resuscitation. Ultimately, a reliable early warning would allow clinicians to administer EGDT protocols while still effective-thus, reducing patient mortality rate.
1.2
Thesis Outline
A brief outline of the thesis is provided below:
* Chapter 2: Background. This chapter presents an overview of sepsis and its
associ-ated disorders to provide context for the current research.
* Chapter 3: Generating an Annotated Septic Shock Dataset. This chapter details the
semi-automated process used to generate the septic shock dataset. The dataset was subsequently used to build the EWS.
* Chapter 4: Constructing the Septic Shock Early Warning System. This chapter
describes the construction of multivariate regression models used as EWS models. Results on classifier performance in a static evaluation setting are provided in this chapter.
* Chapter 5: Evaluating the Septic Shock Early Warning System. This chapter details
the evaluation of the EWS models in a forward, causal manner to simulate performance in an ICU setting.
* Chapter 6: Discussion & Conclusion. This chapter analyzes the strengths and
weaknesses of the EWS system in the context of overall performance and clinical applicability. Areas of focus for future work are also discussed.
Chapter 2
Background
This section aims at presenting the reader with an overview of sepsis and its associated disorders. The chapter does not attempt to be a comprehensive guide but rather a summary to provide context for the current research. The chapter starts with providing the reader with the clinical definition of sepsis; epidemiological findings are then presented; two theories on the pathogenesis of sepsis are offered; the challenges in finding early warning signs are stated; finally, the chapter concludes with a brief discussion on the usage of machine learning algorithms in a clinical setting.
2.1
Defining Sepsis
Sepsis is the leading cause of death in noncoronary intensive care units (ICU) in the United States [3]. Despite its high morbidity rate, sepsis remains an ill-defined disorder. The sequelae of nonspecific signs and symptoms associated with sepsis make creating a well defined definition a difficult task. Unfortunately, no biomarkers have yet to come to its rescue as CPK-MB and troponin have for myocardial infarctions. Definitions based on the myriad of sepsis symptoms are often criticized with either being overly sensitive with an associated loss in specificity, or exceedingly involved with little clinical usefulness [4].
Nonetheless, current definitions of sepsis provide an adequate framework to construct the foundation for research and clinical therapeutics. The core of the current definition of sepsis arose from the 1991 American College of Chest Physicians / Society of Critical Care Medicine (ACCP / SCCM) Consensus Conference. This definition was revisited and slightly modified by the 2001 Internal Sepsis Definition Conference. Both definitions are
detailed below.
2.1.1
1991 ACCP
/
SCCM Consensus Conference
The 1991 ACCP / SCCM Consensus Conference aimed at providing a set of uniform def-initions which could be applied to patients with sepsis and its associated complications
[3]. A rising incidence of the disorder coupled with increasing clinical trials for sepsis treat-ment, created an environment in which infectious related terminology was used with varying definitions-further complicating management of the disorder. The outcome of the confer-ence, detailed below, provides a set of definitions used to characterize the progression of the disorder.
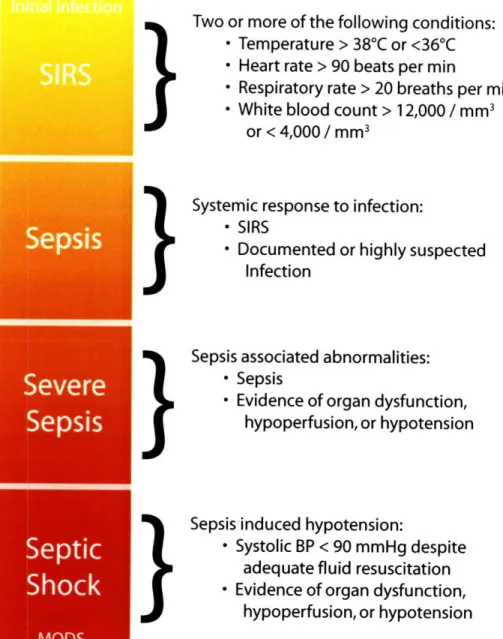
Sepsis refers to a clinical spectrum of complications starting with the initial infection and ultimately progressing to septic shock as shown in Figure 2-1. The infection can arise from a variety of agents including Gram-negative bacteria, Gram-positive bacteria, fungi, or viruses. Sepsis may also occur without a detectable infectious source, in which case microbial endotoxins are considered the initiators of the clinical progression [5]. Regardless of the underlying infectious agent, the resultant generalized hyper-inflammatory state triggers the cascade of events ultimately responsible for progressing the patient through the sepsis spectrum.
The initial insult manifests as the nonspecific systemic inflammatory response syndrome (SIRS). SIRS is diagnosed when a patient has two or more of the clinical abnormalities provided in Table 2.1. The SIRS criteria has been criticized for its oversensitivity and associated loss of definition specificity [4]. Although it is important to note, Bone et al. acknowledged a wide variety of noninfectious insults could produce SIRS, and had hopes future definitions may include aspects of the underlying pathogenesis specific to the disorder
[3].
SIRS Abnormalities Temperature > 38 0C or < 36 'C
Heart rate > 90 beats per minute
Repiratory rate > 20 breathes per minute White blood cell count > 12,000 cells per mm3
or < 4,000 cells per mm3
Table 2.1: According to the 1991 ACCP / SCCM definition, the diagnoses of the systemic inflam-matory response syndrome (SIRS) is made when patients present with at least two of the clinical findings above.
}
}
}
}
Figure 2-1: The clinical spectrum of sepsis begins with the initial toxic insult and progresses through increasing inflammatory response stages. The spectrum ultimately ends in septic shock and/or multiple organ dysfunction syndrome (MODS).
Two or more of the following conditions:
* Temperature > 38
0C or <36
0C
* Heart rate > 90 beats per min
* Respiratory rate > 20 breaths per min
* White blood count > 12,000
/ mm
3or < 4,000
/
mm
3Systemic response to infection:
* SIRS
* Documented or highly suspected
Infection
Sepsis associated abnormalities:
* Sepsis
* Evidence of organ dysfunction,
hypoperfusion, or hypotension
Sepsis induced hypotension:
* Systolic BP < 90 mmHg despite
adequate fluid resuscitation
* Evidence of organ dysfunction,
hypoperfusion, or hypotension
Sepsis
Se
The diagnosis of sepsis is made when the systemic response can be traced to a doc-umented (or highly suspected) source of infection. Once again, the patient must present with at least two of the following SIRS abnormalities: (1) temperature, (2) heart rate, (3) respiratory rate, (4) or white blood cell count.
Severe sepsis ensues when sepsis is further complicated with organ dysfunction or hy-poperfusion abnormalities. Evidence of organ dysfunction or hyhy-poperfusion can include, but is not limited to, lactic acidosis, oliguria, or an acute change in mental status [3].
Septic shock, a subset of severe sepsis, is characterized by sepsis-induced arterial hy-potension despite adequate fluid resuscitation. Sepsis-induced hyhy-potension is defined as a sustained systolic blood pressure of less than 90 mmHg or a 40 mmHg drop from base-line. The hypotension must be persistent and must not be secondary to other causes (i.e. cardiogenic shock). Evidence of organ dysfunction or hypoperfusion must also be present.
The clause "despite adequate fluid resuscitation" adds further ambiguity to the clin-ical definition of septic shock. Especially in conjunction with the usage of vasopressors or inotropic agents, the amount of fluid input deemed as "adequate" can vary substan-tially. Nonetheless, in order to establish a precise clinical case definition, "adequate fluid resuscitation" is typically defined as a 20-30 cc/kg volume challenge [1].
2.1.2 2001 International Sepsis Definition
Ten years after the 1991 ACCP / SCCM Consensus Conference was held to establish to uniform definitions for sepsis and the associated spectrum of progressive injurious processes, the 2001 International Sepsis Definitions Conference revisited these definitions to evaluate their efficacy and suggest improvements [6].
Participants of the 2001 Conference agreed the 1991 SIRS definition was overly sensitive and provided little clinical utility in the initial diagnosis of sepsis. Clinicians did not make the diagnosis of sepsis based on the 1991 SIRS criteria, but rather by analyzing the host of symptoms and deciding the patient "looks septic"--regardless of a documented source of infection [6]. Thus in hopes to increase utility in making the sepsis diagnosis, a more comprehensive list of SIRS criteria was established as provided in Table 2.2.
Apart from expanding the SIRS list, the conference found no evidence to support any need for changes in the 1991 definition.
Infection, documented or suspected, in addition to some of the following: General variables
Fever (temperature > 38.3°C) Hypothermia (temperature < 36 °C)
Heart rate > 90 bpm or > 2 SD above the normal value for age Tachypnea
Altered mental status
Significant edema or positive fluid balance (>20 cc/kg over 24 hrs) Hyperglycemia (plasma glucose >120 mg/dL or 7.7 mmol/L)
in the absence of diabetes Inflammatory variables
Leukocytosis (WBC count > 12,000 cells/mm3) Leukopenia (WBC count < 4000 cells/mm3) Normal WBC count with > 10% immature forms
Plasma C-reactive protein > 2 SD above the normal value Plasma procalcitonin > 2 SD above the normal value Hemodynamic variables
Arterial hypotension (SBP < 90 mmHg, or an SBP decrease > 40 mmHg from
SVo2 >
70%
Cardiac index > 3.5 L - min- 1 • m- 2
MAP < 70 baseline)
Organ dysfunction variables
Arterial hypoxemia (Pao2/FIo2 > 300)
Acute oliguria (urine output < 0.5 mL • kg- 1 or 45 mmol/L for at least 2 hrs)
Creatinine increase > 0.5 mg/dL
Coagulation abnormalities (INR > 1.5 or aP1 Ileus (absent bowel sounds)
Thrombocytopenia (platelet count < 100,000 Hyperbilirubinemia (plasma total bilirubin >
hr-1
FT > 60 secs) per mm3)
4 mg/dL or 70 mmol/L) Tissue perfusion variables
Hyperlactatemia (> 1 mmol/L) Decreased capillary refill or mottling
Table 2.2: 2001 Updated SIRS Definition. WBC, white blood count; SBP, systolic blood pressure; MAP; mean arterial blood pressure; So,, mixed venous oxygen saturation; INR, international normalized ratio; aPTT, activated partial thromboplastin time. Adapted from Levy et al [6].
based on their baseline risk and potential to respond to therapy. The proposed PIRO system stratifies patients based on their Predisposing conditions, the nature and extent of the Insult (Infection in the case of sepsis), the nature and magnitude of the host Response, and the degree of concomitant Organ dysfunction. The proposed system requires extensive testing and refinement before it can be applied in clinical practice.
The Conference suggested future work on defining the clinical spectrum of sepsis disor-ders should focus on identified biomarkers to confer both increased sensitivity and specificity to the current definitions [6]. Biomarkers currently being investigated in their role as me-diators of the sepsis cascade include: interleukin (IL)-6, tumor necrosis factor (TNF)-a, adrenomedullin, soluble (s)CD14, sELAM-1, MIP-la, extracelluar phospholipase A2, and C-reactive protein [7, 8, 9, 10, 11].
2.2
Epidemiology
Epidemiological findings of sepsis are marked with high variability because of the inher-ent imprecision in the currinher-ent definition of sepsis. The results are highly sensitive to the case definition for sepsis used in the study. Additionally, retrospective studies (i.e. us-ing discharge summaries) are at the mercy of clinicians to make diagnoses in a consistent manner-a difficult feat when most diagnoses are made on the basis of a gut feeling that the patient is "looking septic".
2.2.1
Incidence
A 1990 study conducted by the Center for Disease Control (CDC) found that the incidence of septicemia had increased from 73.6 per 100,000 patients in 1979 to 175.9 per 100,000 in 1989 [12]. The increased incidence was attributed to the following four reasons: (1) increased prevalence of HIV/AIDS, (2) prolonged survival and increased duration of risk for HIV/AIDS patients, (3) increased usage of invasive monitoring devices (i.e. intravenous catheters), and (4) increased ability to diagnose the disorder [13]. It is important to note that the applicability of these results to sepsis is limited by the case definition used by the study (septicemia versus the 1991 definitions of sepsis).
A prospective observational study completed in 1995 by Rangel-Frausto et al. inves-tigated the incidence of sepsis in the ICUs and general medical wards in a tertiary care
medical teaching center [14]. The study examined 3,708 admitted patients using the 1991 ACCP / SCCM consensus criteria. 68% of patients fulfilled the SIRS criteria; of this subset of patients, 26% went on to develop sepsis, 18% developed severe sepsis, and 4% developed septic shock.
Sands et al. examined the occurrence rates of sepsis in eight academic medical centers from 1993 to 1994 [15]. The study used a modified, more stringent, version of the 1991 ACCP / SCCM consensus criteria. An assessment of 12,759 ICU and non-ICU patients yielded an occurrence rate of 2.0 cases per 100 admissions; it is important to note, there was substantial variability amongst the medical centers.
Whether arising from fundamental differences in patient populations or case definitions used by investigators, there is a high degree of variability in findings of the studies men-tioned above. Similar to the studies presented, most of the data used in epidemiological studies of sepsis is derived from tertiary care centers. Thus, the results cannot be general-ized to primary or secondary care hospitals without knowing the size, demographics, and pathologies of the populations served by these hospitals [13].
2.2.2
Mortality
Morality rates observed for sepsis varied substantially amongst studies examining the out-come of patients with sepsis. The 1990 CDC study observed a decrease in mortality rate in patients with septicemia from 1979 to 1989 (31.0% and 25.3% respectively). The de-creased mortality rate was attributed to a combination of changes in the demographics of the affected population and improvements in the treatment of the disorder.
A meta-analysis of 131 studies from 1958 to 1997 (99 prospective and 32 retrospective) conducted by Friedman et al. found an overall mortality rate of 49.7% [16]. A wide range of morality rates was found amongst the studies, with the majority reporting rates between 40-80%. The meta-analysis reported an overall decrease in mortality rate over the years; however, the authors warned this result should be approached with caution because of the heterogeneity of both: (1) the patient populations, and (2) sepsis case definitions between studies.
Despite the high variability in mortality rates, one trend was consistently seen amongst studies-an increase in mortality risk with the stepwise progression of severity. A prospec-tive study of patients admitted in 99 Italian ICUs found a 36% mortality rate in patients
with sepsis, 52% in patients with severe sepsis, and 82% in patient with septic shock [17]. Rangel-Frausto et al. observed a similar increase in mortality rate in the 3,708 patients studied (7% from SIRS, 16% from sepsis, 20% from severe sepsis, and 46% from septic shock).
2.3
Pathophysiology
The traditional theory on sepsis views the disorder as an uncontrolled inflammatory re-sponse resulting in immune-mediated injury. The progression of the disorder is not a direct consequence of the initial insult, but rather the maladaptive release of inflammatory cy-tokines. However, recent research has challenged this view and points towards an immune suppressed state rather than an overzealous immune response. Overviews of both theories are provided below.
2.3.1
Immune Mediated Injury
The initial immune reaction to infection involves a series of complex, interdependent cellular and non-cellular processes. Normally, these processes work to heighten the body's immune response and help clear the underlying infection. However, when this immunologic cascade functions in an unregulated manner, the body's defense mechanism can cause extensive immune-mediated bystander tissue injury-ultimately resulting in organ dysfunction. This uncontrolled triggering of the body's defense mechanisms by the invading infectious agent is the underlying pathway of injury in sepsis.
The immune response to infection includes aspects of both innate and adaptive im-munity. This response includes the release of cytokines, the activation of neutrophils, monocytes, and microvascular endothelial cells, in addition to the activation of neuroen-docrine reflexes and plasma protein cascade systems (i.e. complement system), the intrinsic and extrinsic pathways of coagulation, and the fibrinolytic system [18]. The extensive over-activation and complex interactions between these immunologic processes result in microvascular injury and tissue ischemia characteristic of septic shock [19].
Cellular Mediators
Macrophage. Macrophages play a pivotal role in orchestrating the initial immune
re-sponse to infection. Macrophages, as a result of their phagocytic activity, are the primary immune cells to interact with the invading pathogen. Through the release of various cy-tokines, macrophages are able to modulate a wide range of inflammatory responses. How-ever, the unregulated macrophagic response seen in sepsis, in conjunction with other active immune cells, can result in an uncontrolled destructive cytokine cascade [20]. The secretion of these proinflammatory cytokines (TNF-a, interferon-'y, IL-1, IL-2, and IL-6) synergisti-cally act to amplify the immune response [18, 21].
Neutrophils. Neutrophils are the key immune players in the eradication of pathogens. Neutrophils generate a variety of biochemical agents targeted to clear the invading pathogen. These agents include proteases, cytokines, and toxic oxygen radicals [18]. Similar to the macrophage response, unregulated stimulation of neutrophils can result in significant immune-mediated injury as summarized in Table 2.3. Furthermore, the proinflammatory state can result in the aggregation of neutrophils in the microcirculation resulting in occlu-sion of the microvasculature-and ultimately tissue ischemia [18].
Endothelium. Endothelial cell injury leads to the hallmark decreased systemic vascular resistance (SVR) and hypotension observed in septic shock. Injurious endothelial processes are mediated by the production of a variety of noxious substances (including oxygen free radicals, arachidonic acid metabolites, products of anaerobic metabolism and lactic aci-dosis), complement activation, platelet aggregation, neutrophil activation, and monocyte production of cytokines [18]. Additionally, endothelial cells may themselves transform into a proinflammatory state causing increased microvascular permeability with subsequent fluid loss into the interstitium [19]. Vasodilation is the direct result of the release of various va-soactive molecules during the inflammatory cascade mentioned above [19]. The vasodilation combined with fluid loss produce the persistent hypotension observed in septic shock pa-tients.
Mediator Origin Affects
TNF-a Macrophage Production of elastase, superoxide ion, hydrogen perox-ide, sPLA2, PAF, leukotriene B4, and thromboxane A2 IL-1 Macrophage Production of prostaglandins, elastases, collagenases
Promotes transendothelial migration of neutrophils Activates endothelial microvascular cells
ROS Leukocytes Disrupt cell membrane and lead to necrosis and/or apop-tosis
NO Endothelium Vasodilation
Protein and membrance phospholipid alterations Mitochondial dysfunction
ILM Phospholipid Production of PAF, and AA
metabolism
AA Various Production of prostaglandins and luekotrienes
Conversion to isoprostanes by free radical peroxidation
PAF Various Stimulation of neutrophil adhension to endothelium
Increase microvascular permability
Table 2.3: Inflammatory Mediators of Sepsis. TNF, tumor necrosis factor; sPLA2, secretory phos-pholipase A2; IL, interleukin; ROS, reactive oxygen species; NO, nitric oxide; ILM, inflammatory lipid mediators; AA, arachidonic acid; PAF, platelet-activating factor.
Myocardial Dysfunction
Myocardial dysfunction, as evidenced by biventricular dilatation and reduced ejection frac-tion, is commonly observed in patients with severe sepsis and septic shock. Depressed cardiac function is a result of circulating myocardial depressant factors (TNF-alpha and IL-lbeta) and not myocardial hypoperfusion. Both nitric oxide (NO)-dependent and NO-independent mechanisms are responsible for the reduced cardiac contractility [22].
2.3.2
Reviewing the Traditional View
Results from recent work have challenged the notion that injury from sepsis is an immune mediated process. In fact, patients with sepsis have a loss of delayed hypersensitivity, an inability to clear infection, and a predisposition to nosocomial infections-a state more consistent with immunosuppression rather than unregulated immunological function [21].
CD4 T cells have the ability to secrete two different cytokine profiles: (1) a proin-flammatory profile, Thl or (2) an anti-inproin-flammatory profile, Th2. Although there is a proinflammatory response at the site of infection, there is a systemic shift to an anti-inflammatory response outside the infected area [23]. Histological findings from spleens of deceased sepsis patients show a decreased count in the number of B cells, CD4 T cells, and
follicular dendritic cells [21]. In contrast to the immune mediated view, a prospective study on 35 postoperative patients with sepsis showed survival was correlated with recovery of the inflammatory (IL-12 p40, and IL-lbeta) rather than anti-inflammatory response (IL-10)
[24].
2.4
Early Warnings of Sepsis
Early goal directed therapy has proven effective in reducing mortality risk for patients diagnosed with septic shock [1]. However, currently no early warning signs or biomarkers have been found to predict the transition from severe sepsis to septic shock in the adult population. In neonates, detecting reduced variability and transient decelerations in heart rate have proved effective in the early diagnosis sepsis [25, 26]. Unfortunately, this trend does not carry over to the adult population.
Various biomarkers have been investigated as predictors for patient outcome (including TNF-a, various ILs, interferon-y, and lactate). Although some markers provide reasonable efficacy in predicting outcome, none are able to provide early warning. It is possible that the underlying pathologic processes responsible for the transition to septic shock have already been set in motion when levels of these biomarkers become clinically abnormal.
2.5
Use of Machine Learning Algorithms
Machine learning algorithms have been used in clinical settings for several decades. Computer-based clinical-assist tools have been developed to perform a variety of tasks ranging from predicting drug response to carcinoma classification. Machine learning algorithms are ideal when data is plentiful but theory is lacking-an accurate description of many of the clinical challenges faced today.
Computer-based clinical-assist tools gained notoriety in the early 1970's with the devel-opment of MYCIN. Although not technically a machine learning algorithm, MYCIN was a rule-based expert system designed to recommend a course of antimicrobial therapy [27]. MYCIN outperformed five Stanford Medical School faculty members; however, the system was never used in practice because of ethical and legal complications [27].
In the 1990's, the Acute Physiology and Chronic Health Evaluation (APACHE) II system gained popularity as a measure of the severity of disease for ICU patients. APACHE uses a
multivariate regression model (feature matrix including 12 physiologic measurements, age, and previous health status) to prognostically stratify patients [28]. The APACHE score is generated during the initial 24 hours of a patient's stay. Due to therapeutic interventions, there is little utility of a recomputed APACHE score after the initial 24 hours. Currently, the Simplified Acute Physiology Score (SAPS) II is more commonly used as the method does not require regression calculations [29].
Machine learning algorithms designed for medical usage are typically run on static datasets (e.g. gene arrays, initial physiologic values, etc.) to perform static classifica-tion and/or stratificaclassifica-tion. A search on PubMed found no clinical algorithms designed to run in real-time on time variant data. Ultimately, it is the focus of this research to develop such a system to act as an early warning system for septic shock.
Chapter 3
Generating an Annotated Septic
Shock Dataset
Development of an early warning system for septic shock requires an annotated dataset. As with any machine learning exercise, the predictive value of the classifier is highly dependent upon the accuracy and fidelity of the initial training dataset. Currently, there are no publicly available annotated datasets for septic shock. Thus, to support the current research, a dataset with the following properties was generated:
* Set of positive septic shock patients:
- Documented time of transition from sepsis or severe sepsis to septic shock
- Hypotension not secondary to any other causes (i.e. cardiogenic shock)
- Sufficient data to support analysis * Set of negative control patients:
- Set of high risk sepsis patients who do not transition to septic shock
- Sufficient data to support analysis
This chapter details the process of generating an annotated septic shock dataset that fulfills the criteria listed above.
3.1
MIMIC II Database
The Multi-parameter Intelligent Monitoring for Intensive Care II (MIMIC II) database is the product of an interdisciplinary team from academia (MIT), industry (Phillips Medi-cal Systems), and cliniMedi-cal medicine (Beth Israel Deaconess MediMedi-cal Center); the extensive
temporal database was created to facilitate the development and evaluation of ICU decision-support systems [30]. In its current state, the MIMIC II database houses approximately 17,000 patient records collected from various Intensive Care Units (ICUs) of the Beth Is-rael Deaconess Medical Center. All patient data used in this study were derived from the MIMIC II database.
3.1.1
Input Data
This section describes the clinical data used for analysis. Specifics on how the data were used is provided in more detail in the discussion of each algorithm.
Four distinct types of clinical information were extracted for each patient: (1) physiologic values, (2) lab values, (3) medications, and (4) fluid administration. All values are nurse verified; a nurse enters or confirms a value (for the measurement of interest) which is representative of the patient's current state. Because of this validation, sampling rates for physiologic values, medications, and fluids vary from 15-120 minutes, with a mean and median of approximately 60 minutes. Sampling rates for lab values depend upon how often the measurements are requested by the clinician.
Continuously sampled data in the ICU are prone to artifact and noise corruption. The choice to use nurse verified data was made in order to avoid the challenges of identifying artifactual versus physiologic abnormalities. The resultant loss in sampling frequency should not affect early warning capabilities as the devolution towards septic shock is a process which may takes hours to days.
Physiologic values. A range of physiologic variables (hemodynamic, respiratory, metabolic)
was extracted for each patient. The list of variables is provided in Table 3.1. Not all patients had readings for all variables listed, nor were all variables used to determine if the patient experienced septic shock. Variables required to determine the onset of shock are referenced in Section 3.2.1. Variables used to develop the early warning system are detailed in Section 4.1.1.
Estimated cardiac output was calculated using the Liljestrand technique [31]; estimated total peripheral resistance was calculated using estimated cardiac output. Although the esti-mates were calculated using nurse verified data, there was significant noise in the estiesti-mates- estimates-resulting in marginal utility.
Physiologic Data
Systolic BP Mean BP Diastolic BP
Pulse Pressure CVP Cardiac Output
Heart Rate Temperature Respiratory Rate
Arterial pH Spo2 Lactate WBC Creatinine CPK Troponin
Table 3.1: Clinical variables extracted for each patient. BP, blood pressure; CVP, central venous pressure; Spo2, pulse oximetry oxygen saturation; WBC, white blood cell count; CPK, creatine
phosphokinase
Medications. All medications administered throughout the course of the patient's stay were extracted from the MIMIC II database. Medication information was not used in generating the annotated dataset, but vasopressor/inotrope administration was used in establishing the gold standard for the early warning system (documented in Section 5.2.1).
Fluid administration. All fluids administered throughout the course of the patient's stay were extracted from the MIMIC II database. Fluid information was used to determine if a patient's hypotension persisted despite fluid resuscitation.
3.1.2
Challenges of Manual Annotation
Annotations are currently completed on a case-by-case manner in which expert clinicians manually examine each case and annotate significant clinical findings. Such findings include diseases (adult respiratory distress syndrome, septic shock, hypovolemia, etc.), symptoms (chest pain, diarrhea, etc.), significant medication changes, vital sign changes (tachycardia, hypotension, etc.), waveform abnormalities (arrhythmias), and abnormal laboratory values (CK, ALT, etc.) [32]. Currently annotators have little guidance and must wade through discharge summaries, nursing notes, waveform data, and physiological data to review each case [33]. Consequently, it may take annotators anywhere from 30 minutes to several hours to review a single case.
Generating an annotated dataset for septic shock through the manual review of the 17,000 cases in the MIMIC II database is not feasible. A more plausible option would be to generate a pre-annotated dataset which would guide annotators to specific problems in a particular region of interest-greatly reducing the time required to annotate a single case. Accordingly, a preannotated dataset was generated from the MIMIC II database; methodology is provided in the following sections.
3.2
Automated Pre-Annotation
3.2.1
Pre-Annotation Process
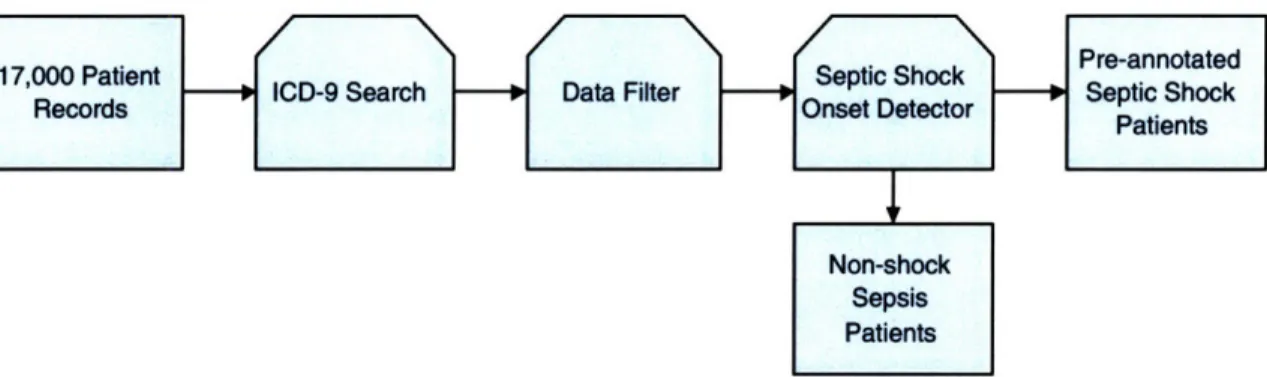
The automated pre-annotation process is a method to identify and pre-annotate septic shock patients from the 17,000 patient MIMIC II database. A schematic of the overall process is shown in Figure 3-1. Initially, all patients with an ICD-9 coding for septic shock are selected. Patients with incomplete or missing data are subsequently removed. Patients with sufficient data for analysis are passed to the septic shock onset detector which generates the pre-annotation. Finally, the pre-annotations are confirmed or rejected by manual review. A breakdown of patient numbers and statistics is given in Section 3.2.3.
Figure 3-1: Schematic of the automated pre-annotation process. Initially, all patients with an ICD-9 coding for septic shock are selected. Patients with incomplete or missing data are removed. Patients with sufficient data for analysis are passed to the septic shock onset detector which generates the
pre-annotation. Finally, the pre-annotations are confirmed or rejected by manual review.
Step 1: ICD-9 Search
The International Classification of Diseases (ICD)-9 was published by the World Health Organization in 1979. The system provides a method of disease classification which is commonly used in hospital reimbursement systems. Clinicians will typically code a patient upon discharge with all disorders he or she experienced while in the unit. The ICD-9 coding for septic shock is 785.52.
The preliminary ICD-9 search provides a prescreening method to identify septic shock patients. However, it should be noted that identifying patients solely based on ICD-9 codings suffers from both poor sensitivity and specificity. Approximately only one quarter of patients identified with septic shock ICD-9 codes actually had septic shock as defined by
the 1991 ACCP / SCCM consensus conference. Furthermore, clinicians can often miss the diagnosis or fail to code the patient resulting in a loss of sensitivity.
Step 2: Data Filter
A data filter was used to ensure all patients had sufficient data for further analysis. The filter required the patient to have at least 10 measured values of systolic blood pressure, heart rate, temperature, and respiratory rate (roughly 10 hours of data); additionally, two white blood cells counts were required. This minimum data requirement corresponds to approximately one day of ICU data (assuming a 12-hour white count interval). The list of required variables was chosen as they are the minimum number necessary to make the diagnosis of septic shock based on the 1991 ACCP / SCCM definition.
Step 3: Septic Shock Onset Detector
The Septic Shock Onset Detector (SSOD) is the core of the automated pre-annotation algorithm. The SSOD has two main functions:
1. Classify the patient into one of the following three categories: a) Non-sepsis
b) Sepsis or severe sepsis without septic shock c) Septic Shock
2. Identify the onset time or transition time from sepsis / severe sepsis to septic shock. The SSOD completes the previous tasks in a two-step process: (1) determine if the patient exhibited the systemic inflammatory response syndrome (SIRS) and (2) if so, does the patient transition into septic shock. The criteria used for SIRS and septic shock are those defined by the 1991 ACCP / SCCM Consensus Conference (Section 2.1.1). Since the patients had ICD-9 codings for septic shock, it was assumed they had a documented or highly suspected source of infection. The 1991 definition was chosen over the 2001 definition based on the ease of implementation.
SIRS. The first step of the SSOD is to determine the time intervals over which the patient exhibited SIRS. SIRS requires abnormalities in at least two of the following four variables: (1) heart rate, (2) temperature, (3) respiratory rate, and (4) white blood cell count (WBC). The following implementation choices were made:
* Abnormal values for the individual variables must exceed 5 hours in order to be considered for the SIRS criteria. For example, if a patient was febrile from hour 1 to hour 3, after which he was afebrile-that interval would not be considered when determining SIRS abnormalities.
* SIRS intervals that were less than 6 hours apart were merged together to form a single interval. For example, if the patient experienced tachycardia and hyperventilation from hours 1 to 14 and then became tachycardic and febrile from hours 18 to 23, the
SIRS interval would be from hours 1 to 23.
* If the first or last measured value for a variable met the SIRS threshold, then the time of abnormality for that variable was taken to be the start or end of the patient record. For example, take the case in which a patient was febrile from hours 1 to 23 but had normal values for heart rate and respiratory rate. The first WBC was taken at hour 6 and was found to exceed the SIRS threshold-then the patient's SIRS interval would start at hour 1 and not hour 6.
Septic shock onset. The second step of the SSOD is to determine if and when the transition to septic shock occurs in the subset of patients whom exhibited sepsis or severe sepsis. The transition or onset of septic shock was defined as sepsis-induced hypotension which persisted longer than 30 minutes. The identification of sepsis-induced hypotension was made using the following process:
1. Find all regions of hypotension (systolic blood pressure < 90 mmHg for > 30 minutes) that occur during a SIRS interval.
2. Calculate fluid input one hour prior to the onset of hypotension to half way through the region of hypotension'. Iterate for all regions of hypotension.
3. If total fluid input is > 600 mL then classify as sepsis-induced hypotension. If multiple regions are found that satisfy this criteria, the first is taken as the onset. Otherwise, the hypotensive region is likely to be responsive to fluid resuscitation and thus not septic shock.
'Calculating fluid input from one hour prior to halfway through the hypotensive region makes the process noncausal. However, causality is irrelevant in retrospective annotation. How this method can be used in a forward, causal manner is outlined in Section 3.2.4
3.2.2
Sample Patient Run
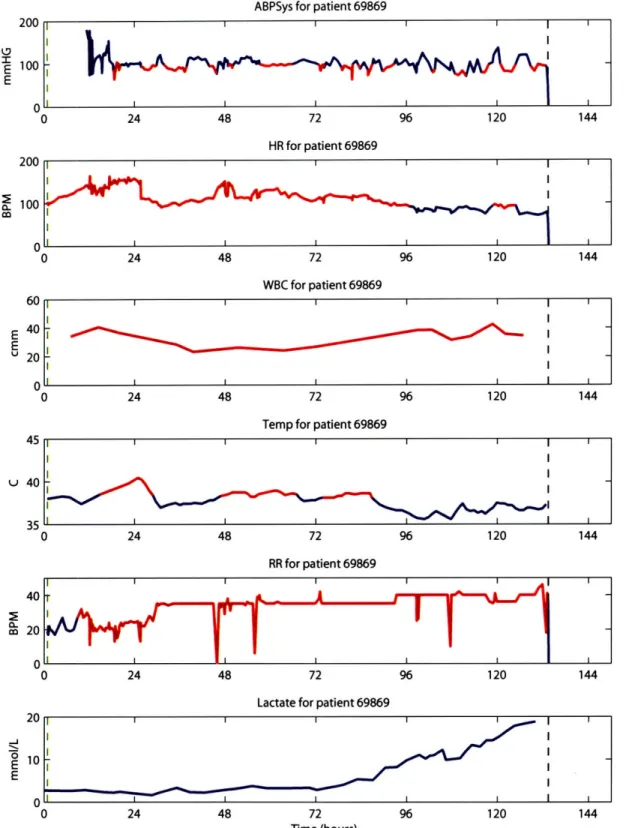
Figures 3-2 and 3-3 show two sample runs of the SSOD on patient data. Heart rate, temperature, respiratory rate, and WBC are used to find the SIRS interval. Systolic blood pressure is used to determine hypotension. Regions of abnormalities are plotted in red. The green vertical line denotes the start of SIRS, whereas the black line denotes the end. The red vertical line indicates the onset of septic shock as determined by the algorithm. Lactate levels are shown as a measure of tissue perfusion.
3.2.3
Baseline Patient Characteristics
The MIMIC II database has a total of 17,082 patient records. 459 patients had an ICD-9 coding for septic shock. Only 261 of the 459 patients had sufficient data for analysis. Out of the 261 patients, 250 exhibited SIRS while in the unit and 65 progressed to septic shock. Baseline patient characteristics are provided in Table 3.2.
3.2.4
Real-time Usage of the SSOD
In order to use the SSOD in a forward, causal manner, the only modification required is the method of calculating fluid input. One potential causal method would be to calculate fluid input one hour prior to the onset of hypotension up to the current time. If the hypotensive episode lasts for at least half an hour and the patient has received greater than a specified fluid input (e.g. > 600 mL), then the hypotension can be considered insensitive to fluid resuscitation. Although this would not provide any early warning, it could raise the concern for a specific etiology the clinician may have overlooked.
3.3
Manual Review
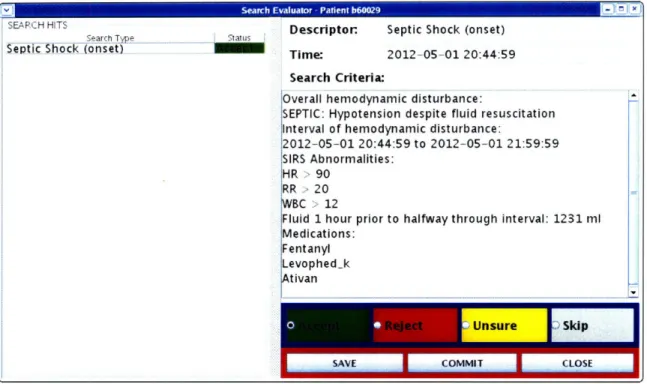
The final step of creating the annotated septic shock dataset requires manual review of the automated pre-annotations. The output of the SSOD was interfaced with the current annotation station to provide reviewers an accessible way to view the pre-annotations and record their decisions [33]. The output interface provides annotators with the interval of hypotension, and associated SIRS abnormalities, fluid input, and medications. A screen shot is provided in Figure 3-4.
ABPSys for patient 69869 24 48 72 96 120 144 HR for patient 69869 200 100
M
24 48 72 96 120 144 WBC for patient 69869 24 48 72 96 120 144Temp for patient 69869
45 I I u 40 35 0 24 48 72 96 120 144 RR for patient 69869 40 m 20 0 24 48 72 96 120 144
Lactate for patient 69869
24 48 72 96 120 144
Time (hours)
Figure 3-2: Sample run of the SSOD on patient 69869. The patient entered the ICU with an elevated heart rate, but was neither febrile nor hyperventilating. The first WBC measurement exceeded the SIRS threshold so the SIRS interval began at the beginning of the patient's stay as denoted by the green vertical line (black line denotes end). He exhibited SIRS through his stay with abnormalities in all four SIRS criteria. The patient became hypotensive throughout his stay (red segments in the ABPSys plot). The patient experienced a 70-minute long hypotensive episode at hour 27 (denoted by vertical red line). He received approximately 1200 mL of fluid but remained hypotensive while on pressors. Thus, this is pre-annotated as the onset of septic shock. The patient's condition continues to worsen, and ultimately he expires on day 6.
200
100
0
ABPSys for patient 63668 24 48 72 96 120 HR for patient 63668 rA 0 24 48 72 96 120 WBC for patient 63668 20 E U 10 0 0 24 48 72 96 120
Temp for patient 63668 40 38 U 36 24 48 72 96 120 RR for patient 63668
Lactate for patient 63668
24 48 72 96 120
Time (hours)
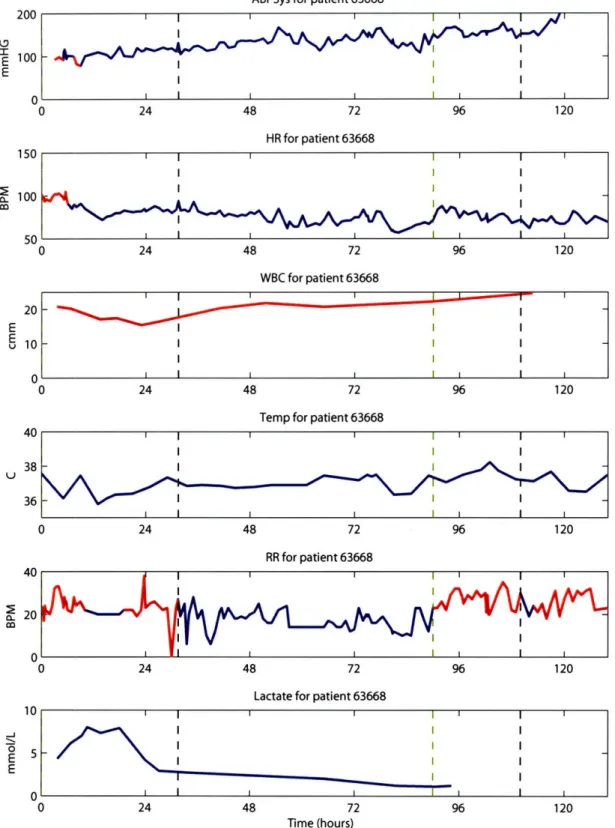
Figure 3-3: Sample run of the SSOD on patient 63668. The patient entered the unit with an elevated heart rate and respiratory rate. White count remained elevated throughout the patient's stay. The first SIRS interval starts upon admittance and lasted for approximately one day. The patient experienced an hour-long hypotensive episode at hour 8 (denoted by the red vertical line); he received nearly 800 mL of fluids but remained hypotensive while on pressors. Thus, this is pre-annotated as the onset of septic shock. However, the patient's condition improved as indicated by the falling lactate levels and rise in blood pressure. The patient experienced another SIRS interval later in his stay-although this episode is unlikely to have been caused by his initial infection.
^•
4
a.2 nn
Sepsis/Severe Sepsis (n = 185) Admit Septic Shock (n = 65) Admit 65 ± 15 (66) 52 (97) Physiological Values SIRS criteria Systolic BP, mmHg HR, beats per min Temperature, OC RR, breathes per min WBC, cells/mm3 Miscellaneous Pulse Pressure, mmHg Arterial pH Spo2, % Total fluids, mL 0-6 hrs 6-24 hrs 0-24 hrs Vasopressors/Inotropes 0-6 hrs, % 6-24 hrs, % 0-24 hrs, % 115 ± 24 (112) 95 ± 20 (95) 36.6 ± 2.8 (36.9) 20 ± 7 (19) 15.0 ± 10.2 (13.9) 57 ± 20 (54) 7.33 ± 0.11 (7.33) 97 ± 6.5 (99) 2298 + 3618 (1102) 3010 ± 2513 (2366) 5200 ± 5065 (3902) 58 (145) 10 (25) 68 (170) 61 ± 17 (64)
60 (39)
105 ± 22 (102) 106 ± 25 (107) 37.1 + 1.2 (36.9) 22 ± 8 (22) 18.1 ± 14.4 (15.1) 47 + 17 (46) 7.30 + 0.11 (7.31) 94 + 12 (97) 2654 ± 2748 (2155) 5445 ± 4704 (4224) 7971 ± 5856 (6115)67 (43)
11 (7) 78 (50) 61 ± 17 (64) 60 (39) 81 ± 7 (82) 104 ± 23 (105) 37.4 + 1.2 (37.4) 23 ± 7 (23) 18.7 ± 16.6 (14.6) 32 ± 10 (35) 7.29 + 0.12 (7.28) 92 ± 14 (97) 2671 ± 1964 (2348) 3791 ± 3090 (2672) 6368 ± 4337 (5171)78 (51)
3 (2) 81 (53) Table 3.2: Baseline patient characteristics for patients with sepsis/severe sepsis and septic shock. Onset time as determined by the septic shock onset detector.SIRS, systemic inflammatory response syndrome; BP, blood pressure; HR, heart rate; RR, respiratory rate; WBC, white blood cell count; Spo2, pulse oximetry oxygen saturation. Vasopressor/Inotropes presented as % of patients started during time interval.
Start time (t = 0) for fluid and medication data is time of admission under admit columns, and onset of septic shock under onset column.
Continuous values presented as mean ± std (median); dichotomous values presented as % (n). Age, yrs
Male sex, %
IN Serc Evluto - aintbO
SEARCH HITS
Search Tp e
Septic Shock (onset)
s Descriptor. Septic Shock (onset)
Time: 2012-05-01 20:44:59
Search Criteria:
Overall hemodynamic disturbance:
SEPTIC: Hypotension despite fluid resuscitation Interval of hemodynamic disturbance:
2012-05-01 20:44:59 to 2012-05-01 21:59:59 SIRS Abnormalities:
HR >90 RR 20
BC > 12
Fluid 1 hour prior to halfway through interval: 1231 ml Medications:
Fentanyl Levophed_k
tivan
Figure 3-4: Screen shot of the manual review interface.
At the current time, only a small fraction of the pre-annotations have been manually reviewed by clinicians. I have sorted through the pre-annotations to eliminate any obvious errors, but subtleties were likely to be missed. Consequently, the annotated septic shock dataset used for generating the early warning system is predominately the dataset of pre-annotations.
3.4
Final Dataset
The final annotated septic shock dataset comprises of 250 patients. 185 of the 250 patients exhibited sepsis or severe sepsis while in the ICU. The remaining 65 progressed to septic shock. Annotations for the septic shock patients include the onset time of shock. Further manual review is required to ensure the hypotension experienced by the septic shock patients was not secondary other causes.
Chapter 4
Constructing the Septic Shock
Early Warning System
This chapter details the construction of the septic shock early warning system (EWS). The EWS is a multivariate logistic regression model designed to differentiate between patients with sepsis and those who progress to septic shock. Six separate EWS models were con-structed using the annotated septic shock dataset discussed in Chapter 3. Performance of the models was evaluated through various discriminatory tests; overall performance amongst the models was nearly identical. Evaluation of the EWS models in a forward, causal manner on a random cohort of patients is provided in Chapter 5.
4.1
Training Dataset
The training dataset used to construct the six EWS models was generated from the an-notated septic shock dataset. The training dataset comprises of two patient types: (1) sepsis/severe sepsis patients who do not progress to septic shock, and (2) septic shock pa-tients. The nonshock sepsis patients were used as the negative group to maximize the model's specificity when run in a forward, causal manner on a random patient population.
Each entry in the training dataset contained the following three pieces of information: 1. The patient's classification (nonshock sepsis or septic shock)
2. Time of interest
4.1.1
Feature Extraction
Reference Time
The time point associated with each patient is used to generate the feature matrix of physiologic values. The reference time for nonshock sepsis patients is a random time sample from the middle of the patient's first SIRS interval; the reference time for septic shock patients is dependent on the classifier. Each classifier is trained using a different reference time-30, 60, 90, 120, 180, or 240 minutes prior to the onset of shock.
Feature Matrix
The feature matrix for the EWS comprised of the following ten physiologic values: (1) systolic blood pressure, (2) pulse pressure, (3) heart rate, (4) temperature, (5) respiratory rate, (6) white blood cell count, (7) arterial pH, (8) SpO2, (9) estimated cardiac output, and (10) estimated total peripheral resistance. Three previous values from the reference time were extracted. Additionally, percent changes from consecutive readings were calculated. Thus, the resultant feature matrix consisted of 50 variables-30 physiologic measurements, and 20 percent changes.
Physiologic values were normalized to a [0,1] range using the maximum and minimum values provided in Table 4.1. Values below or above the thresholds were set to 0 or 1, respectively. This scaling procedure provided a basic data validity check by eliminating implausible physiologic values.
Variable Normalization Range
Systolic Blood Pressure, mmHg 60 - 180
Heart rate, beats per min 50 - 180
Temperature, OC 34 - 40
Respiratory rate, breaths per min 5 - 50
White blood cell count, cells per mm3 0 - 45
Pulse pressure, mmHg 15 - 80
Cardiac output estimatea 15 - 55
Total peripheral resistancea 1 - 7
Arterial pH 7.05 - 7.55
Spo
2, %60- 100
aEstimates could not be calibrated to real values and thus remain unitless
Table 4.1: Normalization ranges for the EWS feature matrix. Physiologic values were normalized to a [0,1] range using the maximum and minimum values provided above. Values below or above the thresholds were set to 0 or 1 respectively.
Patients who did not have sufficient data to generate a full feature matrix were excluded from further analysis. For example, if a patient did not have a white blood cell count or arterial pH measurement prior to the reference time, he or she was eliminated from the training dataset. As a result of the requirement of a full feature matrix, the annotated dataset of 250 patients (185 nonshock versus 65 shock) was reduced to approximately 110 patients. The training dataset varied slightly between models because different reference times were used to build each classifier. The final dataset consisted of approximately 110 patients, with a 60:40 breakdown of nonshock versus shock patients.
4.2
Training the Classifier
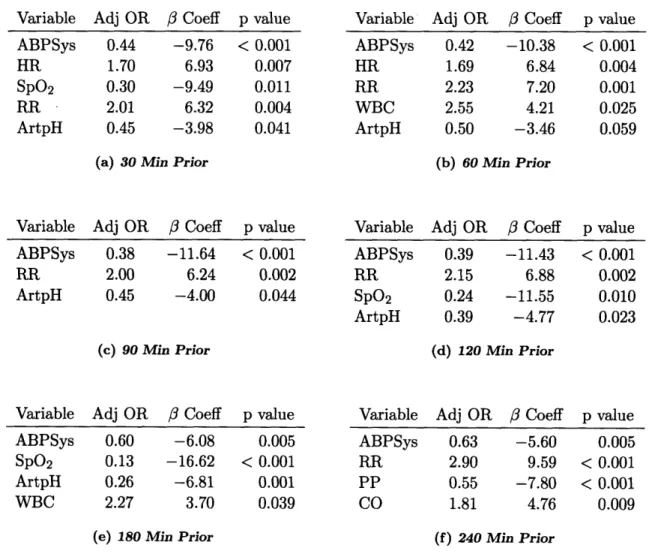
The septic shock EWS is a multivariate logistic regression model. When training the clas-sifier, a greedy forward method was implemented to select the k-best variables from the feature matrix. During the first iteration, univariate regression models were built for each variable. The best classifier, as judged by area under the receiver operating characteristic (ROC) curve, was selected. In subsequent iterations, new variables were added using the same methodology. The process was stopped when improvement in the area under the ROC curve (AUC) was less than 2%. Furthermore, variables were excluded with an exit criteria of p > 0.10.
Six different classifiers were constructed since the reference times for each classifier varied. Six time points prior to the onset of septic shock were used: 30, 60, 90, 120, 180,
and 240 minutes.
4.3
Results
4.3.1 Cross Validation
The classifiers were initially evaluated using a seven-fold cross validation method. As shown in Table 4.2, there is a downward trend in mean AUC as the reference time prior to the onset of shock increases. The single exception is the 120 minute prior classifier which has an AUC nearly equal to that of the 30 minute prior model. Overall performance discrimination using differences in AUCs is not possible as there is substantial overlap in the 95% confidence intervals.
Model AUC Accuracy Sensitivity Specificity 30 Minutes 0.940 ± 0.038 0.864 0.857 0.868 60 Minutes 0.928 ± 0.050 0.872 0.902 0.853 90 Minutes 0.893 + 0.085 0.869 0.821 0.897 120 Minutes 0.936 + 0.053 0.888 0.769 0.956 180 Minutes 0.885 + 0.099 0.858 0.737 0.926 240 Minutes 0.874 + 0.078 0.875 0.861 0.882
Table 4.2: Area under the receiver operating characteristic curve (AUC), accuracy, sensitivity, and specificity for all EWS models. Accuracy, sensitivity, and specificity given for the threshold that maximizes accuracy. AUC presented as mean ± std.
4.3.2
Testing & Training on the Whole Dataset
After the initial cross validation evaluation, models for each reference time point were created using the whole dataset; the models were then tested on the same dataset. Figure 4-1 plots the ROC curves for each of the models. Similar to cross validation evaluation, the curves are essenti

![Table 4.1: Normalization ranges for the EWS feature matrix. Physiologic values were normalized to a [0,1] range using the maximum and minimum values provided above](https://thumb-us.123doks.com/thumbv2/123dok_us/515048.2560734/40.918.231.689.783.1007/table-normalization-feature-physiologic-normalized-maximum-minimum-provided.webp)