Chapman University Chapman University
Chapman University Digital Commons
Chapman University Digital Commons
Mathematics, Physics, and Computer Science
Faculty Articles and Research Science and Technology Faculty Articles and Research 9-30-2020
Forecasting Vegetation Health in the MENA Region by Predicting
Forecasting Vegetation Health in the MENA Region by Predicting
Vegetation Indicators with Machine Learning Models
Vegetation Indicators with Machine Learning Models
Sachi PereraChapman University Wenzhao Li
Chapman University, [email protected] Erik Linstead
Chapman University, [email protected] Hesham el-Askary
Chapman University, [email protected]
Follow this and additional works at: https://digitalcommons.chapman.edu/scs_articles
Part of the Environmental Health and Protection Commons, Environmental Indicators and Impact Assessment Commons, Environmental Monitoring Commons, Other Computer Engineering Commons,
Other Computer Sciences Commons, Other Electrical and Computer Engineering Commons, and the Other Environmental Sciences Commons
Recommended Citation Recommended Citation
S. Perera, W. Li, E. Linstead, and H. El-Askary, “Forecasting vegetation health in the MENA region by predicting vegetation indicators with machine learning models,” 2020 IEEE International Geoscience and Remote Sensing Symposium, Sep. 2020.
This Conference Proceeding is brought to you for free and open access by the Science and Technology Faculty Articles and Research at Chapman University Digital Commons. It has been accepted for inclusion in Mathematics, Physics, and Computer Science Faculty Articles and Research by an authorized administrator of Chapman
Forecasting Vegetation Health in the MENA Region by Predicting Vegetation
Forecasting Vegetation Health in the MENA Region by Predicting Vegetation
Indicators with Machine Learning Models
Indicators with Machine Learning Models
Comments Comments
This paper was presented at the virtual 2020 IEEE International Geoscience and Remote Sensing Symposium in September 2020.
Copyright
IEEEThis conference proceeding is available at Chapman University Digital Commons:
FORECASTING VEGETATION HEALTH IN THE MENA REGION BY PREDICTING
VEGETATION INDICATORS WITH MACHINE LEARNING MODELS
Sachi Perera
1, Wenzhao Li
2, Erik Linstead
3, Hesham El-Askary
,2,4,51Computational and Data Sciences Graduate Program, Schmid College of Science and Technology, Chapman University, Orange, CA 92866, USA
2Schmid College of Science and Technology, Chapman University, Orange, CA 92866, USA 3Fowler School of Engineering, Chapman University, Orange, CA 92866, USA
4Center of Excellence in Earth Systems Modeling & Observations, Chapman University, Orange, CA 92866, USA 5Department of Environmental Sciences, Faculty of Science, Alexandria University, Moharem Bek, Alexandria 21522, Egypt
ABSTRACT
Machine learning (ML) techniques can be applied to predict and monitor drought conditions due to climate change. Predicting future vegetation health indicators (such as EVI, NDVI, and LAI) is one approach to forecast drought events for hotspots (e.g. Middle East and North Africa (MENA) regions). Recently, ML models were implemented to predict EVI values using parameters such as land types, time series, historical vegetation indices, land surface temperature, soil moisture, evapotranspiration etc. In this work, we collected the MODIS atmospherically corrected surface spectral reflectance imagery with multiple vegetation related indices for modeling and evaluation of drought conditions in the MENA region. These models are built by a total of 4556 and 519 normalized samples for training and testing purposes, respectively and with 51820 samples used for model evaluation. Models such as multilinear regression, penalized regression models, support vector regression (SVR), neural network, instance-based learning K-nearest neighbor (KNN) and partial least squares were implemented to predict future values of EVI. The models show effective performance in predicting EVI values (R2> 0.95) in the testing and (R2> 0.93) in the evaluation process.
Index Terms— Machine Learning, Middle East and North Africa, MODIS, EVI
1. INTRODUCTION
The region of the Middle East and North Africa (MENA) is amongst the most arid/semi-arid areas in the world, due to lack of precipitation and high temperature [1]. Similar to other arid/semi-arid regions, the MENA region’s climate has undergone significant changes, becoming increasingly drier over the past 100 years [2]. Therefore, previous study estimated that the arid/semi-arid regions such as MENA would increase in area by about 10% [3]. The vegetation in the MENA is extremely fragile ecological system and sensitive to human activities [4]. In addition, it is also impacted by the global climate variations such as ENSO (El Niño-Southern Oscillation) [5]. Therefore, the vegetation
indices such as Normalized Difference Vegetation Index (NDVI) and Enhanced Vegetation Index (EVI) are used to study the response of its changes to such environmental changes [6]. The short-term changes of vegetation health indicated by EVI can be forecasted by the gradient-boosted machine learning models using remotely sensed datasets (e.g. Moderate Resolution Imaging Spectroradiometer - MODIS), as it was applied in the agriculture areas of Sri Lanka and California [7]. This study focuses on the assessment of the vegetation health situation through predicting EVI values in the MENA region using multiple machine learning models.
2. DATA AND METHOD 2.1. Data
The Enhanced Vegetation Index (EVI) is represented as:
EVI = 𝐺𝐺 𝐵𝐵𝑁𝑁𝑁𝑁𝑁𝑁−𝐵𝐵𝑟𝑟𝑟𝑟𝑟𝑟
𝐵𝐵𝑁𝑁𝑁𝑁𝑁𝑁+𝐶𝐶1×𝐵𝐵𝑟𝑟𝑟𝑟𝑟𝑟−𝐶𝐶2×𝐵𝐵𝑏𝑏𝑏𝑏𝑏𝑏𝑟𝑟+𝐿𝐿 (1)
Where the 𝐵𝐵𝑁𝑁𝑁𝑁𝑁𝑁, 𝐵𝐵𝑟𝑟𝑟𝑟𝑟𝑟 and 𝐵𝐵𝑏𝑏𝑏𝑏𝑏𝑏𝑟𝑟 are the atmospherically
corrected bands of surface reflectances in the near-infrared, red and blue lights, respectively. The G is the coefficient of the gain factor. 𝐶𝐶1 and 𝐶𝐶2 are the coefficients of the aerosol
resistance term while the L is the adjustment value to the canopy background variations (Huete et al. 2002). Here we use the MOD13A1 V6 Vegetation Index (VI) products with two bands NDVI and EVI at a per pixel basis with 16-day composite at 500m resolution. The products are produced from atmospherically corrected bi-directional surface reflectances that have been masked for water, clouds, heavy aerosols, and cloud shadows. A quality layer (DetailedQA) is used to exclude the pixels in cloudy conditions. MODIS V6 data used in this study consists of globally collected day-to-day data. The availability of MODIS data in real time make analysis more efficient. MODIS data has moderate spatial resolution and good temporal resolution compared to extreme resolution products such as Landsat (high spatial resolution and low temporal resolution) and AVHRR (low spatial resolution and good temporal resolution). Good temporal resolution of MODIS data produces more reliable outcomes. At present, MODIS V6 has gained more attention of
researches and successfully used in the field of ecosystem, climate modelling and natural resource management studies.
In this paper, we used MOD09A1 V6 product including the surface spectral reflectance (SSR) values of Terra MODIS bands 1-7 at 500m resolution, where each pixel value is selected from all the acquisitions within the 8-day composite. The data is atmospherically corrected for the conditions such as aerosols and Rayleigh scattering. A quality layer (StateQA) is also used to filter out the pixels in cloudy conditions for the best modeling performance. Besides, the MCD15A3H V6 4-day composite product including the bands of Fraction of Photosynthetically Active Radiation (FPAR), and Leaf Area Index (LAI) is also used in the modeling process. The 500m resolution product chooses the selected pixel from both MODIS Terra and Aqua sensors within 4-days period. Similar to the vegetation and surface reflectance products, the band FparLai_QC is also used for the quality control purpose.
2.1. Methods
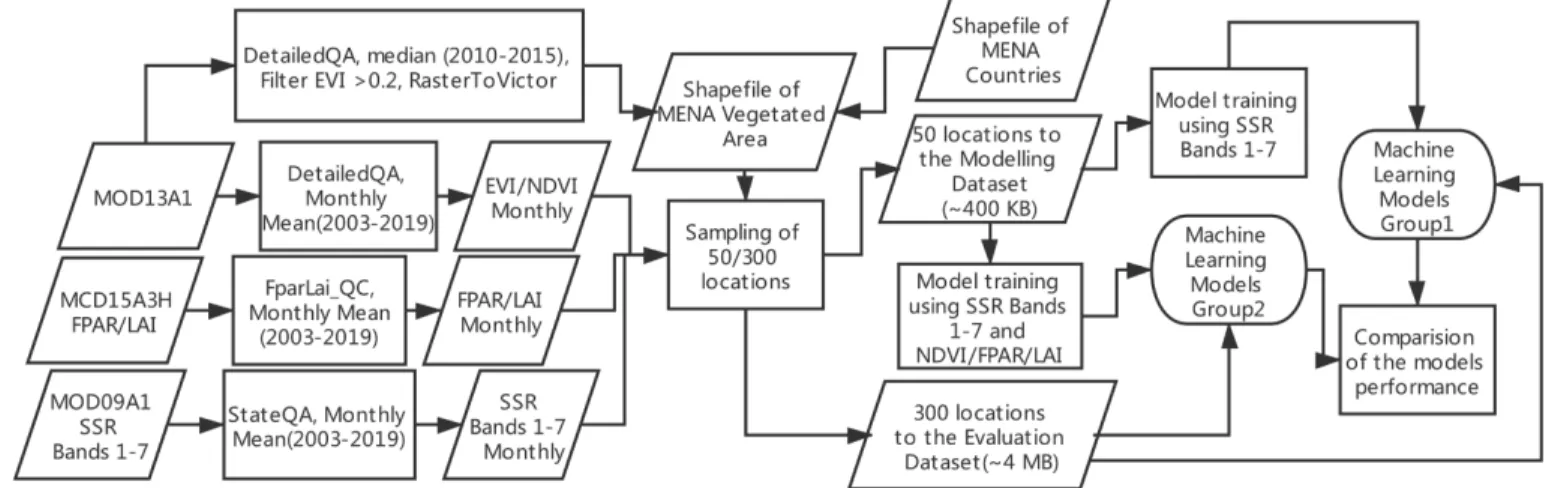
The workflow of the study is presented in the Figure 1. The multi-year median EVI value from the year 2010 to 2015 is calculated and regions with EVI> 0.2 is converted to the shapefile in the MENA countries. Within the shapefile 50/300 locations are selected (Figure 2) to sample the monthly EVI, NDVI, FPAR, LAI and SSR values.
The dataset retrieved from 50 locations (~400KB) is used for the model training and testing. Two groups of the models are generated: 1) Group-1 only uses SSR Bands 1-7 as training input; 2) Group-2 adds the NDVI/FPAR/LAI as the training input. The other dataset retrieved from 300 locations (~ 4MB) is used for the model evaluation for the two groups of the models. The model algorithms include: Multiple Regression using ordinary least squares (OLS) and partial least square (PLS), Penalized Regression (Ridge & Lasso), Support Vector Machine Regression (SVM), k-nearest neighbors (KNN) for regression and Neural Network. The optimized model parameters for SVM, PLS and Neural Network are obtained from the GridSearchCV.fit() method through the sklearn.model_selection package. The models
are evaluated by the Coefficient of determination (R2) and mean squared error (MSE). The scatterplots between predicted EVI and actual EVI values are plotted with kernel density estimation to estimate the probability density function (PDF) using the method from gaussian_kde from the scipy.stats python package. The PDF of a Gaussian random variable with mean μ and standard deviation𝜎𝜎:
f(x) = 𝜎𝜎√2𝜋𝜋1 𝑒𝑒−(𝑥𝑥−𝜇𝜇2𝜎𝜎2)2 (2)
where the f(x) value could be arbitrarily large when the 𝑥𝑥 − 𝜇𝜇 is closer to zero and standard deviation 𝜎𝜎 is very small.
3. RESULTS
The modelling dataset is randomly split into training set (4665 items) and testing set (519 items). In addition, the
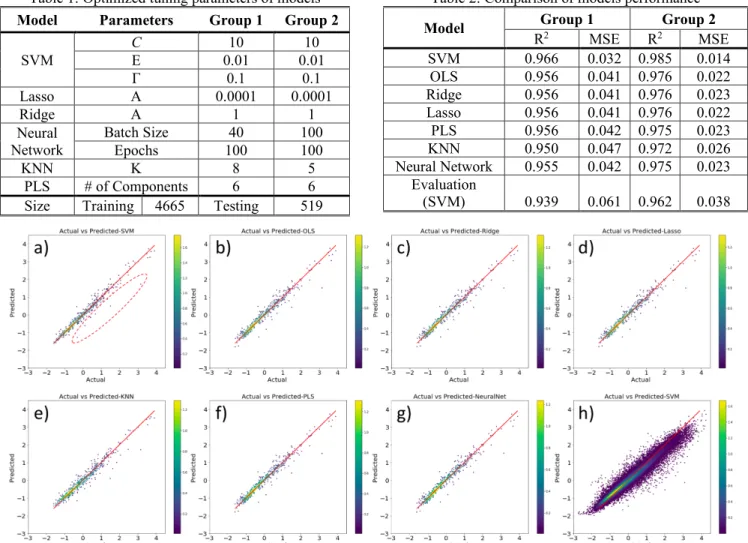
optimized parameters for each model from the training dataset Group-1 and Group-2 is demonstrated in Table 1. The MSE and R2 for each model in the two groups are listed in the Table 2. The SVM model achieves the best performance in both group thus it is used to evaluate the best model’s performance to predict the EVI in the MENA region. Figure 1: The workflow diagram of the study
Figure 2: The sampling locations of the MENA vegetated area (EVI >0.2 indicated by the green background), including the first group of 50 locations (red dots) and second group of 300 locations (black dots).
Table 1: Optimized tuning parameters of models
Model Parameters Group 1 Group 2
SVM C Ε 0.01 10 0.01 10
Γ 0.1 0.1
Lasso Α 0.0001 0.0001
Ridge Α 1 1
Neural
Network Batch Size Epochs 100 40 100 100
KNN K 8 5
PLS # of Components 6 6
Size Training 4665 Testing 519
Table 2: Comparison of models performance
Model RGroup 1 2 MSE R2Group 2 MSE
SVM 0.966 0.032 0.985 0.014 OLS 0.956 0.041 0.976 0.022 Ridge 0.956 0.041 0.976 0.023 Lasso 0.956 0.041 0.976 0.022 PLS 0.956 0.042 0.975 0.023 KNN 0.950 0.047 0.972 0.026 Neural Network 0.955 0.042 0.975 0.023 Evaluation (SVM) 0.939 0.061 0.962 0.038
Figure 3: The scatterplot of predicted and actual EVI values of each model from Group 1 with color indicating PDF, as well as identity line (red lines).
Figure 4: The scatterplot of predicted and actual EVI values of each model from Group 2 with color indicating PDF, as well as identity line (red lines).
Generally, the inclusion of NDVI, LAI and FPAR has contributed to the model performance, as the R2 values increase from 0.939 to 0.962, as well as MSE decrease from 0.061 to 0.038 in the evaluation process using SVM. In addition, the deviated points in the circled region in the Fig. 3a have moved closer to the identity line in the Fig. 4a. Figure 4h also shows the convergence of the points compared to Fig. 3h, while the region with higher PDF values (yellow to green) is also more situated in the identity lines. This is due to smaller standard deviation 𝜎𝜎 values as it is described in the equation (2).
4. DISCUSSION
The study found that the EVI values can be effectively estimated using only SSR Band 1-7 value as mode inputs. It is because the training and testing datasets is carefully selected with quality assurance and have been monthly averaged. It is also due to vegetated regions of MENA is characterized as low biomass regions. However, the EVI is designed to enhance the vegetation detection with improved sensitivity in the high biomass regions. Therefore, the advantages of using EVI do not outstand comparing to other VI such as NDVI. However, the inclusion of other biophysical parameters (LAI and FPAR) also helps to further improve the model performance up to 0.985 and 0.962 of R2 values in the testing and evaluation processes, respectively. In addition, the efforts such as adding penalties (Lasso, Ridge), and regularization in the Neural Network exempt the potential of model overfitting. It confirms the results from previous studies showing the EVI highly correlated with the LAI [8, 9] and linearly related to FPAR [10]. To increase the forecasting performance, high resolution datasets with additional parameters such as natural and human factors can be used. [7]. For instance, environmental factors, atmospheric conditions, soil moisture and Agri management principles which influences EVI could improve predictive performance of the machine learning models. Additionally, MODIS BRDF corrected products such as MCD43 and the Multi-Angle Implementation of Atmospheric Correction algorithm
(MAIAC) will be used in future work. Previous studies have
found that EVI is highly sensitive to the bidirectional effect and it is necessary to use BRDF corrected products in vegetation analysis [12]. The workflow of the data acquirement (Google Earth Engine: https://code.earthengine.google.com/b5e37e0c9eda7ea8911f
40aa031122d4) and model training (Google Colab: https://colab.research.google.com/drive/1sfcnXrfLqZLuE2Y sJtQtwZAdh8QoHxsJ) is fully deployed on the cloud services. It can be easily modified and applied to the other researches.
5. CONCLUSION
Initially models were built to predict EVI-2018 using surface reflectance data only. After adding more predictors such as EVI-2017, NDVI, FPAR and LAI model predictive power is
increased up to 96% of 𝑅𝑅2 value with lower MSE, which
concludes that these parameters have high impact on EVI. Model predicted EVI is very highly correlated with actual EVI, as most of the points are closed to the line except with some deviations at the higher values. Regression models, OLS and Partial least squares has almost the same 𝑅𝑅2.
Nevertheless, Penalized method such as Ridge and Lasso are preferred over OLS since they can handle the issues with overfitting and can generate sparse solutions. Lasso model can be used as dimension reduction techniques as it generates sparse solutions. Since there are some bands with zero weights, those bands can be eliminated from the data. In order to increase the model performance of Neural networks regularization techniques can be applied. It is assumed that low predictive performance for extreme EVI values in MENA region may be attributed due to high levels of atmospheric noise.
6. REFERENCES
[1] M. Hulme, “Recent Climatic Change in the World’s Drylands,”
Geophysical Research Letters, vol. 23, no. 1, pp. 61–64, Jan. 1996.
[2] G. T. Narisma, J. A. Foley, R. Licker, and N. Ramankutty, “Abrupt
changes in rainfall during the twentieth century,” Geophysical
Research Letters, vol. 34, no. 6, Mar. 2007.
[3] S. Feng and Q. Fu, “Expansion of global drylands under a warming
climate,” Atmospheric Chemistry and Physics, vol. 13, no. 19, pp. 10081–10094, Oct. 2013.
[4] S. C. Reed, K. K. Coe, J. P. Sparks, D. C. Housman, T. J. Zelikova,
and J. Belnap, “Changes to dryland rainfall result in rapid moss mortality and altered soil fertility,” Nature Climate Change, vol. 2, no. 10, pp. 752–755, Oct. 2012.
[5] W. Li, H. M. El-Askary, M. Qurban, M. Allali, and K. P.
Manikandan, “On the Drying Trends Over the MENA Countries Using Harmonic Analysis of the Enhanced Vegetation Index,” in
Advances in Remote Sensing and Geo Informatics Applications, H. M. El-Askary, S. Lee, E. Heggy, and B. Pradhan, Eds. Cham: Springer International Publishing, 2019, pp. 243–245.
[6] Hui Qing Liu and A. Huete, “A feedback based modification of the
NDVI to minimize canopy background and atmospheric noise,”
IEEE Transactions on Geoscience and Remote Sensing, vol. 33, no. 2, pp. 457–465, Mar. 1995.
[7] J. Nay, E. Burchfield, and J. Gilligan, “A machine-learning approach
to forecasting remotely sensed vegetation health,” International
Journal of Remote Sensing, vol. 39, no. 6, pp. 1800–1816, Mar. 2018.
[8] S.R. Kim, A.K. Prasad, H. El-Askary, W.K. Lee, D.A. Kwak, S.H.
Lee, M. Kafatos,” Application of the Savitzky-Golay filter to land cover classification using temporal MODIS vegetation indices,”
Photogramm. Eng. Remote Sens, vol. 80, pp. 675-685, 2014.
[9] T. Sakamoto, M. Yokozawa, H. Toritani, M. Shibayama, N.
Ishitsuka, and H. Ohno, “A crop phenology detection method using time-series MODIS data,” Remote Sensing of Environment, vol. 96, no. 3–4, pp. 366–374, Jun. 2005.
[10] D. A. Huete, K. Didan, T. Miura, E. P. Rodriguez, X. Gao, and L. G. Ferreira, “Overview of the radiometric and biophysical performance of the MODIS vegetation indices,” Remote Sensing of Environment, vol. 83, no. 1–2, pp. 195–213, Nov. 2002.
[11] C. Small and C. Milesi, “Multi-scale standardized spectral mixture
models,” Remote Sensing of Environment, vol. 136, pp. 442–454,
Sep. 2013.
[12] C. A. Petri, L. S. Galvao. “Sensitivity of Seven MODIS Vegetation Indices to BRDF Effects during the Amazonian Dry Season”, Remote sensing, 11, no. 14: 1650, Jul. 2019.