University of Central Florida University of Central Florida
STARS
STARS
Electronic Theses and Dissertations, 2004-20192017
Analysis of Pedestrian Safety Using Micro-simulation and Driving
Analysis of Pedestrian Safety Using Micro-simulation and Driving
Simulator
Simulator
Jiawei WuUniversity of Central Florida
Part of the Civil Engineering Commons
Find similar works at: https://stars.library.ucf.edu/etd University of Central Florida Libraries http://library.ucf.edu
This Doctoral Dissertation (Open Access) is brought to you for free and open access by STARS. It has been accepted for inclusion in Electronic Theses and Dissertations, 2004-2019 by an authorized administrator of STARS. For more information, please contact [email protected].
STARS Citation STARS Citation
Wu, Jiawei, "Analysis of Pedestrian Safety Using Micro-simulation and Driving Simulator" (2017). Electronic Theses and Dissertations, 2004-2019. 5508.
ANAYLSIS OF PEDESTRIAN SAFETY USING MICRO-SIMULATION
AND DRIVING SIMULATOR
by
JIAWEI WU
B.S. Beijing Jiaotong University, 2012
M.S. University of Central Florida, 2014
A dissertation submitted in partial fulfillment of the requirements for the degree of Doctor of Philosophy
in the Department of Civil, Environmental and Construction Engineering in the College of Engineering and Computer Science
at the University of Central Florida Orlando, Florida
Summer Term 2017
ii ABSTRACT
In recent years, traffic agencies have begun to place emphasis on the importance of pedestrian safety. In the United States, nearly 70,000 pedestrians were reported injured in 2015. Although the number only account for 3% of all the people injured in traffic crashes, the number of pedestrian fatalities is still around 15% of total traffic fatalities. Furthermore, the state of Florida has consistently ranked as one of the worst states in terms of pedestrian crashes, injuries and fatalities. Therefore, it is befitting to focus on the pedestrian safety. This dissertation mainly focused on pedestrian safety at both midblock crossings and intersections by using micro-simulation and driving simulator.
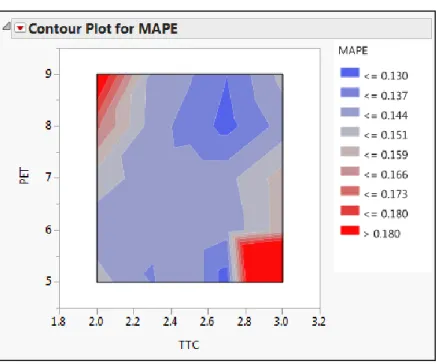
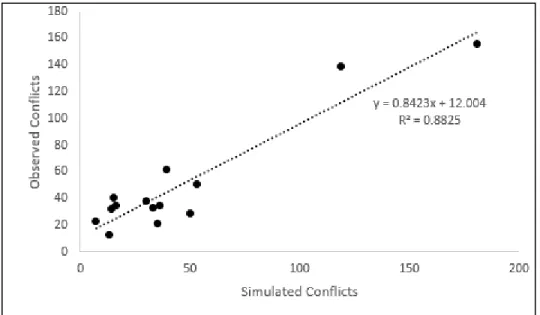
First, this study examined if the micro-simulation models (VISSIM and SSAM) could estimate pedestrian-vehicle conflicts at signalized intersections. A total of 42 video-hours were recorded at seven signalized intersections for field data collection. The observed conflicts from the field were used to calibrate VISSIM and replicate the conflicts. The calibrated and validated VISSIM model generated the pedestrian-vehicle conflicts from SSAM software using the vehicle trajectory data in VISSIM. The mean absolute percent error (MAPE) was used to determine the optimum TTC and PET thresholds for pedestrian-vehicle conflicts and linear regression analysis was used to study the correlation between the observed and simulated conflicts at the established thresholds. The results indicated the highest correlation between the simulated and observed conflicts when the TTC parameter was set at 2.7 and the PET was set at 8.
Second, the driving simulator experiment was designed to assess pedestrian safety under different potential risk factors at both midblock crossings and intersections. Four potential risk factors were selected and 67 subjects participated in this experiment. In order to analyze pedestrian safety, the surrogate safety measures were examined to evaluate these pedestrian-vehicle conflicts.
iii
Third, by using the driving simulator data from the midblock crossing scenario, typical examples of drivers’ deceleration rate and the distance to crosswalk were summarized, which exhibited a clear drivers’ avoidance pattern during the vehicle pedestrian conflicts. This pattern was summarized into four stages, including the brake response stage, the deceleration adjustment stage, the maximum deceleration stage, and the brake release stage. In addition, the pedestrian-vehicle conflict prediction model was built to predict the minimum distance between vehicle and pedestrian.
Finally, this study summarized the three different kinds of data that were to evaluate the pedestrian safety, including field data, simulation data, and driving simulator data. The process of combining of field data, simulation data, and simulator data was proposed. The process would show how the researches could evaluate the pedestrian safety by using the field observations, micro-simulation, and driving simulator.
iv
To my parents
Ruiming Wu and Jingli Bai
Who encourage me to realize my dream
To my wife, Wen
And my daughter, Ariella
v
ACKNOWLEDGMENTS
I would first sincerely express my gratitude to my advisor Dr. Essam Radwan. His support and guidance contributed greatly to the success of this work. What I learned from him during my Ph.D period is not only the special knowledge about transportation system, but also spirits of seriousness, honesty, modesty, and confidence as a dependent researcher.
I would like to thank my committee members, Dr. Essam Radwan, Dr. Mohammed Abdel-Aty, Dr. Hatem Abou-Senna, and Dr. Liqiang Ni for serving in my committee and for providing me with excellent course instructions and guidance.
In addition, I would like to thank my previous advisor, who is Dr. Xuedong Yan in China, for guiding me through emails and phones and encouraging me along the way.
Finally, thanks to my wife for her support to my whole graduate study. Without her encouragement, I cannot image the difficulty in finishing the Ph.D in transportation field.
vi
TABLE OF CONTENTS
LIST OF FIGURES ... xi
LIST OF TABLES ... xiii
CHAPTER ONE: INTRODUCTION ... 1
1.1 Background ... 1
1.2 Research Approaches ... 3
1.3 Research Objectives ... 4
1.4 Proposal Organization ... 5
CHAPTER TWO: LITERATURE REVIEW ... 6
2.1 Safety Issues Related to Pedestrian Crashes ... 6
2.1.1 National Pedestrian Safety Reports ... 6
2.1.2 Statewide and Local Pedestrian Safety Reports... 8
2.2 Risk Factors Related to Pedestrian Crashes ... 11
2.2.1 Environmental Factors ... 11
2.2.2 Roadway Characteristics Factors ... 13
2.2.3 Human Factors ... 14
2.2.4 Vehicle Characteristic Factors ... 16
2.2.5 Location Factors... 17
2.3 Simulation and Simulator Study Related to Pedestrian Safety ... 18
vii
2.3.2 Cellular Automata Micro Simulation... 20
2.3.3 Driving Simulator ... 21
2.4 Driving Simulator Issues... 22
2.4.1 Advantages and Disadvantages of Driving Simulator Research ... 22
2.4.2 UCF Driving Simulator... 23
CHAPTER THREE: MICRO-SIMULATION APPLICATION TO PEDESTRIAN-VEHICLE CONFLICTS ... 25
3.1 Field Data Collection ... 25
3.1.1 Experimental Sites ... 25
3.1.2 Data Collection Procedures ... 26
3.1.3 Data Description ... 29
3.2 Calibrated and Validated VISSIM Model... 32
3.3 Surrogate Safety Assessment Model (SSAM) Calibration ... 34
3.4 Relationship between Simulated Conflicts and Observed Conflicts ... 39
CHAPTER FOUR: DRIVING SIMULATOR EXPERIMENT METHODOLOGY FOR ESTIMATING PEDESTRIAN SAFETY... 42
4.1 Midblock Crossing Experimental Design ... 42
4.1.1 Factors Description ... 42
4.1.2 Experimental Design ... 44
viii 4.2.1 Factors Description ... 46 4.2.2 Experimental Design ... 47 4.3 Subjects ... 48 4.4 Experiment Procedure ... 49 4.5 Data Collection ... 50
4.5.1 Simulator Data Collection Procedure ... 50
4.5.2 Midblock Crossing Scenario Data Collection... 50
4.5.3 Intersection Scenario Data Collection ... 51
CHAPTER FIVE: DRIVING SIMULATOR EXPERIMENT RESULTS AND DATA ANALYSES ... 53
5.1 Midblock Crossing Scenario Data Analyses... 53
5.1.1 Maximum Deceleration ... 53
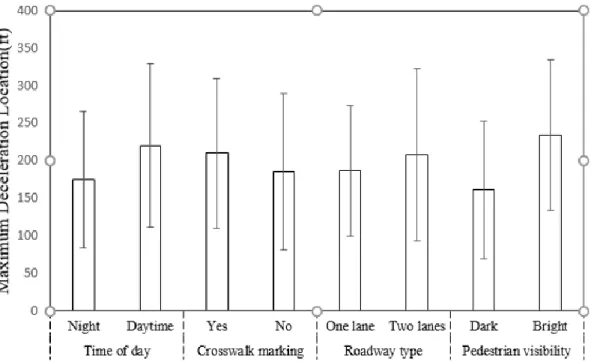
5.1.2 Maximum Deceleration Location ... 57
5.1.3 Minimum Distance... 62
5.1.4 Post encroachment time ... 64
5.1.5 Minimum TTC ... 67
5.2 Intersection Scenario Data Analyses ... 73
5.2.1 Entrance Speed... 73
5.2.2 Minimum Distance... 74
ix
5.2.4 Minimum TTC ... 79
CHAPTER SIX: DRIVER’S AVOIDANCE PATTERN AND PEDESTRIAN-VEHICLE CONFLICTS MODEL... 82
6.1 Driver’s avoidance pattern ... 82
6.2 Driver’s behavior analysis ... 85
6.2.1 Deceleration adjustment time (t2) ... 85
6.2.2 Maximum deceleration time (t3) and maximum deceleration rate (dm) ... 87
6.2.3 Brake Release Time (t4) ... 90
6.3 Pedestrian-vehicle conflict prediction model ... 91
CHAPTER SEVEN: THE PROCESS OF PEDESTRIAN SAFETY EVALUATION BY USING FIELD DATA, MICRO-SIMULATION DATA AND DRIVING SIMULATOR DATA ... 98
7.1 Field data collection for pedestrian safety ... 98
7.2 Micro-simulation data collection for pedestrian safety ... 99
7.3 Driving simulator data collection for pedestrian safety ... 100
7.4 Comparison of TTC and PET for Field Data, Simulation Data, and Driving Simulator Data ... 100
7.5 The process of pedestrian safety evaluation ... 101
CHAPTER EIGHT: SUMMARY... 104
8.1 Micro-simulation application to pedestrian-vehicle conflicts ... 104
8.2 Assessment of pedestrian-vehicle conflicts at midblock crossings based on driving simulator experiment... 105
x
8.3 Assessment of pedestrian-vehicle conflicts at signalized intersections with a concurrent
pedestrian phasing based on driving simulator experiment ... 107
8.4 Driver’s avoidance pattern and pedestrian-vehicle conflicts prediction model ... 107
8.5 Summary of the process of the pedestrian safety evaluation ... 109
APPENDIX A: IRB APPROVAL LETTER ... 110
APPENDIX B: DRIVING SIMULATOR SURVEY ... 113
APPENDIX C: R PROGRAM TO PROCESS EXPERIMENT DATA ... 117
APPENDIX D: PRESENTATION AND PUBLICATION ... 126
xi
LIST OF FIGURES
Figure 1 :UCF driving simulator... 24
Figure 2: The pedestrian-vehicle conflict types observed in the field ... 29
Figure 3: VISSIM simulation model for Sand Lake Rd & I-Drive ... 34
Figure 4: Contour plot for MAPE value with different TTC and PET threshold ... 38
Figure 5: Relationship between simulated conflicts and observed conflicts ... 40
Figure 6: The midblock crossing scenario design for pedestrian-vehicle conflict ... 45
Figure 7: The intersection scenario design for pedestrian-vehicle conflict ... 48
Figure 8: Comparison of maximum deceleration location of time of day, crosswalk marking, roadway type, and pedestrian visibility for the midblock crossings scenario ... 60
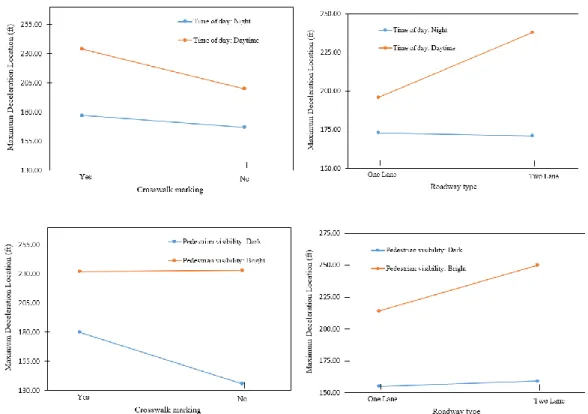
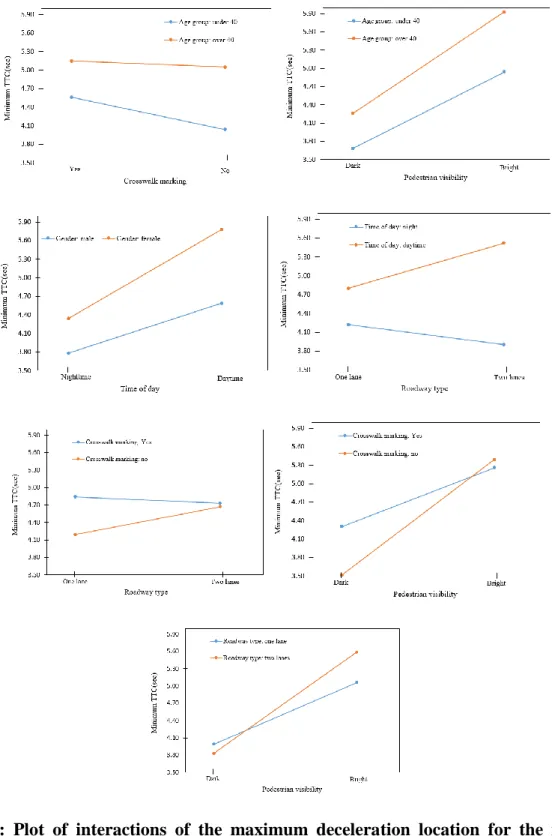
Figure 9: Plot of interactions of the maximum deceleration location for the midblock crossings scenario ... 62
Figure 10: Plot of interactions of the maximum deceleration location for the midblock crossings scenario ... 72
Figure 11: Distribution of entrance speed for the intersection scenario ... 73
Figure 12: Interaction effect of pedestrian visibility on time of day for the minimum distance .. 76
Figure 13: Plot of interactions between vehicle movement and pedestrian movement of the minimum TTC for intersection scenario ... 81
Figure 14: Drivers’ deceleration rate and the distance to crosswalk during the avoidance period ... 83
Figure 15: Drivers’ avoidance pattern during the pedestrian-vehicle conflict ... 83
Figure 16: Relationship between deceleration adjustment time and significant factors ... 87
xii
Figure 18: Relationship between the minimum distance and age, gender ... 94
Figure 19: Relationship between the minimum distance and color ... 95
Figure 20: The relationship between the experiment data and the prediction results ... 97
xiii
LIST OF TABLES
Table 1: List of seven test intersections ... 26
Table 2: The data collection schedule ... 27
Table 3: Summary of pedestrian crossings at intersections ... 30
Table 4: Descriptive statistical results of pedestrian crossing behavior at intersections ... 31
Table 5: Descriptive statistical results of pedestrian crossing behavior at intersections ... 32
Table 6: MAPE with different maximum TTC and PET thresholds ... 38
Table 7: The number of simulated conflicts and observed conflicts ... 39
Table 8: List of factors used in the midblock crossing scenario ... 44
Table 9: List of factors used in the intersection scenario ... 47
Table 10: The ideal number of participants recruited in the formal experiment ... 49
Table 11: Descriptive statistics of the maximum deceleration for the midblock crossings scenario ... 55
Table 12: Summary of the mixed model of the maximum deceleration for the midblock crossings scenario ... 56
Table 13: Descriptive statistics of the maximum deceleration location for the midblock crossings scenario ... 58
Table 14: Summary of the mixed model of the maximum deceleration location for the midblock crossings scenario ... 59
Table 15: Summary of the interaction effects of the maximum deceleration location for the midblock crossings scenario ... 61
xiv
Table 17: Summary of the mixed model of the minimum distance for the midblock crossings
scenario ... 64
Table 18: Descriptive statistics of PET for the midblock crossings scenario ... 66
Table 19: Summary of the mixed model of PET for the midblock crossings scenario ... 66
Table 20: Descriptive statistics of TTC for the midblock crossings scenario ... 68
Table 21: Summary of the mixed model of the minimum TTC for the midblock crossings scenario ... 69
Table 22: Summary of the interaction effects of the mixed model for the minimum TTC for the midblock crossings scenario ... 70
Table 23: Descriptive statistics of the minimum distance for the intersection scenario ... 74
Table 24: Summary of the mixed model of the minimum distance for the intersection scenario 76 Table 25: Descriptive statistics of PET for the intersection scenario ... 78
Table 26: Summary of the mixed model of PET for the intersection scenario ... 78
Table 27: Descriptive statistics of the minimum TTC for the intersection scenario ... 79
Table 28: Summary of the mixed model of the minimum TTC for the intersection scenario ... 80
Table 29: Analysis of variance (ANOVA) results of deceleration adjustment time (t2) ... 86
Table 30: Descriptive statistics of six factors related to the t3 and dm ... 89
Table 31: Analysis of variance (ANOVA) results of maximum deceleration time (t3) and maximum deceleration rate (dm) ... 90
Table 32: Analysis of variance (ANOVA) results of deceleration adjustment time (t4) ... 91
Table 33: Linear regression results between dependent variable and independent variables ... 93
Table 34: Comparison of the minimum distance from the experiment data and model results ... 97
xv
Table 36: Comparison of TTC and PET of Field Data, Simulation Data, and Driving Simulator Data ... 101
1
CHAPTER ONE: INTRODUCTION
1.1 Background
In recent years, traffic agencies have begun to place emphasis on the importance of pedestrian safety. Between 2006 and 2009, pedestrian fatalities in the United States declined from 4795 to 4109. However, the downward trend had halted and there were 4302 pedestrian deaths in 2010, increasing to 4457 in 2011 and 4743 in 2012 (Williams, 2013). Meanwhile, nearly 76,000 pedestrians were reported injured in 2012. Although the number only accounts for 3% percent of all the people injured in traffic crashes, the number of pedestrian fatalities is still around 14% of total traffic fatalities (National Highway Traffic Safety Administration, 2014). Furthermore, the state of Florida has consistently ranked as one of the worst states in terms of pedestrian crashes, injuries and fatalities (National Highway Traffic Safety Administration, 2012). Ernst (2011) also indicated that four metro areas in Florida (Orlando-Kissimmee, Tampa-St. Petersburg-Clearwater, Jacksonville, Miami-Fort Lauderdale-Pompano) were considered the most dangerous for pedestrians among all the United States. Therefore, pedestrian safety is of particular concern to Florida.
In order to better understand the causation of pedestrian crashes, some researchers have tried to assess pedestrian safety by using the field crash data, which is the traditional and frequent method (Haleem et al., 2015; Zhang et al., 2008; Jarrett and Saul, 1998; Lefler and Gabler, 2004). However, it often takes years to collect sufficient crash data to support statistically valid analyses, particularly
2
for locations with infrequent crash events. In addition, the lack of complete reporting of pedestrian crashes also resulted in much smaller population of data to use. Therefore, traffic conflict analyses provided an alternative to investigate safety and develop prediction models for cases where crashes are infrequent (Zhang et al., 2014; Zhang et al., 2012; Alomodfer et al., 2015). A traffic conflict is defined as an event involving two or more road users, in which the action of one user causes the other user to make an evasive maneuver to avoid a collision (Parker and Zegger, 1989). Conflict analysis can be significant for evaluating roadway design alternatives, pedestrian safety, traffic signal control, freeway management options, and other designs that have not been widely implemented. However, there is little previous work that has developed prediction models for pedestrian conflicts. The micro-simulation model may be used to estimate the number of potential conflicts for alternative designs and permit the development of safety prediction models. The work completed thus far indicates that this approach is a valid surrogate measure to estimate safety and a promising method for predicting crashes (Gettman et al., 2008; Fan et al., 2013). However, there is no published literature that document the use of this method to assess the pedestrian crashes. Moreover, a driving simulator is also one of the effective tools that can also be used to identify pedestrian-vehicle conflicts and evaluate the pedestrian safety. In this dissertation, the purpose is to use both micro-simulation model and driving simulator to develop the pedestrian-vehicle conflict model and analyze the pedestrian safety.
3
1.2 Research Approaches
Firstly, a literature review of relevant domain information was conducted, including pedestrian safety issues, risk factors that related to pedestrian crashes, and simulation and simulator studies related to pedestrian safety.
Secondly, VISSIM and SSAM were used to estimate the number of potential conflicts between pedestrians and vehicles. In addition, several sites were selected to collect data from the field for the purpose of calibrating and validating VISSM and SSAM.
Thirdly, a series of scenarios were designed in the UCF driving simulator to collect data on drivers’ behaviors that react to pedestrian crossing the street at both mid-block crossings and intersections. A total of 67 participants were selected to participate in the experiment. Several software packages including Microsoft EXCEL, SPSS, Minitab, and R were used to analyze the data and build statistical models to identify vehicle-pedestrian conflicts and estimate the pedestrian safety with different potential factors.
Fourthly, the driver’s avoidance pattern was summarized based on the driving simulator experiment. In addition, the pedestrian-vehicle conflicts prediction model was developed to estimate the minimum distance between the pedestrian and the vehicle. The driver’s characteristics, potential risk factors, and the basic vehicle information were included in the model.
4
Finally, the process of pedestrian safety evaluation based on the field data, micro-simulation data, and driving simulator data was summarized.
1.3 Research Objectives
The main objectives of this research are as follows:
(1) Use micro-simulation model to identify vehicle-pedestrian conflicts and assess the pedestrian safety. First, collect the field data at seven signalized intersections and develop the VISSIM simulation models, using the field data, to replicate similar conditions in a simulated environment. Then, the calibrated and validated VISSIM simulation models were used to obtain the pedestrian and vehicle trajectory files, and SSAM was then used to extract the pedestrian-vehicle conflicts.
(2) Use the driving simulator to design the pedestrian-vehicle conflict scenarios to evaluate the pedestrian safety with different risk factors. First, set up several scenarios in the driving simulator to test the drivers’ behavior that react to the pedestrian crossing the street at both midblock crossings and signalized intersections and find out the potential risk factors that related to the pedestrian safety. Then, by processing the simulator data, selected surrogate safety measures for the pedestrian-vehicle conflict can be extracted and used to analyze the pedestrian safety with different risk factors.
(3) Use driving simulator data to explore the driver’s avoidance pattern and build the pedestrian-vehicle conflict prediction model.
5
(4) Based on the analysis before, summarize the process of pedestrian safety evaluation based on the field data, micro-simulation data, and driving simulator data.
1.4 Proposal Organization
This chapter presents an introduction to the subject matter to be discussed as well as a description of the research approaches and objectives. Chapter 2 delves into literature to discuss the framing of the problem addressed by this research. Chapter 3 describes how to build the pedestrian-vehicle conflict model in VISSM and extract the data from SSAM. In addition, the data collected from the field will be used to calibrate and validate the VISSIM and SSAM model. Finally, the simulated conflicts generated by SSAM will be used to compare to the conflicts observed in the field to identify if the VISSIM and SSAM can be used to predict the pedestrian-vehicle conflicts. Chapter 4 describes the driving simulator study methodology, including experimental design, experiment procedure, subjects and data collection. Chapter 5 analyzes the midblock scenario and the intersection scenario by using simulator data and discuss the pedestrian safety measurements in each. Chapter 6 uses the driving simulator experiment data to explore the driver’s avoidance pattern and develop the pedestrian-vehicle conflict prediction model. Chapter 7 summarizes three different kinds of data, including the field data, micro-simulation data, and driving simulator data. In addition, this Chapter proposes the process of pedestrian safety evaluation based on the field data, the micro-simulation data, and driving simulator data. Chapter 8 serves as the summary chapter.
6
CHAPTER TWO: LITERATURE REVIEW
In this chapter, a literature review of pedestrian safety was conducted, including pedestrian safety issues, potential risk factors that related to pedestrian crashes, microsimulation and driving simulator studies related to pedestrian safety. In addition, the UCF driving simulator was introduced at the end of this chapter.
2.1 Safety Issues Related to Pedestrian Crashes
A number of reports related to pedestrian safety issues have been released in the United States and all over the world in recent years. By analyzing the pedestrian crash data, governmental agencies addressed the pedestrian safety issues and determined the potential factors related to the pedestrian safety in order to provide useful information to guide countermeasure choices.
2.1.1 National Pedestrian Safety Reports
There have been numerous reports that were devoted to investigate and evaluate the pedestrian safety at the national level. The United State Department of Transportation (USDOT) produced the National Pedestrian Crash Report in 2008 using the fatal pedestrian crash data from Fatality Analysis Reporting System (FARS) and the other pedestrian crash data from the General Estimates System (GES) in the National Automotive Sampling System (Chang, 2008). The purpose of the report was to analyze the latest trends in pedestrian fatalities and to identify the probability of different contributing factors. The report mainly presented descriptive statistics and considered
7
five potential factors, including long-term trends, crash locations, crash time, pedestrian characteristics and driver characteristics. Similar reports published by the USDOT also demonstrated the pedestrian safety in 2011(National Highway Traffic Safety Administration, 2013).
The National Highway Traffic Safety Administration (NHTSA) collected the pedestrian crash data for two years at six different sites in the United States (Chidester & Isenberg, 2001). By using the video camera recording and contour gauge techniques, a total of 521 pedestrian crashes were collected. The study provided pedestrian crash trends and summarize the scope and character of pedestrian accidents.
Governors Highway Safety Association (GHSA) addressed pedestrian safety by using the pedestrian fatality data (Williams, 2013). They also proposed some potential reasons for the increase in pedestrian deaths in 2010 through 2012. The possible explanations included the economic recession that might increase the walking, changes in demographics that led to pedestrians unfamiliar with road, and warmer weather pattern that might increase the pedestrian exposure.
The Federal Highway Administration (FHWA) provided a distance-based methodology to estimate annual pedestrian and bicyclist exposure in an urban environment (Molino et al., 2012). Pedestrian volume data was collected through personnel who observed pedestrian movements while standing on the sidewalk. The travel distances were measured with tape and remote
8
measuring equipment. By combining the two measurements, a linear regression model was developed to estimate annual pedestrian exposure.
The Transportation for America also examined the pedestrian fatalities for each state from 2000 to 2009 to identify the common thread on the roads (Ernst et al., 2011). The Pedestrian Danger Index (PDI) was used to rank the country’s largest metropolitan areas according to their relative risk to walkers. The analysis concluded that Orlando tops the list of most dangerous places due to its high pedestrian fatality rate of 3 per 100,000 people, followed by Tampa, Jacksonville and Miami areas. They suggested that more funding should be used for the safer roads and a complete street policy should be adopted for pedestrians and bicyclists.
2.1.2 Statewide and Local Pedestrian Safety Reports
The New York Bicycling Coalition (NYBC) utilized two main databases to find pedestrian and bicyclist accident rates (Brustman, 1999). One of the databases was “Hospitalizations Due To Bicyclist and Pedestrian Injuries” from the Department of Health (DOH), which was more reflective of the actual injury situation. Another database was the “Summary of Bicycle and Pedestrian Accidents on State Highways” from the Department of Transportation (DOT), which looked for clusters of accidents on state highway routes. Through these two databases, researchers analyzed contributory factors in bicycle and pedestrian accidents. They employed a descriptive research method, which used the ratio of each factor to analyze bicycle and pedestrian accident rates. The report also provided suggestions for improving the local and statewide data collection,
9
such as redefining bicycle accident reporting criteria and offering financial assistance for the data collection system upgrades.
Thomas et al. (2009) used five years of state crash data from Traffic Engineering Accident Analysis System (TEAAS) and the perception data from 400 intercept survey respondents to identify the general trends in pedestrian and drivers’ characteristics in North Carolina. The kernel density analysis method was used to identify high risk locations in GIS and exploited Ripley’s K-function test to decide whether crashes were clustered randomly.
Ballesteros et al. (2004) examined how pedestrian injury was associated with the vehicle type and integrated two pedestrian accident databases to reclassify pedestrian accidents. The severely injured pedestrian accident types were classified into life threatening, potentially life threatening and dead prior to arriving the hospital. The other type was considered as non-life threatening. It was concluded that the increased danger due to sport utility vehicles and pick-up trucks to pedestrians was explained by larger vehicle masses and faster speeds. Through calculations of the severity of the pedestrians’ injury, it was found that the vehicle type might contribute to different injury patterns.
The City of Chicago (2011) published a summary report for pedestrian crash analysis for 2005-2009 crash data. The report provided descriptive analysis about the crash types, locations and severity. Pedestrian crash fatality rates per 100,000 residents were also used to compare with other US cities. In addition, crash maps were also provided to analyze where pedestrian crashes generally occurred in central business district and neighborhoods.
10
An overall technical guide for pedestrian safety assessments was introduced for California cities (Meghan et al., 2008). First, California cities were divided into several population groups based on the population size. Then, the rates of the different population groups were calculated per 10,000 populations to identify the high pedestrian accident cities.
Dumbaugh et al. (2012) mainly focused on the relationship between the environment and pedestrian crash accidents in Texas. Negative binomial regression models were used to fit the data and it was concluded that the environmental factors associated with pedestrian crashes were combination of traffic conflicts and the vehicle speed.
Oregon Department of Transportation (ODOT) utilized network screening methods, which complemented the crash frequency and severity screening by identifying risk factors, to identify locations for safety improvements where crashes had not been reported (Braughton and Griffin, 2014). A segment scoring system was also developed to estimate each risk factor and the GIS software summarized the pedestrian score of segments to identify the crash frequency and severity network for each Oregon region.
A pedestrian safety report published by Florida Department of Transportation pointed out why pedestrian fatality rates in Florida was higher than other states (Dewey et al., 2003). A multivariate regression model was used to analyze specific factors that related to the pedestrian fatality, including environmental factors and accidents locations. It was found that Florida residents walked more often in places that were exposed to traffic compared to other U.S. residents because of the
11
warm winter, the natural timing of summer and winter sunlight. Besides, there were millions of tourists visiting Florida every year, which led to more exposure to traffic. Moreover, elderly residents, the interstate shortfall, and poverty rate explained over 70% of Florida’s pedestrian fatalities. Another FDOT pedestrian safety report analyzed 6434 pedestrian crashes on roads during 2008-2010 in Florida (Alluri et al., 2013). A mixed logit model was developed to identify factors contributing to pedestrian injury severity at signalized and non-signalized locations. Statewide crash patterns, causes, and contributing factors were used to have a better understanding of pedestrian injury severity. Several countermeasures at both nonsignalized and signalized locations were suggested to reduce pedestrian crash frequency and severity.
2.2 Risk Factors Related to Pedestrian Crashes
There have been numerous studies that attempted to identify significant factors related to pedestrian accidents. The main factors discussed in this study include environmental factors, roadway characteristics factors, human factors, vehicle characteristics factors and special locations.
2.2.1 Environmental Factors
The environmental factors included time, weather, area type, and so on. First, the City of Chicago found that that 26% of pedestrian crashes occurred from 3 p.m. to 6 p.m. in Chicago, which was the period with most occurrences (Chang, 2008). However, NHTSA found that 24.7% percent of pedestrian deaths happened between 6 pm and 9 pm, which was the highest number of pedestrian deaths of the whole day (National Highway Traffic Safety Administration, 2013). Weather and
12
lighting condition factors were also of common concern. Other studies showed that poor lighting conditions increased the likelihood of pedestrian injuries (Clifton et al., 2009; Mohamed et al, 2013). However, weather was not a significant factor in several studies (Clifton et al., 2009; Dai, 2012).
Noland and Quddus (2004) analyzed whether the different income areas were associated with pedestrian safety. They used the negative binomial model and found that areas with lower income were more prone to pedestrian crashes, which concurred with the study by Kravetz and Noland (Daniel & Noland, 2012). In addition, it was also found that areas with lower population density experienced more fatalities compared to those areas with higher population densities. Ukkusuri et al. (2012) showed that a greater fraction of residential land use decreased pedestrian crashes compared to the industrial, commercial and open land use type in New York City. Other related studies concluded that low density residential areas were more dangerous than compact residential areas (Cho et al., 2009; Zajac & Ivan, 2003).
Some research studied the factor of urban and rural areas as locations of interest. Zhu et al. (2008) gathered information on 35,732 pedestrian accidents and used Poisson distribution to calculate the 95% of confidence interval of an adjusted rate ratio (aRR) of pedestrian-vehicle crash and pedestrian injury according to resident years and miles walked in either urban or rural areas. Pedestrian crash rates were calculated per 100,000 person years and per million miles walked according to the region size. The analysis showed that hot accident spots were closer to urban areas, especially for small to mid-size.
13
2.2.2 Roadway Characteristics Factors
Several studies also focused on investigating roadway characteristics factors that impacted pedestrian safety. Turner et al. (2006) investigated roadway factors in an urban area in New Zealand. It was found that 56% of accidents occurred at mid-block locations, which were the highest among urban pedestrian accident locations. The second highest locations were at intersections which accounted for 38% of accidents. Brustman (1999) found that municipal streets had a higher probability of accidents involving a pedestrian compared to state roads, county roads, town roads and limited access highways.
Tarko and Azam (2011) developed the bivariate ordered probit model to identify how the roadway type affected the pedestrian injury severity by using the linked police-hospital data. It was found an increased likelihood of a pedestrian injury severity on rural roads and high-speed urban roads. Lee and Abdel-Aty (2005) used four years of vehicle-pedestrian crashes data from 1999 to 2002 in Florida to identify roadway characteristics that were correlated with high pedestrian crashes using a log-linear model. It was found that undivided roads with a greater number of lanes were more dangerous than divided roads with fewer lanes.
Ukkusuri et al. (2012) developed pedestrian accident frequency models for New York City and found that more pedestrian crashes were associated with larger road width and road width was related to operating speeds, length of crosswalks and traffic volume.
14
Hanson et al. (2013) also studied roadway characteristics which included the presence of sidewalks, buffers between the road and the sidewalk, number of travel lanes, the presence of medians, traffic control at intersections, and posted speed limits. The Google Street View imagery was used to collect data. The results showed that the presence of sidewalks could reduce the severity of pedestrian crashes. Lack of buffers between the road and the sidewalk and higher speed limits were found to be associated with higher pedestrian severe causalities and fatality rates. However, the number of travel lanes and presence of medians were not statistically significant for the pedestrian crashes. Moreover, crosswalks at traffic-controlled intersections was the only significant factor among the traffic control at intersections. Other related factors, like crosswalk at intersection, control only, control at intersection and control and crosswalk, appeared not to be significant.
2.2.3 Human Factors
There have been numerous studies that aimed at identifying significant human factors related to pedestrian crashes. Human factors included age, gender, race and alcohol involvement. According to different areas, crash distributions of different age groups were distinct. For example, an age-specific study of death rates due to pedestrian accidents in the city of Montreal was conducted in which the inner city was compared to the outer parts of the cities in four contiguous areas (Allard, 1982). It was found that the rates were the highest in downtown and decreased progressively in the outlying areas. In addition, since it was observed that older pedestrians had difficulty in crosswalk situations, the crossing time at signalized intersections should be extended, especially in areas with large population of elders.
15
In Chicago, crash rates of the ages between 15 and 18 was the highest among all age groups (City of Chicago, 2011). However, Lee and Abdel-Aty found that middle-age male drivers and pedestrians were more involved in pedestrian accidents than other groups when analyzing age and gender factors in Florida (Lee & Abdel-Aty, 2005). The similar findings were also observed by Eluru et al. (2008), Tarko and Azam (2011), LaScala et al. (2000), and Dai (2012).
Another study used walking exposure (kilometers walked per person-year), vehicle-pedestrian collision risk (number of collisions per kilometers walked) and vehicle-pedestrian collision case fatality rate (number of deaths per collision) to study the male-female discrepancy (Zhu et al., 2008). The results showed that the pedestrian death rate per person year for men was 2.3 times more than the women’s and was attributed to a higher fatality per collision rate among male pedestrians.
Chang (2008) analyzed ethnic groups of pedestrian fatalities and found that nearly 60% of pedestrian fatalities were white, 15% were black, and 18% were Hispanic, which concurred with the study by Ukkusuri (2011).
Other studies claimed that pedestrian’s alcohol involvement was an important human factor affecting pedestrian crashes. Noland and Quddus (2004) suggested that alcohol involvement increased the risk of a fatal crash, which was also proved by Mohamed et al. (2013) and Miles-Doan (1996). Zajac and Ivan (2003) stressed that both driver alcohol involvement and pedestrian alcohol involvement were found to significantly increase pedestrian injury severity.
16
In addition to these human factors, researchers recently started looking into the effects of pedestrian distraction when talking or texting on their cell phones. Nasar and Troyer (2013) used the National Electronic Injury Surveillance System (NEISS) database in hospital emergency rooms from 2004 to 2010. Pedestrian injuries were found to be higher in the case of distraction using cell phones compared to no distraction. Byington and Schwebel (2013) utilized virtual pedestrian streets to examine hazards for pedestrians while crossing a street and checked whether the distracted by cell phone influenced the pedestrian behaviors. It was found that pedestrian behavior was considered to be more dangerous using cell phones than crossing the street without distractions.
2.2.4 Vehicle Characteristic Factors
Several studies had investigated vehicle types in pedestrian crashes. In the NHTSA Pedestrian Crash Data Study (PCDS), 68% of the involved vehicles were passenger cars and 32% were other vehicles, including light trucks, vans, and utility vehicles (Chidester & Isenberg, 2001). However, although the truck was not the highest number in vehicle types, the influence of truck flow at intersections with high pedestrian activity was found to be one of the significant factors associated with the most severe injuries (Mohamed et al., 2013). Satiennam and Tanaboriboon (2003) used chi-square tests to study types of vehicles and ages of pedestrian fatalities in traffic accidents in Thailand. The results indicated that more than 60% of pedestrian fatalities were motorcycle crashes, which was the highest frequency of pedestrian accidents.
In recent years, many studies have focused on the vehicle speed for pedestrian crashes and pedestrian injury severities. Han et al. (2012) used two finite element pedestrian models and four
17
finite element models for vehicles with different front-end shapes to evaluate pedestrian injury severities. It was found that vehicle speed was the significant factor in injury severity and the speed below 30 km/h could reduce all injury parameters, which was similar to the findings of Pitt et al. (1990).
2.2.5 Location Factors
Many researchers have attempted to perceive the pedestrian safety in some special locations, such as parking lots, school zones and highway-rail crossings. Boot et al. (2013) investigated pedestrian crash data for parking lots based on pedestrian age in West Central Florida. The data were collected from west central region between 2004 and 2008. They observed that pedestrian crashes in small parking lots and residential parking lots had a greater effect on crash rates than in large parking lots and other types of parking lots, such as retail and gas station. Moreover, older pedestrian group (age>75) were more involved in backward driving (cars in reverse) crashes while the younger pedestrian group (age<14) were more involved in forward driving crashes. However, parking space angle and attention patterns such as head turns and eye fixation while walking in crosswalks were found as non-significant factors when related to pedestrian crash frequency.
Warsh et al. (2009) used five-year police-reported collision data and geographic information systems (GIS) to assess child pedestrian crashes in school zones. It was found that school zones were the most dangerous locations for child pedestrians and those crashes decreased as distance from school increase. Also, 37.3% of collisions happened among 10-14 years old.
18
Using the 2007-2010 highway-rail grade crossings (HRGC) crash data, Khattak (2013) employed the ordered probit model to investigate different variables that contributed to the severity level of pedestrian injuries. Model results showed that higher train speeds were associated with more severe injuries. Female pedestrians had higher injury severity when compared to others. Pedestrian crashes at HRGCs in commercial areas were more severe compared to other land uses (e.g., open space, residential, etc.) and lower crash severity levels at HRGCs with greater number of crossing highway lanes, with standard flashing light signals and in clear weather.
2.3 Simulation and Simulator Study Related to Pedestrian Safety
2.3.1 VISSIM
Many researchers have attempted to use VISSIM to evaluate and analyze pedestrian safety in the road network. Ishaque and Noland (2005) used the vehicle following model to simulate pedestrian flow characteristics in urban traffic networks and demonstrated that VISSIM could be used for multimodal network analysis by coding pedestrians as a vehicle, which was very important to allow full consideration of pedestrians in traffic policies by using traffic simulation software. Besides, they also set up a complex network in VISSIM to analyze pedestrian exposure to vehicle emissions and the role played by signal timings (Ishaque & Noland, 2008; Ishaque & Noland, 2009). The results showed that longer signal cycles could result in less vehicle emission, but cause longer pedestrian delay.
19
Boenisch and Kretz (2009) simulated pedestrians crossing a street with a lane for each direction in VISSIM. They found that a vehicle demand of 700 to 800 vehicles per hour and showed the maximum travel time for pedestrians. A study by Chen et al. (2010) attempted to develop a pedestrian delay estimation model for both signalized and unsignalized intersection considering vehicle-pedestrian conflicts. The pedestrian delay model was built by field data, but the effectiveness of the model was checked in VISSIM by simulating the two actual intersections.
In addition to the intersection, researchers recently started considering pedestrian behavior for roundabout by using VISSIM. Astrid et al. (2011) investigated how well the Rodegerdts and Blackwelder model could affect levels of service when pedestrians and bicycles crossed the exit of roundabout. Redegerdts and Blackwelder model calculated a percentage capacity loss for the approach situated closest to the exit being blocked, which was more suitable for analytical traffic model. By comparing the result from a microscopic simulation in VISSIM, it was found that the total travel time increased if the pedestrians and bicycles were included in the model. Besides, a high vehicle pedestrian flow seemed to be more affected by small changes in pedestrian flow according to the simulation results. Another study also used VISSIM to simulate roundabouts (Rouphail et al, 2005). First, they used observational data to validate the pedestrian gap parameter for blind and sighted pedestrians. And then, the pedestrian crossing treatment, which was the use of an upstream/downstream (midblock) pedestrian-activated signal and crosswalk, were proposed and tested in the simulation, indicating that it would guarantee a crossable gap and minimize any negative impact at roundabout.
20
2.3.2 Cellular Automata Micro Simulation
A cellular automata model is a discrete model studied in compatibility theory, mathematics, physics, complexity science, theoretical biology and microstructure modelling (Chopard, 1998). As the cellular automata model could characterize traffic flow’s discreteness feature and easy to simulate in computer, it has been used to simulate traffic by many researches (Rickert et al., 1996; Maerivoet & De Moor, 2005; Meng & Weng, 2011).
In recent years, the cellular automata model has been applied to investigate pedestrian movements and behaviors. Blue and Adler (2001) used cellular automata model to simulate three modes of bi-directional pedestrian flow, including flows in bi-directionally separated lanes, interspersed flow, and dynamic multilane flow. They found that the pedestrian emergent behavior from cellular automata model was consistent with the empirical data. Another study by Li et al. (2012) attempted to investigate pedestrian conflicts with vehicles at a crosswalk of a signalized intersection using cellular automata simulation. The simulation results showed the effects of different pedestrian signal timing and crosswalk widths on the crosswalk capacity, the number of traffic conflicts between pedestrians and vehicles, and pedestrian delay due to the conflicts. Besides, they also demonstrated that the cellular automata simulation could realistically capture the behaviors and characteristics of pedestrian-vehicle flows, which are similar to the findings of Zhang and Chang (2014) and Yue et al. (2010).
21
2.3.3 Driving Simulator
The driving simulator is another important tool for researchers to analyze traffic events. It can provide a well-controlled experimental condition and can collect the data, which are difficult to achieve in the real world as well. Mostly, driving simulators are used to analyze driving behaviors under different conditions (Kolisetty et al., 2006; Lee and Abdel-Aty, 2008; Wu et al., 2016; Yan et al., 2016). However, some studies also involve pedestrians in the driving simulator experiments in order to find out the interaction effects between pedestrians and vehicles.
Yuan et al. (2013) combined driving simulator and computer simulation to reconstruct the process of pedestrian-vehicle crash. The purpose of this study was to find out the relation between drivers’ various emergency measures and pedestrians’ injury severity. The findings indicated that the most effective way to reduce injury severity was steering with braking. Boot et al. (2013) invited 63 participants to do the driving simulator experiment in order to test the new pedestrian marking, which was called special emphasis marking. All the participants were divided into three different age groups and a 3D model of an intersection was created in the driving simulator. The results showed that drivers could recognize the special emphasis marking much more quickly than the normal crosswalk marking. Moreover, when there was a pedestrian crossing the street, drivers were not affected by the special emphasis marking.
22
2.4 Driving Simulator Issues
2.4.1 Advantages and Disadvantages of Driving Simulator Research
In recent years, the driving simulator have been widely used in the safety research. The modern driving simulator is usually built with the simulation software using a sophisticated driver environment which can give drivers on board impression that drivers feel that they drive in an actual vehicle. In addition, driving simulator usually include the visual system, audio system, and vibration system, which provide a realistic feel of all controls. Therefore, a driving simulator is one of the research tools which enables researchers to conduct multi-disciplinary investigations and analyses on a wide range of issues (Abdel-Aty et al., 2006; Godley et al., 2002; Zhang et al., 2015).
The use of a driving simulator for human factors research has many advantages. First, the driving simulator has controllability, reproducibility, and standardization compared to real vehicles (Yan, 2005). The behaviour of vehicles, pedestrian and other environmental conditions can be controlled based on the research purposes. Especially, the driving simulator has the ability to simulate dangerous driving situations in a safe environment, which makes researchers easier to test driving behaviors (Underwood et al., 2011; Tu et al., 2015; Yan et al., 2016; Chang et al., 2009). Second, the data can be collected accurately and efficiently (De Winter et al., 2009; Wu, 2014). It is difficult to collect the accurate data when a real vehicle is in the world. Compared to the real vehicle, the driving simulator could output the data less than a second. The researchers can get an accurate data up to 100 data points per second based on the different types of driving simulators.
23
Third, the driving simulator can test novel instructions and functions for feedback (Yan & Wu, 2014; Yan et al., 2015; Larue et al., 2015). Some new technologies and instructions cannot be easily tested in the real vehicles because of the safety issue. Therefore, the driving simulator is an alternative to achieve the feedback of new technologies and instructions.
However, there are also some disadvantages of driving simulator researches. First, the simulator fidelity is one of factors that impact the research result. Some researches pointed out that some low-fidelity simulators may evoke unrealistic driving behaviour so that the research outcomes may be invalid (De Winter et al., 2012). In order to reduce the fidelity impact, a high-fidelity simulator is used in this study. Another important disadvantage is simulator motion sickness (Kennedy et al., 1992; Frank et al., 1988; Brooks et al., 2010). The data collected from the simulator may be biased due to the sickness symptoms. Even worse, some participants could not complete the experiments because of the motion sickness, especially for the older participants. In this study, the participant takes less than 10 mins in each scenario and they also need to have a rest between scenarios in order to alleviate the sickness problem.
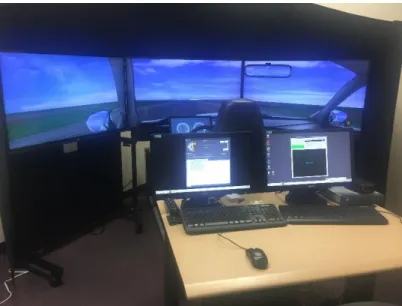
2.4.2 UCF Driving Simulator
This study used a driving simulator for the experiment and data collection, which was located in University of Central Florida, in the United States (see Fig. 1). This driving simulator is produced by NADS – the National Advanced Driving Simulator group from the University of Iowa, which provides a high fidelity driving testing environment. It includes a visual system (three 42” flat panel displays), a quarter-cab of actual vehicle hardware including a steering wheel, pedals,
24
adjustable seat, and shifter from a real vehicle, a digital sound simulation system and the central console. The software, including Tile Mosaic Tool (TMT), Interactive Scenario Authoring Tool (ISAT) and Minisim, can be applied for researchers to create driving scenarios with the virtual traffic environments and the virtual road networks. The data sampling frequency is up to 60 Hz. In addition, a recording system was also installed. Five cameras were installed to ensure subjects’ safety in the driving simulator and to capture the participants’ performance while driving in the simulator.
25
CHAPTER THREE: MICRO-SIMULATION APPLICATION TO
PEDESTRIAN-VEHICLE CONFLICTS
In this chapter, three main tasks are included. First, collect field data at seven signalized intersections. Second, develop calibrated and validated VISSIM simulation models at seven signalized intersections. Third, compare simulated conflicts generated by SSAM to the conflicts observed in the field and determine whether VISSIM and SSAM could provide reasonable estimates for pedestrian-vehicle conflicts at signalized intersections.
3.1 Field Data Collection
3.1.1 Experimental Sites
The data collection in the field was used to develop, calibrate, and validate the VISSIM and SSAM models. Seven intersections were selected from urban areas in Orlando, Florida. Four criteria were considered in the site selection process: (1) high pedestrian activity; (2) high traffic volume; (3) urbanized location, but outside the CBD or downtown area; (4) appropriate number of pedestrian crashes during the 5-year reporting period. The selected intersections are listed in Table 1. Orange Ave & Central Blvd is located in a downtown area where a large number of pedestrian activity occur during lunch hour. Sand Lake Rd & I-Drive is located in a tourist area where a high volume of pedestrian activity exists. Martin Luther King & US 92 is located near the university campus in Daytona Beach in Volusia County. Furthermore, selections of the remaining intersections were
26
done according to the severity of pedestrian crashes. Silver Star & Hiawassee Rd had one fatality out of 20 pedestrian crashes as well as Kirkman Rd & Conroy Rd with two fatalities out of 13 pedestrian crashes.
Table 1: List of seven test intersections
a. 5-year Ped Crashes are from June 2009 to May 2014.
3.1.2 Data Collection Procedures
Several steps were implemented in order to extract the data from the field. First Google Maps were utilized to extract the network geometry, such as link lengths, number of lanes, and connectors between links to model turning movements. Second, cameras were set up in each intersection to record the traffic volume, pedestrian volume, pedestrian crossing behavior, maximum queue length, and pedestrian-vehicle conflicts. One camera was set up on top of the roadside to achieve adequate viewing height to cover the functional area of the intersections. However, three No. Intersection Name 5-year Ped Crashesa Location County
1 Primrose Dr & Colonial Dr 9 Orlando Orange 2 Silver Star & Hiawassee Rd 20 Pine Hills Orange
3 Sand Lake Rd & I-Drive 6 Orlando Orange
4 Kirkman Rd & Conroy Rd 13 Orlando Orange
5 Martin Luther King & US 92 7 Daytona Beach Volusia
6 Orange Ave & Kaley St 8 Orlando Orange
27
intersections, Sand Lake Rd at I-Drive, Kirkman Rd at Conroy Rd, and Semoran Blvd at Pershing Ave were too large to cover the whole intersection with one camera. Therefore, two video cameras in opposite corners were set up for each of these intersections. Furthermore, field data collection was conducted during the weekday peak hours under dry weather condition. The data was collected from 9:00 am to 12:00 noon, and 3:00 pm-6:00 pm in the afternoon for each intersection. The data collection schedule is given in Table 2. In total, 6 hours of data were recorded for each signalized intersection.
Table 2: The data collection schedule
The recorded videos were later reviewed for evaluation and analysis in the laboratory. For traffic volume and pedestrian volume, data was recorded in 15-min time intervals. Maximum queue length was recorded for further validation of driver behavior in the VISSIM model. Furthermore, the camera angles allowed only one or two approaches to capture the queue length of each intersection. Pedestrian behavior was collected to calibrate and validate VISSIM model for
No. Intersection Name Days Time Hours
1 Primrose Dr & Colonial Dr 1 9am-12pm, 3pm-6pm 6 2 Silver Star & Hiawassee Rd 1 9am-12pm, 3pm-6pm 6 3 Sand Lake Rd & I-Drive 1 9am-12pm, 3pm-6pm 6 4 Kirkman Rd & Conroy Rd 1 9am-12pm, 3pm-6pm 6 5 Martin Luther King & US 92 1 9am-12pm, 3pm-6pm 6 6 Orange Ave & Kaley St 1 9am-12pm, 3pm-6pm 6 7 Semoran Blvd & Pershing Ave 1 9am-12pm, 3pm-6pm 6
28
pedestrian behaviors. The parameters of pedestrian behavior observed included the directions, platoon number, waiting time, crossing time, and violation. Pedestrian conflicts between pedestrians and vehicles were recorded from the video by identifying pedestrian or vehicle evasive actions meaning the potential occurrence of a vehicle crashing into a pedestrian. Two trained observers were designated to review and analyze all the videotapes as well as record the information for each conflict.
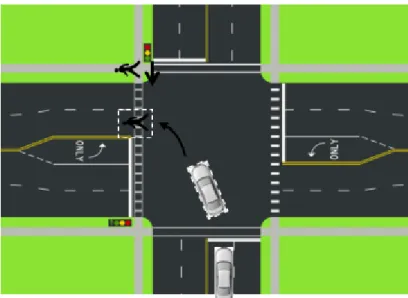
The pedestrian-vehicle conflicts observed in the field are classified into two types, (a) vehicle-yield-pedestrian and (b) pedestrian-yield-vehicle, as shown in Figure 2. If the vehicle decelerates in order to avoid the crossing pedestrian, (which means the pedestrian arrives at the conflict point first), this is the type (a) conflict called vehicle-yield-pedestrian conflict. In contrast, if the vehicle arrives at the conflict point first and the immediate arrival of the pedestrian comes afterward, then this is the type (b) conflict called pedestrian-yield-vehicle. In practice, the vehicle-yield-pedestrian conflict is more dangerous than the pedestrian-yield-vehicle conflict. This is due to the fact that when the pedestrian yield to the vehicle at the signalized intersection, the pedestrian always stands still until the vehicle passes the potential conflict point. Under this condition, the TTC of pedestrian-yield-vehicle conflict is infinite. However, the TTC of vehicle-yield-pedestrian is always small so that it is a potential collision. Therefore, vehicle-yield-pedestrian conflict is more likely to lead to a traffic crash. In addition, the previous studies also defined the pedestrian-vehicle conflict, which only referred to the vehicle-yield-pedestrian conflict (Parker and Zegeer, 1989; Wu et al., 2106). Accordingly, this study only focuses on analyzing the vehicle-yield-pedestrian conflicts as the most hazardous.
29
Figure 2: The pedestrian-vehicle conflict types observed in the field
3.1.3 Data Description
Table 3 summarizes the pedestrian crossing number recorded during the data collection period. As there are some pedestrians who did not use the crosswalk to cross the street, those pedestrian counts were disregarded and eliminated from the analysis. Therefore, the number of pedestrian volume in this section may slightly differ in comparison to the total pedestrian volume count. There were a total of 2610 pedestrian crossings at seven intersections observed in the field. 40.8% (1067 out of 2610) at intersections of the pedestrian crossing behaviors are single pedestrian crossing behaviors. The following subsections explained the pedestrian crossing behaviors for intersections in further details.
30
Table 3: Summary of pedestrian crossings at intersections
No. Intersection Name Total Crossings Single Two or More
1 Primrose Dr & Colonial Dr 214 152 28
2 Silver Star & Hiawassee Rd 305 148 65
3 Sand Lake Rd & I-Drive 1310 264 352
4 Kirkman Rd & Conroy Rd 299 192 46
5 Martin Luther King & US 92 140 107 16
6 Orange Ave & Kaley St 150 95 24
7 Semoran Blvd & Pershing Ave 192 109 32
Total 2610 1067 563
The basic statistical descriptions of pedestrian crossing behavior at intersections are shown in Table 4. A total of 2863 pedestrian crossings were recorded at the seven signalized intersections. The average speed of all pedestrians was 1.62m/s (5.31 ft/sec). In addition, 8.8% of pedestrians have violation behaviors of which most of the violations were running the red light. 64% of pedestrians stopped on red and the average waiting time for all pedestrians were 51 seconds.
31
Table 4: Descriptive statistical results of pedestrian crossing behavior at intersections
No. Intersection Number of observations Walking Speed (m/s) Viola tion Stop on Red Waiting Time (Seconds) 1 Primrose Dr & Colonial Dr 180 1.70 19 53 47
2 Silver Star &
Hiawassee Rd 213 1.65 43 138 44
3 Sand Lake Rd &
I-Drive 616 1.57 9 484 66
4 Kirkman Rd &
Conroy Rd 238 1.66 15 146 62
5 Martin Luther
King & US 92 123 1.87 32 48 38
6 Orange Ave &
Kaley St 119 1.42 12 67 41
7 Semoran Blvd &
Pershing Ave 141 1.49 13 106 59
Table 5 shows the statistical results of observed conflicts at the seven signalized intersections. A total of 708 conflicts were observed at seven signalized intersections and the average post-encroachment time (PET) for each conflict was 4.05 seconds with a standard deviation of 1.56. The definition of PET is covered in section 3.3.
32
Table 5: Descriptive statistical results of pedestrian crossing behavior at intersections
No. Intersection Number of conflicts PET (Seconds)
1 Primrose Dr & Colonial Dr 64 4.44
2 Silver Star & Hiawassee Rd 86 4.24
3 Sand Lake Rd & I-Drive 295 3.93
4 Kirkman Rd & Conroy Rd 94 3.81
5 Martin Luther King & US 92 34 3.59
6 Orange Ave & Kaley St 62 3.57
7 Semoran Blvd & Pershing Ave 73 5.00
3.2 Calibrated and Validated VISSIM Model
In this study, VISSIM version 7 was used to develop the vehicle/pedestrian simulation model at signalized intersections. Wiedemann 74 car-following model was used since it was recommended for urban traffic (PTV, 2011). The first step of developing the VISSIM model was to draw the network. Second, traffic volume and pedestrian volume for each direction were allocated to each lane group. In addition, the traffic volume also included 2% heavy vehicles on all approaches. Third, signal timing was coded in the VISSIM simulation model according to the field signal timing data. Last, conflict areas and priority rules were needed in the simulation model in order to simulate the vehicle and pedestrian movements more appropriately.
The VISSIM model cannot provide the necessary results until the model is calibrated and validated (Cunto and Saccomanno, 2008; Sun et.al, 2007; Li et al., 2011). VISSIM provides numerous
33
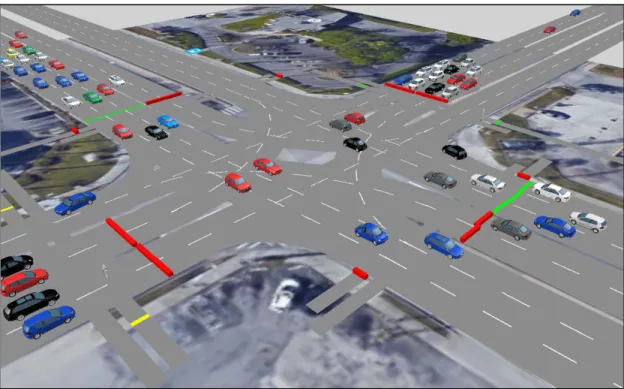
calibration parameters that could be modified. In this study, average standstill distance (1,2,3,4,5), additive part of desired safety distance (2,3,4), multiple part of desired safety distance (2,3,4), the minimum headway (2,5,8) and the minimum gap time (2,3,4) were selected as the calibration parameters. The number of conflicts and the average TTC was used to calibrate these parameters. Finally, it was found that changing the calibration parameters didn’t impact the number of conflicts and the average TTC. Therefore, in this case, the default value of parameters was used. In other words, average standstill distance was 2 meters, additive part of desired safety distance was 3 meters, multiple part of desired safety distance was 3 meters, the minimum headway gap was 5 meters, and the minimum gap time was 3 seconds. Then, the calibrated models were then validated with a new set of field data, including the pedestrian volumes, and the vehicle volumes. The average percent difference for all scenarios of pedestrian volume and vehicular traffic volume are 3.6% and 1.3%, respectively. Furthermore, animation of the VISSIM simulation models were checked for any unusual events. Finally, VISSIM was calibrated and validated. The intersection of Sand Lake Road and I Drive is shown in Figure 3.
34
Figure 3: VISSIM simulation model for Sand Lake Rd & I-Drive
Furthermore, the simulation was run for 3600 seconds (1 hour) with additional warm up period of 15 minutes in each scenario. A total of 10 runs with different seeding values for each one-hour time interval per intersection were completed for each scenario and the average of the runs was reported. For example, six hours of simulated data were collected at the seven intersections, then the VISSIM model was run for 10*6*7=420 times.
3.3 Surrogate Safety Assessment Model (SSAM) Calibration
SSAM software can automate conflict analysis by directly processing vehicle trajectory data from VISSIM. It can provide a summary of the total number of conflicts broken down by type of conflict. In addition, SSAM could also calculate some surrogate safety measures for each event (Radwan
35
et al., 2016). Five measures were relevant to evaluate the traffic safety, which are TTC, PET, MaxS, DeltaS, DR and MaxD. Each surrogate safety measure is defined as follows:
• TTC (Time to collision): the time distance to a collision of two road users if they keep their directions and velocities. The shorter the TTC, the more dangerous the situation. • PET (Post-encroachment time): the period of time from the moment when the first road
user is leaving the conflict area until the second road user reaches it.
• MaxS: the maximum speed of either vehicle throughout the conflict measured in meter per second.
• DeltaS: is the difference in vehicle speeds as observed at the simulation time where the minimum TTC value for this conflict was observed measured in meter per second. • DR: the initial deceleration of the second vehicle measured in meter per square second. • MaxD: the maximum deceleration of the second vehicle measured in meter per square
second.
SSAM software can automate conflict analysis by directly processing vehicle trajectory data from VISSIM. However, SSAM was not explicitly designed for pedestrian conflict analysis, so there is no vehicle or entity type available in the trajectory file format by which to identify pedestrian conflicts. In other words, SSAM cannot estimate the pedestrian-to-vehicle conflicts without simulating the pedestrian as vehicles in VISSIM (Wu et al., 2017). Therefore, to identify pedestrian-to-vehicle conflicts from all kinds of conflicts, the csv file exported by SSAM can be of help. From the csv file, the pedestrian-vehicle conflict can be filtered based on the “vehicle” length. The length of pedestrian is usually defined between 0.3 and 0.5 meter. In comparison, the length of vehicle is usually defined over 3.5 meters.