Economics Working Paper Series
2020/003
Financial Development, Economic Performance and
Democracy: Methodological Issues and New
Estimates
Zhenxiong Li, Hilary Ingham
The Department of Economics
Lancaster University Management School
Lancaster LA1 4YX
UK
© Authors
All rights reserved. Short sections of text, not to exceed two paragraphs, may be quoted without explicit permission,
provided that full acknowledgement is given. LUMS home page: http://www.lancaster.ac.uk/lums/
Financial Development, Economic Performance and
Democracy: Methodological Issues and New Estimates
Zhenxiong Lia,∗, Hilary Inghamb,∗∗
aDongWu Business School, Soochow University, Suzhou City, Jiangsu Province, China. bDepartment of Economics, Lancaster University, Lancaster, UK.
Abstract
This paper investigates the long-term effect of financial development on eco-nomic growth using annual data for 67 countries over the period 1971 to 2007. Both autoregressive distributed lag (ARDL) and cross-sectionally augmented autoregressive distributed lag (CS-ARDL) models are applied to count for cross-country heterogeneity and error cross-cross-country dependence. The results uphold a positive and significant effect of financial development on long-run per capita output. There is also some evidence of a non-linear relationship between finan-cial development and growth. However, the analysis also reveals that the results derive primarily from non-democratic countries.
Keywords: Economic growth; Financial development; Democracy
JEL Classification: O16; O43; P16
1. Introduction
The relationship between financial development and economic performance is a controversial topic in growth economics. As far back as the start of the twentieth century, a burgeoning volume of literature emphasized the importance of the functions of financial sector as a driver of economic progress. (Schum-peter (1912); McKinnon (1973); Shaw (1973)). A well-developed financial sector
∗This author acknowledges the support of the Economic and Social Research Council under
grant number ES/J500094/1.
∗∗Corresponding author
Email addresses: [email protected].(Zhenxiong Li),[email protected].
isthought to promotelong-term economicgrowth byfacilitating transactions, mobilizingsavingsanddiversifyingrisk(Becketal.(2000)). However,as some-timeswitnessed,excessivespeculativeactivitiesand financialresource misallo-cationinevitablysheddoubtontheexpectedgrowth-enhancingroleoffinancial development.
Aparallel,somewhatmorerecent,developmentinthegrowthliteratureisthe effectofdemocracyoneconomicperformance.Thus,forexample,Acemogluetal. (2014) revealed some evidence of a beneficial effect of democracy for socio-economic outcomes. Nevertheless, to date, empirics has largely ignored the moderatingroleofdemocracyontherelationshipbetweenfinanceandeco-nomic performance. This paper therefore aims to contribute to the literature by examiningthedegreetowhichdemocracystrengthens,or weakens,theimpact offinancialdevelopmentongrowth.
Furthermore, despite theincreasing sophistication ofthe estimation meth-ods, growth empirics are never free from criticism regardingmethodology. In particular, as suggested by Durlauf et al. (2005), Eberhardt and Teal (2011) andPesaran(2015),cross-countryheterogeneityandcross-sectiondependence, which are largely ignored in the majority of existing growth literature, have challengedthestandardcross-countryandpanelgrowthregressionframeworks. Usingbotherrorcorrection-basedautoregressivedistributedlag(ARDL)and cross-sectionallyaugmentedautoregressivedistributedlag(CS-ARDL)models, this paper aims to address these concerns by applying recent heterogeneous panel estimation methods to account for slope heterogeneity and error cross-countrydependence. Theresultsconfirmthat financialdevelopmentiscapable ofstimulatingoutputinthelongterm,althoughsuchabeneficialeffectislargely drivenbynon-democraticcountries. Inaddition,theresultsprovidesome,albiet limited, evidence of an inverseU-shaped relationship between financial devel-opment and economic performance, suggesting that over-development of the financialsector canbedetrimental togrowth.
The remainder of this paper is organized as follows. Section 2 provides a briefoverview oftheliteratureexaminingtherelationship betweenboth
finan-cial development and democracy on growth. Cross-country heterogeneity and dependence along with nonlinearity are addressed in Section 3. This Section also outlines the models employed in the analysis. Following a description of the data in Section 4, Section 5 presents the results. A summary discussion of the results and their implications conclude the paper.
2. Growth, Financial Development & Democracy
Therelationship betweeneconomicperformanceandfinancialdevelopment has a long history dating back to Smith (1776) and Hamilton (1781). Since then,variousscholars,suchasSchumpeter(1912),McKinnon (1973)andShaw (1973),havestressedtheirreplaceableroleoffinanceintheeconomy. In partic-ular,at thetheoretical level, a well-developedfinancialsystemwouldpromote economic growth via its functions of information production, corporate gov-ernance, risk diversification, savings mobilization, and transaction facilitating (Becket al. (2000)). Meanwhile, inspiredbythe seminalcontribution of King andLevine(1993a,b),empiricalinvestigationonthisrelationshiphasgradually emergedsincethe1990s.The majorityofempiricalinvestigationsinthenext20 yearscontinuedtosupporta strongrelationship betweenfinancialdevelopment and economic growth. Among these are the studies of Levine et al. (2000), Becketal.(2000)andBeckandLevine(2004).
However, sight was not lost though on the fact that certain studies have uncoveredevidence ofthedetrimental effect ofdomestic financialdevelopment forlong-termgrowthprospects.Indeed,theideathattheremaybea threshold abovewhichfurtherfinancialdevelopmentbringsaboutnegativereturnscanbe traced back as far as Kindleberger (1978) and Minsky (1991). More recent researchofCecchetti andKharroubi(2012),LawandSingh (2014),Becket al. (2014),Arcandet al.(2015),and Courne`deand Denk (2015),alsosuggested a highleveloffinancialdevelopmentcouldbeadragoneconomicgrowthdue
to talent misallocation and speculative bubbles. Moreover, it is indicated in recent literature that effect of growth of finance coulddepend on the specific institutionalconditioninaspecificeconomy. Forexample,Menyahetal.(2014) observedthat financialsystemdevelopmentfailedto promotedomesticoutput growthinCameroon,CentralAfricaRepublic,Chad,CongoandSudan. Inter-estingly, the countries mentioned above commonly lack democratic institutions,which issalient in view ofthefact that authorssuch asAcemoglu et al. (2014),and Madsen et al. (2015), have highlighted democracy as a major driver ofgrowth.
Theoreticaldebateontheroleofapoliticalsystemoneconomicgrowthhas alsobeenongoingfordecadesand,asaresult,threepredominantopinionsonthe influenceofthedemocraticsystemongrowthhaveemerged. First,the compati-bilityschoolarguesademocraticpoliticalsystemisbestsuitedforcountries pur-suing sustainable growth via its inherent advantagesin protecting the private sphere, ensuring socio-economic rights, and limiting state intervention (Przeworski and Limongi (1993), Acemoglu et al. (2014)). Subject to strong publicchecks,decision-makingprocessesindemocraticstatesessentiallyprevent attemptsofmonopolizinglucrativeeconomicopportunities,thusbenefiting long-termgrowth(Acemogluetal.(2008);AcemogluandRobinson(2013)).Whilethe secondperspective,theconflictschool,suggestsnon-democraticstatesare capa-bleofresisting immediateconsumptiondemands andprohibitingdysfunctional consequences in the decision-making procedurethrough suppressing individual incomesandlabor unions (Przeworski andLimongi (1993); Olson (2000)). De-spite the cost of economic and political freedom, non-democratic rulers could outperform democratic ones in smoothing resource allocation, stimulating in-vestment and, eventually, promoting long-term economic growth (Sirowy and Inkeles (1990); Przeworski and Limongi (1993)). A third view, the sceptical perspective,however,advocatesthenonexistenceofasystematicconnection be-tween democracy and growth (Sirowy and Inkeles (1990)). Typically, because countries with distinct political systems can choose the same economic policies,democracy is not viewed as the key to economic growth according to Barro(1997).
At the empiricallevel, a consensus of the effect of democracy on economic performancehasnotyetbeen reached.Previouscross-countryanalyses,suchas Barro(1996),TavaresandWacziarg(2001)andPerssonandTabellini(2008),did notreachagreementontheexacteffectofdemocracyoneconomicperformance.
Likewise,paneldatastudieshavealsonotsucceededinresolvingtheissue:Rock (2009)andKnutsen(2013)providedsomeevidenceonthepositivedirecteffectof democracy on economic performance in the context of Sub-Saharan African countriesandAsiancountriesrespectively.Withalargepanelof175nationsover the period 1960 to 2010, Acemoglu et al. (2014) also revealed evidence of a significantly positive impact of democracy on growth. However, in con-trast, some others, including Murtin and Wacziarg (2014), and Jacob and Os-ang (2015), failed to observe any significant influence of democracy on economic performance.
It is also worth noting that democracy could be potentially capable of ex-ertingasignificanteffectoflong-termeconomicperformanceindirectlythrough diversechannels.Theindirectchannelsthatexaminedinthepreviousliterature includepropertyrights,incomeinequality,humancapital,governmentsize and tradeopenness (Przeworski and Limongi (1993);Helliwell (1994);Tavares and Wacziarg(2001);BaumandLake(2003);Gerringetal.(2005)).
3. Methodology
Nothwithstanding the popularity of the panel ARDL model, such an ap-proach fails to account for potential error cross-sectional dependence. Thus, in addition to the ARDL model, this study employs the cross-sectionally aug-mented autoregressive distributed lag (CS-ARDL) model (Chudik and Pesaran (2015); Cavalcanti et al. (2015)). In essence, the CS-ARDL model augments the ARDL model with a linear combination of the cross-sectional averages of both the dependent variables and of all the regressors, which aims to capture the cross-sectional correlation in the error term. Typically, as shown by Chudik and Pesaran (2015), both mean group (MG) and pooled mean group (PMG)
estimators are usedin theestimation of theCS-ARDL model. Of course,the time-dimension(T)needstobelargeenoughsothatthemodelcanbeestimated foreachcross-countryunit. Also,asufficientnumberoflaggedcross-section av-eragesshouldbeincludedtoensurethevalidityofthese estimators.
The mean group (MG) estimator initially requires estimating time series equations for each country separately. The coefficients across countries can then can be computed as theunweighted means of theestimated coefficients. Pesaran(2015) suggestedthat theMGestimatorprovidesconsistentestimates oftheaverageoftheparametersgivenasufficientlylargetime-seriesdimension. Atthe same time, it is worth notingthat the MG estimator doesnot impose any restrictions on the cross-sectional parameters and ignores the possibility thatsomeparameterscanbethesameacrosscountries. Giventhefactthatall interceptsandcoefficientscan differfreely,thetechniqueaffordsthemaximum degree of heterogeneity. However, the shortcomings of such an approach are quiteapparent. Althoughconsistent,theMGestimatorislikelytobeinefficient fora smallcross-countrydimension(N).Also,as notedbyArnoldetal.(2011) andSamargandietal.(2015),thisestimatorissensitivetoanycountryoutliers whichmay affecttheaveragesofthecountrycoefficients severely.
An alternative method is the pooled mean group (PMG) estimator pro-posed by Pesaran et al. (1999). In particular, this PMG approach has been appliedwidelyinrecentempiricalgrowthstudies;suchas,LoayzaandRanciere (2006), Arnold et al. (2011),Samargandi et al. (2015), and Cavalcanti et al. (2015),largely due to it being an intermediate routinebetween theaveraging andpoolingmethodsofestimation. Specifically,atwo-stepprocedureisapplied. First,thelong-termslopecoefficientsareestimatedjointlyacrosscountriesvia aconcentrated maximumlikelihood procedure. Second, giventheestimatesof the long-term slope coefficients, intercepts, short-term coefficients, the speed ofadjustment, anderrorvariances are estimatedthroughmaximumlikelihood ona county-by-country basis. Such anapproach essentiallyrestricts the long-termslopecoefficientstobehomogeneousoverthecross-sections,butotherwise allows for heterogeneity. Given a large cross- country dimension, this PMG
approach also providesconsistent estimatesof themean of theshort-term co-efficients across countriesby averagingindividual country coefficients (Loayza andRanciere(2006);Samargandiet al.(2015)).
Itisworthnotingherethatseveralconditionsarerequiredtoensurethe va-lidityofthePMGestimator(Samargandietal.(2015);Cavalcantietal.(2015)). Firstly,theremustexistalong-termrelationshipamongthevariablesofinterest. Thisischeckedviaa negativeandsignificantcoefficientontheerrorcorrection term. Secondly, the dynamic specification of the model should be sufficiently augmentedso thattheregressors canbetreatedasweaklyexogenous. Thirdly, theresultingresidualsfrom theerrorcorrectionmodel mustbe serially uncor-related.
Obviously,theselectionbetweenMGandPMGapproachesrestsonwhether homogeneous slopes can be imposed for the estimated long-term parameters. Hence,it essentiallyinvolvesa trade-offbetween consistencyand efficiency. If the long-term coefficients are, in fact, notequal across countries, the MG es-timates of the mean of long-term coefficients are consistent while the PMG estimatesare inconsistent. However, if thehomogeneity restrictions are valid, estimators that impose cross-country constraints dominate the heterogeneous onesin termsof efficiency. So,when thelong-runcoefficientsarethesame for individualcountries,bothMGandPMGestimatesareconsistent,butonlythe latterare efficient (Arnold et al. (2011);Loayza and Ranciere (2006); Samar-gandiet al.(2015)).
In practice, the PMG approach often is regarded as best available com-promise for consistency and efficiency (Samargandi et al. (2015); Cavalcanti et al.(2015)). Interms of thefinance-growth nexus, previous studies, includ-ing Loayza and Ranciere (2006),Arnold et al. (2011), andSamargandi et al. (2015),have impliedthatthereisahomogeneous long-termrelationshipacross countries. Short-term adjustment, on the other hand, could be affected by country-specificmonetary policies, laws and regulations, as well as macroeco-nomicfundamentalsandhenceisexpectedtobesubjecttoasubstantialdegree ofheterogeneity(Samargandietal.(2015);Cavalcantiet al.(2015)).
The empirical models used for this study are based on the ARDL and CS-ARDL model specifications. We initially employ the error correction form of the ARDL model:
∆yit=ωi+αi(yi,t−1−θ ′ ixi,t−1) + p−1 ! j=1 φij∆yi,t−j+ q−1 ! j=0 δij′ ∆xi,t−j+εit (1)
whereyitis the real per capita output (GDP) for countryiat timet. xitis a 4×1
vector of explanatory variables; domestic investment to output (IN V EST), the secondary school enrollment rate (SSE) from the Cross-National Time-Series Data Archive, the corrected population growth rate (P OP) private credit by financial institutions to output (F IN DEV) and its square (F IN DEV2). All
variables are natural logs. Both long-run and short-run behaviour can be estab-lished from (1). θi represents the long-term equilibrium relationship between
xitandyitwhileφijandδijcapture the short-term dynamics between variables.
αi reflects the speed of convergence of the economy to long-term equilibrium.
Meanwhile, terms in parentheses represent the cointegrating relationship be-tween bebe-tweenxit andyit.
The traditional panel ARDL approach accounts for slope heterogeneity along with different orders of integration in the variables, and can be applied regard-less of whether the regressors are exogenous or not. However, Phillips and Sul (2003) highlighted potential problems if the cross-section correlation in the er-rors is ignored. To overcome this, the panel CS-ARDL model is employed, which involves augmenting the right-hand side variable set with the cross-sectional av-erages of the independent variables, the dependent variables, and a series of their lag values (Pesaran (2006); Chudik et al. (2013); Eberhardt and Pres-bitero (2015)). These additional terms serve to account for the cross-sectional correlation in the error term. The resulting model is:
∆yit=µi+αi(yi,t−1−θ ′ ixi,t−1+α−i 1ηiyt+α−i1ζ ′ ixt) + p−1 ! j=1 φij∆yi,t−j+ q−1 ! j=0 δij′ ∆xi,t−j + p−1 ! j=0 νik∆yt−j+ q−1 ! j=0 ςik′ ∆xt−j+εit (2) where yt and xt are the cross-section averages ofyit and xit. Noticeably, we
distinguish the short-term and long-term behaviors of the cross-sectional cor-relation in equation (2). Following Eberhardt and Presbitero (2015), only the level parts of cross-sectional averages are included in the long-term equilibrium relationship in parentheses. Meanwhile, the long-run coefficients relating yit
andxit; i.e. θi, and the speed of adjustment towards long-run equilibrium, αi,
are the key coefficients of interest. The short-run coefficients, φij and δij are
also reported for completeness.
4. Data
For the empirical work it is necessary to employ data with sufficiently large time and cross-section dimensions to allow for cross-sectional slope heterogeneity and residual cross-sectional dependence (Samargandi et al. (2015); Cavalcanti et al. (2015)). Here we select 1971 to 2007 with the choice of the end date being governed by avoiding excessive noise in the data caused by the Global Financial Crisis.
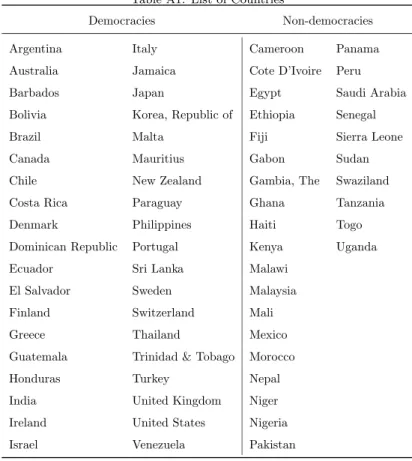
Given such conditions, we only include countries for which there are 37 consecutive observations and, as a result, we end up with a balanced dataset, covering 67 countries over the period 1971 to 2007. The list of countries included can be found in the Appendix.
In addition to the right-hand side variables outlined in the previous sec-tion, we also use the dichotomous democracy indices of Cheibub et al. (2010) and Acemoglu et al. (2014). We define a country as a democracy if both two measures have a value of 1 for at least 19 out of 37 years over the sample
pe-riod. Otherwise, the country is identified as a non-democractic state. On this definition, 38 nations are classified as democracies and 29 as non-democractic.
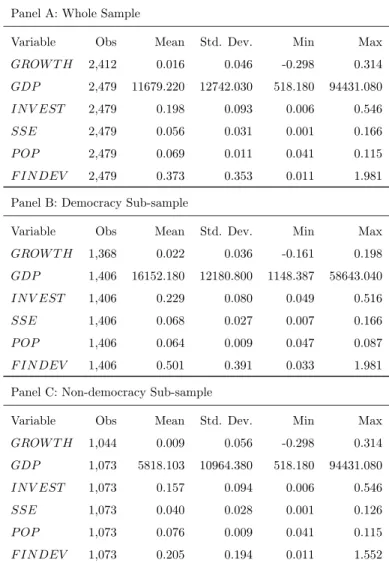
Table 1 below displays the summary statistics of variables for the whole sample and the sub-samples. From Table 1, the average annual growth rate of real per capita output is 1.6% for all 67 nations. The 38 democratic nations have enjoyed a relatively high average output growth rate whereas the non-democratic countries recorded an average annual growth rate of only 0.9%. In terms of the level of per capita output, the democratic sub-sample largely out-performed the nondemocratic subsample. It is worth noting that the variation of the per capita output over the period under investigation is comparable for all countries. In terms of investment and schooling, the democratic nations have experienced higher rates than their non-democratic counterparts. The average population growth rate of 29 non-democratic economies is higher than that of 38 democracies. In addition, despite the fact that the levels of financial devel-opment vary dramatically within the 38 democratic nations, the average private credit indicator is twice as large as that of non-democractic countries.
Table 1: Summary Statistics Panel A: Whole Sample
Variable Obs Mean Std. Dev. Min Max
GROW T H 2,412 0.016 0.046 -0.298 0.314 GDP 2,479 11679.220 12742.030 518.180 94431.080 IN V EST 2,479 0.198 0.093 0.006 0.546 SSE 2,479 0.056 0.031 0.001 0.166 P OP 2,479 0.069 0.011 0.041 0.115 F IN DEV 2,479 0.373 0.353 0.011 1.981
Panel B: Democracy Sub-sample
Variable Obs Mean Std. Dev. Min Max
GROW T H 1,368 0.022 0.036 -0.161 0.198 GDP 1,406 16152.180 12180.800 1148.387 58643.040 IN V EST 1,406 0.229 0.080 0.049 0.516 SSE 1,406 0.068 0.027 0.007 0.166 P OP 1,406 0.064 0.009 0.047 0.087 F IN DEV 1,406 0.501 0.391 0.033 1.981
Panel C: Non-democracy Sub-sample
Variable Obs Mean Std. Dev. Min Max
GROW T H 1,044 0.009 0.056 -0.298 0.314 GDP 1,073 5818.103 10964.380 518.180 94431.080 IN V EST 1,073 0.157 0.094 0.006 0.546 SSE 1,073 0.040 0.028 0.001 0.126 P OP 1,073 0.076 0.009 0.041 0.115 F IN DEV 1,073 0.205 0.194 0.011 1.552
Notes: Summary statistics for original annual variables before log transforma-tions.
5. Estimation Results
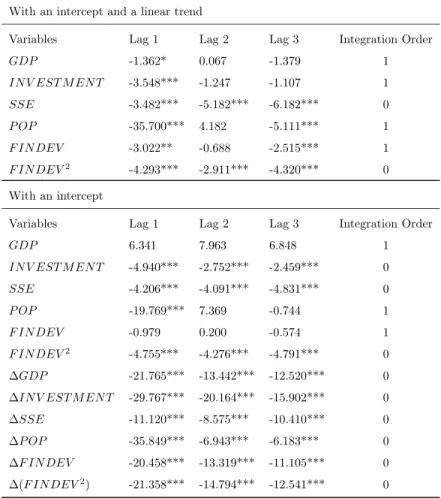
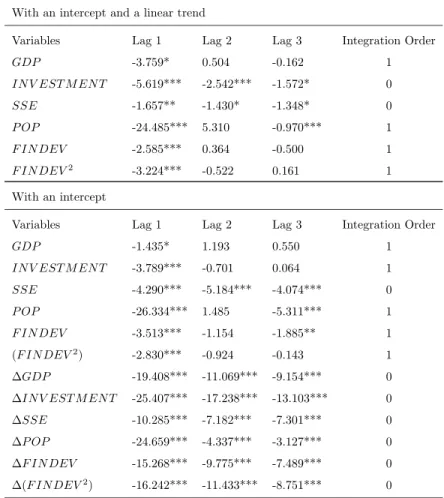
As discussed above, the panel ARDL approach is valid irrespective of whether the underlying variables areI(0) orI(1), or a mixture of the two. Hence, it is important to examine the time series properties of the these. Two panel unit root tests, i.e. Im et al. (2003) (IPS) and Pesaran (2007) cross-sectionally aug-mented IPS (CIPS) tests, are conducted here. The IPS test generally allows for heterogeneous autoregressive parameters for each panel. All panels have a unit root under the null hypothesis of the IPS test. A rejection of the null is an indication that a non-zero fraction of panels is stationary. However, as stated by Cavalcanti et al. (2015) and Eberhardt and Presbitero (2015), the presence of cross sectional dependence threatens the validity of standard panel unit root tests. Hence, we also apply the CIPS test proposed by Pesaran (2007). In par-ticular, this test allows for heterogeneous unit root processes via an augmented the ADF regressions for each country with cross section averages. Tables 2 and 3 report the results of IPS and CIPS tests for GDP, IN V EST, HC, P OP, F IN DEV, and F IN DEV2 for the whole sample. For lags between 1 and 3
two test scenarios are presented, one which includes both an intercept and a linear time trend and another including only the intercept.
From both tables, GDP can be identified asI(1) series while SSE is generally I(0). Overall, mixed results are observed on the time series in levels. However, a panel unit root process is rejected after using first-differences in both the IPS and CIPS tests. As a result, the validity of panel ARDL approach is guaranteed as our estimation model does not containI(2) series. This also holds for both the democratic and non-democratic sub-samples.
Table 2: Im-Pesaran-Shin (2003) IPS Test: Full Sample With an intercept and a linear trend
Variables Lag 1 Lag 2 Lag 3 Integration Order
GDP -1.362* 0.067 -1.379 1 IN V EST M EN T -3.548*** -1.247 -1.107 1 SSE -3.482*** -5.182*** -6.182*** 0 P OP -35.700*** 4.182 -5.111*** 1 F IN DEV -3.022** -0.688 -2.515*** 1 F IN DEV2 -4.293*** -2.911*** -4.320*** 0 With an intercept
Variables Lag 1 Lag 2 Lag 3 Integration Order
GDP 6.341 7.963 6.848 1 IN V EST M EN T -4.940*** -2.752*** -2.459*** 0 SSE -4.206*** -4.091*** -4.831*** 0 P OP -19.769*** 7.369 -0.744 1 F IN DEV -0.979 0.200 -0.574 1 F IN DEV2 -4.755*** -4.276*** -4.791*** 0 ∆GDP -21.765*** -13.442*** -12.520*** 0 ∆IN V EST M EN T -29.767*** -20.164*** -15.902*** 0 ∆SSE -11.120*** -8.575*** -10.410*** 0 ∆P OP -35.849*** -6.943*** -6.183*** 0 ∆F IN DEV -20.458*** -13.319*** -11.105*** 0 ∆(F IN DEV2) -21.358*** -14.794*** -12.541*** 0
Notes: The null hypothesis is that all panels contain unit roots. *** significant at 1%; ** significant at 5%; * significant at 10%.
Table 3: Pesaran (2007) CIPS Test: Full Sample With an intercept and a linear trend
Variables Lag 1 Lag 2 Lag 3 Integration Order
GDP -3.759* 0.504 -0.162 1 IN V EST M EN T -5.619*** -2.542*** -1.572* 0 SSE -1.657** -1.430* -1.348* 0 P OP -24.485*** 5.310 -0.970*** 1 F IN DEV -2.585*** 0.364 -0.500 1 F IN DEV2 -3.224*** -0.522 0.161 1 With an intercept
Variables Lag 1 Lag 2 Lag 3 Integration Order
GDP -1.435* 1.193 0.550 1 IN V EST M EN T -3.789*** -0.701 0.064 1 SSE -4.290*** -5.184*** -4.074*** 0 P OP -26.334*** 1.485 -5.311*** 1 F IN DEV -3.513*** -1.154 -1.885** 1 (F IN DEV2) -2.830*** -0.924 -0.143 1 ∆GDP -19.408*** -11.069*** -9.154*** 0 ∆IN V EST M EN T -25.407*** -17.238*** -13.103*** 0 ∆SSE -10.285*** -7.182*** -7.301*** 0 ∆P OP -24.659*** -4.337*** -3.127*** 0 ∆F IN DEV -15.268*** -9.775*** -7.489*** 0 ∆(F IN DEV2) -16.242*** -11.433*** -8.751*** 0
Notes: The null hypothesis is that the series is a unit root. Cross-section dependence is assumed to be in form of a single unobserved common factor. *** significant at 1%; ** significant at 5%; * significant at 10%.
Table 4 presents results derived from the ECM specification for the full sample. Following Samargandi et al. (2015), a quadratic term of the financial development indicator is included to capture the potential non-linear association between financial development and economic performance. As stated earlier, it is likely that the MG estimator is sensitive to country outliers and inefficient in a panel with a small cross-country dimension. In comparison, the PMG estimator is viewed as offering an attractive trade-offbetween consistency and efficiency. As a result, the long-run coefficients on economic performance is derived from the PMG estimator in the following discussion.
The first column in the table shows the long-run estimates based on the ARDL model. As mentioned by Loayza and Ranciere (2006), the determination of the lag order of the ARDL model generally involves a trade-off between sufficient length and over-extension, given a limited time-series dimension. It is worth noting that various authors have applied different approaches for this lag selection and, indeed, a number of studies have imposed a common lag structure for all countries; e.g. Chudik et al. (2013). Other studies (Arnold et al. (2011); Cavalcanti et al. (2015)) have suggested that the lag order of the ARDL be selected via information criterion. Here, the lag order is selected via the BIC, subject to a maximum lag of 2 on each of the explanatory variables in the ARDL model. This resulted in an ARDL model incorporating a single period lag on each of the variables, as depicted in the first column of the table.
From Column 1, the coefficient on the error correction term is statistically significant at the 1% level with a negative sign. This finding suggests that the system reverts to the long-run values following a shock, indicating cointegration among the variables. Also, per capita output is positively and significantly related to domestic investment and human capital, and negatively related to the corrected rate of population growth. Such findings are generally consistent with the theoretical expectations of the augmented Solow model of Mankiw et al. (1992). Meanwhile, the estimated coefficients of both the financial development indicator and of its quadratic term turn out to be significantly negative. This implies that any increase in the private credit ratio would lead to a decrease in
Table 4: PMG Estimates of the Long-Run Effects on Economic Performance: Full Sample ARDL CS-ARDL CS-ARDL
No. of lagged CA 2 3 Long Run Equation
IN V EST 0.756*** 0.304*** 0.527*** (0.054) (0.015) (0.025) SSE 0.348*** 0.160*** 0.134*** (0.042) (0.022) (0.030) P OP -3.662*** -0.129** -1.574*** (0.324) (0.057) (0.139) F IN DEV -0.158** 0.031*** 0.071** (0.064) (0.011) (0.029) F IN DEV2 -0.054*** -0.039*** -0.017*** (0.008) (0.005) (0.005) Short Run Equation
ECT -0.038*** -0.127*** -0.074*** (0.007) (0.025) (0.022) ∆IN V EST 0.083*** 0.069*** 0.057*** (0.013) (0.014) (0.016) ∆SSE 0.030 0.030 -0.007 (0.029) (0.034) (0.044) ∆P OP 0.331 0.539 0.979** (0.210) (0.402) (0.437) ∆F IN DEV -0.067* -0.147*** -0.103 (0.037) (0.053) (0.065) ∆(F IN DEV2) -0.014 0.000 0.023 (0.015) (0.022) (0.031) Constant 0.058*** 0.555*** 0.607*** (0.008) (0.107) (0.173) Obs 2412 2345 2278 Pesaran CD 15.610 -0.455 -1.561 P-Value [0.000] [0.650] [0.119] Notes: Estimates based on the error correction model. Standard errors are in parentheses. *** significant at 1%; ** significant at 5%; * significant at 10%.
long-run real average output.
The validity of the PMG estimates in Column 1 is contingent on the as-sumption that the errors are cross-sectionally independent. In order to test this, the cross-section dependence (CD) test was conducted. Specifically, this test uses the correlation-coefficients between the time-series for each panel mem-ber. Under the null hypothesis of cross-section independence, the CD statistic is standard normally distributed. Here, the null is rejected at the conventional sig-nificance levels. This then implies that failing to account for error cross-country dependence renders the accuracy of PMG estimates questionable.
To overcome this, the CS-ARDL methodology is employed, which involves including additional lagged cross-sectional averages of both the dependent vari-ables and of all regressors in the estimation. A crucial step in the usage of the CS-ARDL model is the selection of the lag order for the cross-sectional aver-ages. It is widely accepted that the number of lagged cross-section averages should be sufficient to overcome the concerns on cross-sectional dependence of the residual. Guidance from previous studies, such as, Chudik and Pesaran (2015) and Eberhardt and Presbitero (2015), would suggest a lag length of 2 in this application, whereas others, Chudik and Pesaran (2015) for instance, the lag length should not exceed 3. Both scenarios are presented in our results.
Columns 2 and 3 in the table show the PMG estimates of these two CS-ARDL model specifications. Here, the null hypothesis of cross-section indepen-dence in the Pesaran CD test is not rejected, suggesting that any cross-sectional dependence caused by common factors have been controlled for when the re-gression is augmented with the lagged cross-sectional averages. As a result, the PMG estimates under the CS-ARDL model are preferred.
In both Columns 2 and 3, the estimated coefficient for the error correction term is, again, negative and significant at the 1% level. Under both specifica-tions, the estimated coefficients of IN V EST, SSE, and P OP are significant with the expected signs. The results show that a one percent increase in the proportion of domestic investment over output is associated with an average increase in steady-state per capita GDP of over 0.3 percent. Meanwhile, a one
percent increase in the rate of secondary school enrollment is associated with an average increase in steady-state level of real per capita output by more than 0.1 percent. A positive and significant effect of the level of financial development on the level of output performance is observed in both Columns 2 and 3. Mean-while, the estimated coefficient on the quadratic term of financial development indicator is negative and significant at the 1% level. Such a finding supports pervious empirics, including Shen and Lee (2006) and Arcand et al. (2015).
After controlling for cross-country heterogeneity and error cross-country de-pendence, the relationship between financial development and economic perfor-mance is found to be bell-shaped for the 69 countries examined here. Such a finding suggests that more private credit raises output performance, but only at low levels of credit and that high levels of private credit could exert a detri-mental effect on long-run economic performance. The ‘turning point’ of the effect is estimated to occur at around 150% of GDP. Within the sample used here there are several examples where financial development exceeds this fig-ure. Thus, for example, the ratio of private credit to GDP of both Malaysia and Thailand reached 150% during the Asian financial crisis of 1997 to 1998. Meanwhile, taking the examples of Canada, Denmark, Switzerland, the United Kingdom, and the United States, private credit grew steadily from the early 2000s and exceeded 150% in 2007, the year before the global financial crisis. Another interesting example is Japan. During the period of its economic cri-sis from late 1980s to 2007, Japan’s private credit ratio never dropped below 150%. Noticeably, all of these countries, with the exception of Malaysia, are democracies.
Turning to the democratic and non-democratic sub-samples, the results for these two groups of countries are presented in Tables 5 and 6, where the first columns of both tables give the PMG estimates derived on the basis of a sin-gle lag for all variables. Columns 2 and 3 of these tables give the CS-ARDL results incorporating 2 or 3 lags of the cross-section averages of dependent and explanatory variables. As before, the coefficient on the error correction term is always negative and statistically significant and, as expected, the estimated
coefficient on IN V EST turns out to be significantly positive in the long run, while that ofP OP is negative using both ARDL and CS-ARDL approaches.
The PMG estimates in Table 5 show mixed results, especially with regard to financial development. From first two columns, the estimated coefficient for F IN DEV is positive and statistically significant. However, it is worth noting that the null hypothesis of cross-sectional independence under the Pesaran CD test is strictly rejected. Column 3, reveals another another rejection of the null for the CD test, although error cross-section dependence is reduced as the statistic drops dramatically to around -2. Thus, these appear to provide the most accurate estimates and show that the coefficient estimate onF IN DEV is negative, albeit statistically insignificant. Also, the coefficient on the square of the financial development is positive, although this estimate fails to achieve statistical significance.
Table 6 presents the estimates for the non-democratic countries. Here, the results in the first column reveal some evidence of a positive, but insignifi-cant, effect of financial system development on long-term economic performance. However, these results fail to account for error cross-section dependence. The results for the CS-ARDL model presented in Columns 2 and 3 suggest that the use of cross-section averages largely reduces residual cross-section depen-dence. In particular, as the Pesaran CD test statistics drop to around -0.5, no evidence of error cross-section dependence is uncovered in these two columns. Therefore, concerns over the influence of macroeconomic linkages and common shocks are eliminated. From last two columns, the estimated effects on per capita output of physical capital investment and human capital are all statis-tically significant with the expected signs. Also, the estimated coefficient on F IN DEV is positive, and significant. In this specification, the square of the financial development term is also revealed to be positive and significant.
Table 5: PMG Estimates of the Long-Run Effects on Economic Performance: Democratic Sub-sample
ARDL CS-ARDL CS-ARDL No. of lagged CA 2 3 Long Run Equation
IN V EST 0.552*** 0.922*** 0.709*** (0.053) (0.134) (0.050) SSE 0.219*** -0.446*** -0.632*** (0.042) (0.106) (0.074) P OP -1.225*** -6.414*** -1.877*** (0.234) (0.801) (0.198) F IN DEV 0.965** 1.914*** -0.031 (0.095) (0.260) (0.045) F IN DEV2 0.333*** 0.737*** 0.018 (0.032) (0.106) (0.019) Short Run Equation
ECT -0.048*** -0.015* -0.051*** (0.014) (0.009) (0.020) ∆IN V EST 0.118*** 0.116*** 0.091*** (0.018) (0.018) (0.019) ∆SSE 0.009 -0.025 0.016 (0.034) (0.042) (0.049) ∆P OP 0.098 0.069 0.621 (0.307) (0.386) (0.564) ∆F IN DEV -0.023 -0.059 0.032 (0.046) (0.064) (0.074) ∆(F IN DEV2) -0.017 0.038 0.069 (0.023) (0.037) (0.042) Constant 0.403*** 0.555*** 2.194*** (0.109) (0.107) (0.853) Obs 1368 1330 1292 Pesaran CD 16.721 8.395 -2.482 P-Value [0.000] [0.000] [0.013] Notes: Estimates based on the error correction model. Standard errors are in parentheses. *** significant at 1%; ** significant at 5%; * significant at 10%.
Table 6: PMG Estimates of the Long-Run Effects on Economic Performance: Non-democratic Sub-sample
ARDL CS-ARDL CS-ARDL No. of lagged CA 2 3 Long Run Equation
IN V EST 0.494*** 0.247*** 0.192*** (0.041) (0.023) (0.013) SSE 0.190*** 0.366*** 0.047* (0.022) (0.048) (0.026) P OP -0.952*** -0.833*** 1.024*** (0.169) (0.172) (0.083) F IN DEV 0.126 0.584*** 0.482*** (0.083) (0.065) (0.058) F IN DEV2 -0.019 0.103*** 0.126*** (0.013) (0.013) (0.016) Short Run Equation
ECT -0.070*** -0.114*** -0.174*** (0.021) (0.035) (0.067) ∆IN V EST 0.032* 0.043* 0.009 (0.019) (0.024) (0.026) ∆SSE 0.064 0.084 0.125 (0.048) (0.053) (0.101) ∆P OP 0.361 0.792 0.518 (0.276) (0.581) (1.199) ∆F IN DEV -0.169*** -0.275*** -0.070 (0.055) (0.097) (0.160) ∆(F IN DEV2) -0.034*** -0.053** -0.002 (0.014) (0.026) (0.047) Constant 0.519*** 0.744*** -1.641*** (0.148) (0.229) (0.590) Obs 1044 1015 986 Pesaran CD 2.110 -0.573 -0.426 P-Value [0.035] [0.567] [0.670] Notes: Estimates based on the error correction model. Standard errors are in parentheses. *** significant at 1%; ** significant at 5%; * significant at 10%.
6. Concluding Remarks
In sum, the PMG results presented here for the full sample support the pos-itive effect of financial development on economic performance and also uphold the non-linearity of this effect, with the results suggesting a turning point in the bell shaped function at around 150% of GDP. However, partitioning the sam-ple of countries into democratic and non-democratic nations reveals noticeable differences between the two groups.
For the democratic nations, although the CS-ARDL model with 2 lags did result in a large positive coefficient estimate onF IN DEV, when an additional 3-period lag was introduced, in the most robust of our estimated specifications, the statistical significance of the coefficient disappeared. Furthermore, although the coefficient on the square of this variable was significant in the CS-ARDL 2 model, it was positive suggesting an ever-increasing rate of the effect of finan-cial development on growth, contrary to expectations. This coefficient was not significant in the CS-ARDL 3 model.
Turning to the non-democratic sub-sample,F IN DEV was both positive and statistically significant in both CS-ARDL models. The square of this variable was also significant in both models but was, once again, positive in both spec-ifications. Taken together these results imply that, for non-democratic states, financial development has a positive effect on economic performance and that the strength of this effect increases along with the level of financial development. Thus, for these countries, the evidence presented here does not uphold the often noted bell shaped relationship between finance and growth.
References
Acemoglu, D., Johnson, S., Robinson, J.A., Yared, P., 2008. Income and democ-racy. The American Economic Review 98, 808–842.
Acemoglu, D., Naidu, S., Restrepo, P., Robinson, J.A., 2014. Democracy does cause growth. Technical Report. National Bureau of Economic Research. Acemoglu, D., Robinson, J.A., 2013. Why nations fail: the origins of power,
prosperity, and poverty. Crown Business.
Arcand, J.L., Berkes, E., Panizza, U., 2015. Too much finance? Journal of Economic Growth 20, 105–148.
Arnold, J., Bassanini, A., Scarpetta, S., 2011. Solow or lucas? testing speed of convergence on a panel of oecd countries. Research in Economics 65, 110–123. Barro, R.J., 1996. Democracy and growth. Journal of Economic Growth 1,
1–27.
Barro, R.J., 1997. Determinants of economic growth: a cross-country empirical study. Technical Report.
Baum, M.A., Lake, D.A., 2003. The political economy of growth: democracy and human capital. American Journal of Political Science 47, 333–347. Beck, T., Degryse, H., Kneer, C., 2014. Is more finance better? disentangling
intermediation and size effects of financial systems. Journal of Financial Sta-bility 10, 50–64.
Beck, T., Demirg¨u¸c-Kunt, A., Levine, R., 2000. A new database on the structure and development of the financial sector. The World Bank Economic Review 14, 597–605.
Beck, T., Levine, R., 2004. Stock markets, banks, and growth: panel evidence. Journal of Banking & Finance 28, 423–442.
Cavalcanti, D.V., Tiago, V., Mohaddes, K., Raissi, M., 2015. Commodity price volatility and the sources of growth. Journal of Applied Econometrics 30, 857–873.
Cecchetti, S.G., Kharroubi, E., 2012. Reassessing the impact of finance on growth. BIS Working Paper No. 381 .
Cheibub, J.A., Gandhi, J., Vreeland, J.R., 2010. Democracy and dictatorship revisited. Public Choice 143, 67–101.
Chudik, A., Mohaddes, K., Pesaran, M.H., Raissi, M., 2013. Debt, inflation and growth: robust estimation of long-run effects in dynamic panel data models. Technical Report.
Chudik, A., Pesaran, M.H., 2015. Common correlated effects estimation of heterogeneous dynamic panel data models with weakly exogenous regressors. Journal of Econometrics 188, 393–420.
Courn`ede, B., Denk, O., 2015. Finance and economic growth in OECD and G20 countries. Technical Report.
Durlauf, S.N., Johnson, P.A., Temple, J.R., 2005. Growth econometrics. Hand-book of Economic Growth 1, 555–677.
Eberhardt, M., Presbitero, A.F., 2015. Public debt and growth: heterogeneity and non-linearity. Journal of International Economics 97, 45–58.
Eberhardt, M., Teal, F., 2011. Econometrics for grumblers: a new look at the literature on cross-country growth empirics. Journal of Economic Surveys 25, 109–155.
Gerring, J., Bond, P., Barndt, W.T., Moreno, C., 2005. Democracy and eco-nomic growth: a historical perspective. World Politics 57, 323–364.
Helliwell, J.F., 1994. Empirical linkages between democracy and economic growth. British Journal of Political Science 24, 225–248.
Im, K.S., Pesaran, M.H., Shin, Y., 2003. Testing for unit roots in heterogeneous panels. Journal of Econometrics 115, 53–74.
Jacob, J., Osang, T., 2015. Democracy and growth: a dynamic panel data study. Technical Report.
Kindleberger, C.P., 1978. Economic response: comparative studies in trade, finance, and growth. Harvard University Press.
King, R.G., Levine, R., 1993a. Finance and growth: Schumpeter might be right. The Quarterly Journal of Economics 108, 717–737.
King, R.G., Levine, R., 1993b. Finance, entrepreneurship and growth. Journal of Monetary Economics 32, 513–542.
Knutsen, C.H., 2013. Democracy, state capacity, and economic growth. World Development 43, 1–18.
Law, S.H., Singh, N., 2014. Does too much finance harm economic growth? Journal of Banking & Finance 41, 36–44.
Levine, R., Loayza, N., Beck, T., 2000. Financial intermediation and growth: causality and causes. Journal of Monetary Economics 46, 31–77.
Loayza, N., Ranciere, R., 2006. Financial development, financial fragility, and growth. Journal of Money, Credit and Banking , 1051–1076.
Madsen, J.B., Raschky, P.A., Skali, A., 2015. Does democracy drive income in the world, 1500–2000? European Economic Review 78, 175–195.
Mankiw, N.G., Romer, D., Weil, D.N., 1992. A contribution to the empirics of economic growth. The Quarterly Journal of Economics 107, 407–437. McKinnon, R.I., 1973. Money and capital in economic development. The
Menyah, K., Nazlioglu, S., Wolde-Rufael, Y., 2014. Financial development, trade openness and economic growth in african countries: New insights from a panel causality approach. Economic Modelling 37, 386–394.
Minsky, H.P., 1991. Financial crises: systemic or idiosyncratic. Technical Re-port.
Murtin, F., Wacziarg, R., 2014. The democratic transition. Journal of Economic Growth 19, 141–181.
Olson, M., 2000. Power and prosperity: outgrowing communist and capitalist dictatorships. Basic Books.
Persson, T., Tabellini, G., 2008. The growth effects of democracy: is it het-erogenous and how can it be estimated? Technical Report. Institutions and Economic Performance, Harvard University Press.
Pesaran, M.H., 2006. Estimation and inference in large heterogeneous panels with a multifactor error structure. Econometrica 74, 967–1012.
Pesaran, M.H., 2007. A simple panel unit root test in the presence of cross-section dependence. Journal of Applied Econometrics 22, 265–312.
Pesaran, M.H., 2015. Time series and panel data econometrics. Oxford Univer-sity Press.
Pesaran, M.H., Shin, Y., Smith, R.P., 1999. Pooled mean group estimation of dynamic heterogeneous panels. Journal of the American Statistical Associa-tion 94, 621–634.
Phillips, P.C., Sul, D., 2003. Dynamic panel estimation and homogeneity testing under cross section dependence. The Econometrics Journal 6, 217–259. Przeworski, A., Limongi, F., 1993. Political regimes and economic growth. The
Rock, M.T., 2009. Has democracy slowed growth in asia? World Development 37, 941–952.
Samargandi, N., Fidrmuc, J., Ghosh, S., 2015. Is the relationship between finan-cial development and economic growth monotonic? evidence from a sample of middle-income countries. World Development 68, 66–81.
Schumpeter, J.A., 1912. The theory of economic development. Cambridge, MA: Harvard University Press.
Shaw, E.S., 1973. Financial deepening in economic development. New York, NY (USA) Oxford Univ. Press.
Shen, C.H., Lee, C.C., 2006. Same financial development yet different economic growth: why? Journal of Money, Credit and Banking , 1907–1944.
Sirowy, L., Inkeles, A., 1990. The effects of democracy on economic growth and inequality: A review. Studies in Comparative International Development 25, 126–157.
Smith, A., 1776. An inquiry into the nature and causes of the wealth of nations: volume One. London: printed for W. Strahan; and T. Cadell, 1776.
Tavares, J., Wacziarg, R., 2001. How democracy affects growth. European Economic Review 45, 1341–1378.
Appendix
Table A1: List of Countries
Democracies Non-democracies Argentina Italy Cameroon Panama Australia Jamaica Cote D’Ivoire Peru Barbados Japan Egypt Saudi Arabia Bolivia Korea, Republic of Ethiopia Senegal Brazil Malta Fiji Sierra Leone Canada Mauritius Gabon Sudan Chile New Zealand Gambia, The Swaziland Costa Rica Paraguay Ghana Tanzania Denmark Philippines Haiti Togo Dominican Republic Portugal Kenya Uganda Ecuador Sri Lanka Malawi
El Salvador Sweden Malaysia Finland Switzerland Mali Greece Thailand Mexico Guatemala Trinidad & Tobago Morocco Honduras Turkey Nepal India United Kingdom Niger Ireland United States Nigeria Israel Venezuela Pakistan