Functional Studies on Primary
Tubular Epithelial Cells Indicate a
Tumor Suppressor Role of SETD2 in
Clear Cell Renal Cell Carcinoma
1Jun Li*, Joost Kluiver†,‡, Jan Osinga*, Helga Westers*, Maaike B van Werkhoven§, Marc A. Seelen§, Rolf H. Sijmons*,
Anke van den Berg†,‡ and Klaas Kok*
*Department of Genetics, University of Groningen, University Medical Center Groningen, PO Box 30.001, 9700 RB Groningen, the Netherlands;†Department of Pathology, University of Groningen, University Medical Center Groningen, PO Box 30.001, 9700 RB Groningen, the Netherlands;‡Department of Medical Biology, University of Groningen, University Medical Center Groningen, PO Box 30.001, 9700 RB Groningen, the Netherlands;§Department of Nephrology, University of Groningen, University Medical Center Groningen, PO Box 30.001, 9700 RB Groningen, the Netherlands
Abstract
SET domain-containing 2 (SETD2) is responsible for the trimethylation of histone H3 lysine36 (H3K36me3) and is one of the genes most frequently mutated in clear cell renal cell carcinoma (ccRCC). It is located at 3p21, one copy of which is lost in the majority of ccRCC tumors, suggesting thatSETD2might function as a tumor suppressor gene. However, the manner in which loss of SETD2 contributes to ccRCC development has not been studied in renal primary tubular epithelial cells (PTECs). Therefore, we studied the consequences of SETD2 knockdown through lentiviral shRNA in human PTECs. Consistent with its known function, SETD2 knockdown (SETD-KD) led to loss of H3K36me3 in PTECs. In contrast to SETD2 wild-type PTECs, which have a limited proliferation capacity; the SETD2-KD PTECs continued to proliferate. The expression profiles of SETD2-KD PTECs showed a large overlap with the expression profile of early-passage, proliferating PTECs, whereas nonproliferating PTECs showed a significantly different expression profile. Gene set enrichment analysis revealed a significant enrichment of E2F targets in SETD2-KD and proliferating PTECs as compared with nonproliferating PTECs and in proliferating PTEC compared with SETD2-KD. The SETD2-KD PTECs maintained low expression ofCDKN2Aand high expression ofE2F1, whereas their levels changed with continuing passages in untreated PTECs. In contrast to the nonproliferating PTECs, SETD2-KD PTECs showed noβ-galactosidase staining, confirming the protection against senescence. Our results indicate thatSETD2inactivation enables PTECs to bypass the senescence barrier, facilitating a malignant transformation toward ccRCC.
Neoplasia (2016) 18, 339–346
Introduction
Clear cell renal cell carcinoma (ccRCC) represents the most common and lethal subtype of kidney cancer, accounting for 80% to 90% of renal cell carcinomas and 3% of all cancers [1]. A better understanding of the processes that underlie ccRCC development might help in designing more successful ways to treat these tumors [2]. ccRCC arises from the primary tubular epithelial cells (PTECs) of the kidney [3], but the malignant transformation process is poorly understood. The most common genomic aberration in ccRCC is 3p loss [4], indicating the presence of ccRCC-associated tumor www.neoplasia.com
Address all correspondence to: Klaas Kok, UMCG, Department of Genetics, POSTBUS 30.001, 9700 RB Groningen, the Netherlands.
E-mail:j.li@umcg.nl 1
The research was supported by the Graduate School of Medical Sciences, University Medical Center Groningen, University of Groningen. J. L. was supported by a China Scholarship Council of research fellowship.
Received 22 January 2016; Revised 7 April 2016; Accepted 14 April 2016
© 2016 The Authors. Published by Elsevier Inc. on behalf of Neoplasia Press, Inc. This is an open access article under the CC BY-NC-ND license (http://creativecommons.org/licenses/by-nc-nd/4.0/). 1476-5586
suppressor genes (TSGs). The first TSG identified in ccRCC was Von Hippel–Lindau (VHL)[5], which maps to 3p25 and is mutated in approximately 55% of tumors[6]. In recent years, three additional 3p genes (PBRM1,BAP1, and SETD2) have been identified as being frequently mutated in ccRCC. Mutations in SETD2 were first reported in two independent studies. Dalgliesh et al. identified SETD2-inactivating mutations in 15/342 ccRCC cases [6], and we identifiedSETD2-inactivating mutations in 5/10 ccRCC-derived cell lines[7].SETD2-inactivating mutations occur at a frequency of 11% in ccRCC[8,9]. According to the Catalogue of Somatic Mutations in Cancer database (http://cancer.sanger.ac.uk/cosmic, accessed in October 2015), ccRCC is the only tumor type that SETD2 ranks into the top five mutated genes. Together, these studies support the relevance ofSETD2inactivation in the development of ccRCC. Loss of one allele ofSETD2and functional inactivation of the second allele by a point mutation are consistent with Knudson’s classic two-hit model to inactivate TSGs.
SETD2 is a histone methyltransferase responsible for the histone H3 lysine 36 trimethylation (H3K36me3), a histone mark enriched at the gene body of actively transcribed genes[10]. The SRI domain of SETD2 interacts with RNA-polymerase II, causing SETD2 to be present during transcription. Many of the biological processes in which SETD2 has been suggested to participate revert to its presence during the transcriptional process. In ccRCC-derived cell lines, loss of 3p and mutation of the remainingSETD2allele result in a complete loss of H3K36me3, whereas cell lines with one functional SETD2 allele show at most slightly reduced or even normal H3K36me3 levels [7]. It is still unclear howSETD2inactivation might contribute to the pathogenesis of ccRCC. We aimed to determine ifSETD2acts as a TSG in ccRCC and how SETD2 inactivation contributes to the malignant transformation.
Material and Methods
A schematic representation of the workflow and detailed experimental procedures are presented in the Supplementary material and methods.
Isolation of PTECs and Cell Cultures
PTECs were isolated from the healthy human kidney cortex segment. The isolation procedures and phenotype identification were performed as previously described[11]. Both PTECs and HKC8 were maintained in Dulbecco’s modified Eagle’s medium/F-12 GLUTMAX-1 containing 10% fetal bovine serum (FBS), 100 U/ml of penicillin, 100μg/ml of streptomycin, 1% Insulin-Transferrin-Selenium, and 5 ng/ml of epidermal growth factor (EGF). Human embryonic kidney 293T (HEK293T) cells were cultured in Dulbecco’s modified Eagle’s medium supplemented with 10% fetal bovine serum (FBS), 100 U/ml of penicillin, and 100μg/ml of streptomycin (all used for cell culturing are from Sigma-Aldrich, St. Louis, MO). All the cells were maintained at 37°C under humidified air containing 5% CO2.Mycoplasma, bacteria, and fungi were tested as negative in these cultures.
ShRNA Constructs, Lentiviral Transductions, and Growth
Competition Assay
Oligos (Eurogentec, Seraing, Belgium) to generate shRNA constructs were cloned into the pGreenpuro lentivector (Systems Biosciences, Mountain View, CA) using standard procedures (see shRNA construct sequences in Supplementary Table 1). Lentiviral particles were produced by calcium phosphate–mediated transfection of HEK293T cells. Transduction of target cells was performed with multiple dilutions of concentrated virus stock in the presence of 4 μg/ml of polybrene
(Sigma-Aldrich). Green fluorescent protein (GFP) was measured on the FACS Calibur flow cytometer (BD Biosciences, San Jose, CA), and data were analyzed with Kaluza Flow Analysis Software v 1.3 (Beckman Coulter, Brea, CA). Cultures with a high percentage of transduced cells were used to confirm knockdown of SETD2. Cell cultures with a mix of GFP+ and GFP− cells were used in the GFP-competition assay. Percentages of GFP+ cells were normalized to the percentage of GFP+ cells at the first measurement. GFP was measured at indicated time points.
RNA Isolation and Reverse-Transcription Quantitative
Polymerase Chain Reaction (RT-qPCR)
Total RNA was isolated by Gene JET RNA purification kit (Fermentas, St. Leon-Rot, Germany). RNA quality was evaluated on an HT RNA LabChip GX/GXII kit (Caliper GX; Life Sciences, Hopkinton, MA). To quantify the expression levels of target genes, equal amount of RNA was synthesized to first-strand cDNA using the RevertAid H Minus First Strand cDNA synthesis kit (Thermo Fisher Scientific, Rockford, IL). Quantitative PCR was performed on the ABI 7900HT Fast Real-Time PCR system (Applied Biosystems, Foster City, CA) with iTaq Universal SYBR Green Supermix (Bio-Rad, Hercules, CA), and the results were analyzed by SDS 1.3.0 software (Life Technologies, Foster City, CA). Unpaired one-tailedttests were used to determine whether significant changes inSETD2levels were obtained upon shRNA-mediated knockdown (see RT-qPCR primers in Supplementary Table 1).
Histone Isolation and Western Blot Analysis
Cells were lysed in TEB buffer (PBS containing 0.5% Triton X 100 [v/v], 2 mM phenylmethylsulfonyl fluoride, and 0.02% [w/v] NaN3), and histones were isolated by acid extraction. Histones extracts were separated with 15% sodium dodecyl sulfate polyacrylamide gel electrophoresis and transferred to a PVDF membrane (Roche, Mannhein, Germany) for blotting. The proteins of interest were probed with antibodies against tri-methyl-histone H3 (Lys36) (1:1000; Cell Signaling, Danvers, MA) or histone H3 (1:1000; Cell Signaling). Target proteins were detected with HRP-conjugated Alexa Fluor 488 Donkey Anti-Rabbit IgG antibody (H + L) (1:10,000; Life Technologies, NY). Positive staining was visualized by incubation with Lumi-light Western Blotting substrate (Roche). Images were captured by the ChemiDOC MP imaging system with Image lab v4.1 software (Bio-Rad).
Microarray and Expression Analysis
A custom-designed microarray was used for expression profiling (Agilent ID 050524), and the procedure was performed according to the manufacturer’s instructions (Agilent Technologies, Santa Clara, CA). Total RNA was labeled using the Low Input Quick Amp Labeling Kit and the Cyanine5 CTP Dye Pack (Agilent Technologies). cRNA was purified using the RNeasy Mini Kit (Qiagen, Valencia, CA), quantified on a NanoDrop 1000 spectrophotometer (Thermo Fisher Scientific), and hybridized on the custom array using the Gene Expression Hybridization Kit (Agilent Technologies). Arrays were scanned with the Agilent DNA Microarray Scanner and analyzed with Agilent Feature Extraction software v 10.7.3.1. The resulting raw data were analyzed with GeneSpring GX 13.1.1 software (Agilent Technologies). To exclude a possible bias caused by the multiplicity of infection (MOI), we performed principle component analysis and compared wild-type (WT) to nontargeting (NT) PTECs at both day 6 and day 16. In addition, we performed a moderated t test with Bonferroni family-wise error rate (FWER) multiple testing correction.
One-way analysis of variance (ANOVA) using Tukey’s honestly significant difference post hoc test was used to identify differentially expressed genes between the three experimental groups, and Bonferroni FWER adjustedPvaluesb.05 were considered statistically significant. The experimental groups were 1) proliferating PTECs at day 6 including both WT and NT PTECs, 2) nonproliferating WT and NT PTECs at day 16, and 3) SETD2-KD PTECs at day 25. Microarray data are available through the GEO database (GSE72792).
Senescence
β
-Galactosidase (
β
-gal) and Immunohistochemistry
(IHC) Staining
The senescenceβ-gal Staining Kit (Cell Signaling) was used according to the manufacturer's instructions. Images were captured by TissueFax (TissueGnostics, Vienna, Austria) equipped with Zeiss objective LD "Plan-Neofluar" 20 ×/0.4 Corr Dry, Ph2 objectives. Formaldehyde- or acetone-fixed cells were processed for IHC staining by standard procedures. Representative images were captured by an Olympus BX41 microscope (Olympus, Hamburg, Germany). Antibodies used in the staining are listed in the Supplementary material and methods. Results and Discussion
SETD2 Depletion in Immortalized Kidney Epithelial Cell Lines
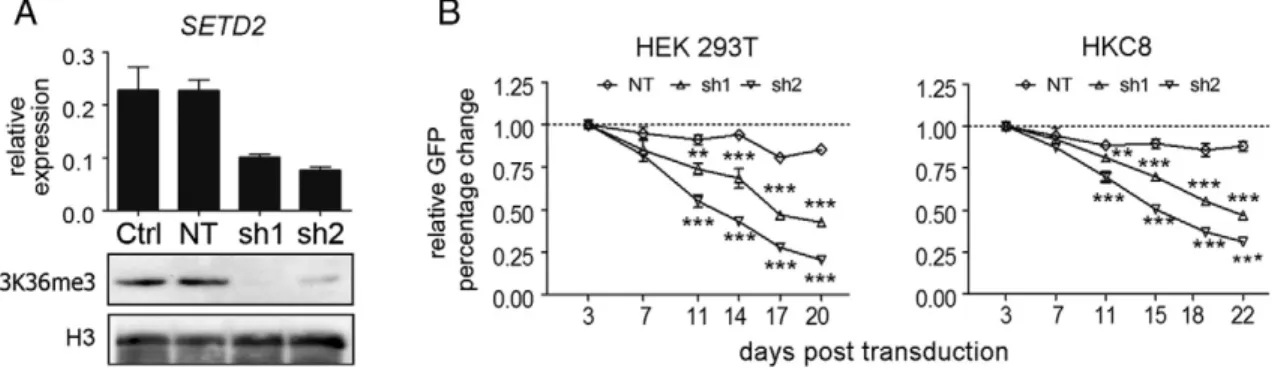
To study the role of SETD2 in epithelial cells, we transduced HEK293T and HKC8 cells with lentiviruses containing SETD2-targeting or NT shRNAs coexpressed with GFP. Both SETD2 shRNA constructs induced a 60% to 70% decrease inSETD2mRNA levels. A virtual absence of H3K36me3, commonly used as a measure of SETD2 loss[10],in SETD2 shRNA-treated HEK293 cells confirmed efficient downregulation of SETD2 at the protein level (Figure 1A). To study the effect of SETD2 knockdown on cell growth, we performed a GFP competition assay in both cell lines. In HEK293T cells, a significant reduction of GFP+ SETD2-KD cells (60%-80%) was observed at day 20 for both shRNA constructs relative to the GFP+ percentage at day 3. In HKC8 cells, the reduction was also significant, although less pronounced, with a drop of 40% to 60%. No significant differences were observed in the growth competition assays for the NT-shRNA construct transduced cell lines (Figure 1B). Thus, SETD2 depletioncaused a marked decrease in cell growth in immortalized human embryonic kidney (HEK293T) cells and kidney epithelial (HKC8) cells. The decrease in GFP+ cells might be related to a reduced transcription elongation rate of multiexon protein coding genes as a consequence of loss of H3K36me3 [12]. These findings are not consistent with a tumor suppressor function of SETD2 in ccRCC. However, the impact of SETD2 knockdown in these immortalized and highly proliferating kidney cell lines might not represent an optimal model to study the tumor-suppressing function ofSETD2in ccRCC.
SETD2-KD in PTECs
To further study the possible tumor suppressor function ofSETD2 in ccRCC oncogenesis, we switched to renal primary tubular epithelial cells (PTECs), which are generally regarded as the normal counterparts of ccRCC[3]. These PTECs can be isolated from the kidney cortex segment and cultured in vitro for a limited number of population doublings[13]. We isolated PTECs and authenticated their phenotype as described previously[11].
Early-passage PTECs derived from three different individuals were transduced with viral particles containing SETD2-shRNA constructs. Again, both constructs induced a significant decrease in SETD2 mRNA levels (40%-60%) and an almost complete loss of H3K36me3 (Figure 2A). This loss of H3K36me3 is consistent with a complete functional loss of SETD2 as observed in ccRCC cell lines caused by loss of one allele and an inactivating mutation in the remainingSETD2allele [7]. We next assessed the effect of SETD2 knockdown in a GFP-competition assay. At day 22 of the growth competition assay, the proportion of GFP+ cells showed a significant increase of 140% and 70% in SETD2-sh1 and SETD2-sh2 transduced PTECs, respectively, over the GFP− cells compared with day 2. The percentage of GFP+ cells in the NT-shRNA transduced PTECs (NT-PTECs) did not show a significant change over time (Figure 2B). These experiments revealed an apparent growth advantage of SETD2-KD PTECs relative to SETD2-WT PTECs consistent with a possible tumor suppressor function of SETD2. The proliferative capacity of untreated and NT-shRNA– treated PTECs gradually decreased, and cells stopped proliferating at
Figure 1.SETD2 knockdown in immortalized kidney epithelial cell lines. (A) Transduction at high MOI of HEK293T cells with sh1 and sh2 directed against SETD2 results in a decreased level ofSETD2mRNA determined by RT-qPCR. Results are presented as 2−Ct;HPRTwas used for normalization. Ctrl, wild-type HEK293T cells; NT, nontargeting shRNA transduced HEK293T cells. Western blot shows a strong decrease of the global level of H3K36me3 in SETD2 knockdown cells as compared with control HEK293T cells and the NT-treated HEK293T cells. The level of histone H3 was used as a loading control. (B) Growth competition assay in HEK293T and HKC8 cells. HEK293T and HKC8 cells were transduced with a nontargeting sequence (NT) or with constructs targeting SETD2 (sh1 and sh2) at low MOI. The percentage of GFP+ cells was measured at the indicated time points (X-axis). The relative changes in GFP-positive cells were normalized to the percentage of GFP-positive cells on day 3 (Y-axis). The data are presented as mean ± SD from triplicate experiments. One-way ANOVA with Dunnett multiple testing correction showed a significant difference of SETD2-sh1 and -sh2 compared with NT, **Pb.01, ***Pb.001.
around day 15 (passage 5), consistent with the known limited proliferative capacity of PTECs [13]. We therefore stopped the GFP-competition assay at day 22.
SETD2-KD PTECs continued to proliferate until we stopped these cultures at day 40. Staining of the SETD2-KD PTECs at day 40 revealed an immunophenotype consistent with the wild-type PTECs at passage 3 (Supplementary Figure 1), i.e., positive for epithelial markers cytokeratin 8/18 (CK 8/18), epithelial membrane antigen (EMA), cytokeratin clone AE1/3 (CK AE1/3), and C5αreceptor (c5αR) and negative for fibroblast marker α smooth muscle actin (α-SMA). SETD2-KD PTECs were also positive for liver-type fatty acid–binding protein 1 (L-FABP) (Figure 2C), a marker of human kidney proximal tubular cells[14].
Thus, we showed that SETD2 knockdown in PTECs abolished H3K36me3 and rendered a relative proliferative advantage while preserving the expected immune phenotype of PTECs.
Expression Signature of SETD2-KD PTECs
To elucidate the mechanism underlying the enhanced proliferative capacity of SETD2-KD PTECs, we generated gene expression signatures of proliferating SETD2-WT PTECs at day 6 (WT-day 6), nonproliferating SETD2-WT PTECs at day 16 (WT-day 16), and SETD2-KD PTECs at day 25 (KD-day 25) that had overcome the restricted proliferating capacity. PTECs transduced with NT shRNA constructs (days 6 and 16) were used as controls. To obtain sufficient cells for the analysis, we infected the NT cells at a high MOI. To exclude a potential bias caused by comparing untreated PTECs to PTECS infected with a high MOI (NT) or a low MOI (SETD2-KD shRNAs), we carried out a principle component analysis (Supplementary Figure 2). Component 1 discriminated between nonproliferating WT- and NT-day 16 cells and the proliferating WT/NT-day 6 and KD-day 25 cells. Component 2 discriminated between WT/NT-day 6 and the KD-day 25 samples. NT cells clustered together with the WT cells at both day 6 and day 16, indicating that MOI did not affect the expression profile. Moreover, no significant differences in the expression
profiles between the WT and NT cells were detected. These analyses clearly indicate that the high MOI used for the NT short hairpin transduction did not affect the expression signature of PTECs.
One-way ANOVA with Bonferroni FWER multiple testing correction revealed 227 differentially expressed genes between the three experimental groups, i.e., proliferating untreated/NT PTECs at day 6 (WT/NT-day 6), nonproliferating WT/NT-day 16 PTECS, and proliferating SETD2-KD day 25 PTECs. Two hundred seven genes were differentially expressed between WT/NT-day 6 and WT/NT-day 16 PTECs, 207 genes between SETD2 KD-day 25 and WT/NT-day 16 PTECs, and 148 genes between WT/NT-day 6 and SETD2 KD-day 25 PTECs (Supplementary Table 2). Unsupervised hierarchical clustering revealed one cluster with all proliferating WT/NT-day 6 and SETD2 KD-day 25 PTECs and a second cluster with the nonproliferating WT/NT-day 16 PTECs (Figure 3A). The samples in the first cluster showed a further grouping, with one tree containing the WT/NT-day 6 PTECs and one tree containing the SETD2 KD-day 25 PTECS.
To characterize the expression differences between these three experimental groups, a gene set enrichment analysis (GSEA) for biological function was performed (Table 1). In comparison to WT/NT-day 6 PTECs, SETD2 KD-day 25 PTECs showed a significant enrichment of nine gene sets (false discovery rate [FDR]b0.01). Activation of the TNFαvia–NF-κB signaling cascade promotes cell proliferation in ccRCC cell lines[15]. Epithelial-Mesenchymal-Transition (EMT) has been shown as an important expression signature of ccRCC[16]. We previously identified differential expression of a set of EMT-related microRNAs between PTEC cells and ccRCC-derived cell lines[17]. Moreover, activation of a membrane-bound interleukin-15 isoform was also shown to stimulate EMT[18]. These studies indicate an oncogenic potential of the SETD2-KD PTECs. Seven gene sets, including E2F_TARGETS and G2M_CHECKPOINT, were enriched in WT/ NT-day 6 PTECs in comparison to KD-day 25 cells.
Compared with WT/NT-day 16 PTECs, two gene sets were specifically enriched in SETD2 KD-day 25 PTECs and two in WT/ NT-day 6 PTECs. Four gene sets were significantly enriched in Figure 2.Knockdown of SETD2 in kidney PTECs. (A) SETD2 knockdown in PTECs. PTECs were transduced with shRNA constructs as described inFigure 1A. The relative abundance ofSETD2mRNA was normalized to RNA polymerase II (RP II).Y-axis shows the 2−Ctfrom three independent experiments (mean ± SD, one-way ANOVA with Dunnett multiple testing correction, *Pb.05, **Pb.01). The level of H3K36me3 in SETD2 wild-type PTECs and shRNA transduced PTECs was shown by Western blotting; Histone H3 was used as a loading control. (B) Growth competition assay in PTECs. PTECs were transduced with shRNA virus particles as described inFigure 1B; GFP-positive cells were measured at the indicated time points (X-axis). The fold change relative to the percentage at day 2 (Y-axis) is shown. The data are presented as mean ± SD of three independent experiments. One-way ANOVA with Dunnett multiple testing correction showed a significant difference of SETD2-sh1 and -sh2 compared with NT, *Pb.05, **Pb.01, ***Pb.001. (C) Immunohistochemical staining of SETD2-KD PTECs at day 40 with four epithelial markers (CK8/18, EMA, CA AE1/3, and C5αreceptor), one fibroblast marker (α-SMA), and one proximal tubular marker (L-FABP). The staining was done in three independent PTEC cultures, and the images shown represent one of these cultures (400×).
Figure 3.SETD2-KD PTECs at day 25 shows an expression signature comparable to proliferating PTECs at day 6. (A) Heat map of the 238 probes (representing 227 genes) differentially expressed between the three predefined groups: SETD2-WT (CON and NT) PTECs at day 6 (WT-day 6), SETD2-WT (CON and NT) PTECs at day 16 (WT-day 16), and SETD2-KD (sh1 and sh2) PTECs at day 25 (KD-day 25). The heat map was generated with unsupervised clustering using Euclidian distance calculated as distance metric. CON and NT samples clustered closely together in each of the three PTECs, despite the difference in being untransduced and transduced at a high MOI. (B) GSEA comparisons of WT-day 6, KD-day 25, and WT-day 16 PTECs using the hallmark gene sets retrieved from MSigDB (n= 50, FDRb0.01). Enrichment plots of the E2F targets expression signature are presented. Normalized enrichment score (NES) and FDR q-value are indicated.
Table 1.Enriched Gene Sets in WT-Day 6 and KD-Day 25 PTECs Compared with WT-Day 16 PTECs
Hallmark Gene Set NES/FDRq-Value NES/FDRq-Value NES/FDRq-Value KD-Day 25 vs WT-Day 16 WT-Day 6 vs WT-Day 16 KD-Day 25 vs WT-Day 6
E2F_TARGETS 2.81/b0.001 – 2.95/b0.001 – – 2.43/b0.001 G2M_CHECKPOINT 2.66/b0.001 – 2.82/b0.001 – – 2.19b0.001 UV_RESPONSE_DN 1.98/b0.001 – – – 1.93/b0.001 – MITOTIC_SPINDLE 1.98/b0.001 – 1.86/b0.005 – – – MYC_TARGETS_V1 1.93/b0.001 – 2.34/b0.001 – – 2.12/b0.001 EPITHELIAL_MESENCHYMAL_TRANSITION 1.82/b0.005 – – – 2.05/b0.001 – DNA_REPAIR – – 1.73/b0.01 – – – MYC_TARGETS_V2 – – 2.06b0.001 – – 1.79/b0.005 TNFA_SIGNALING_VIA_NFKB – – – 2.34/b0.001 2.39/b0.001 – INFLAMMATORY_RESPONSE – – – 1.97/b0.005 1.77/b0.005 – IL6_JAK_STAT3_SIGNALING – – – 1.77/b0.01 – – KRAS_SIGNALING_DN – – – 1.74/b0.01 – – HYPOXIA – – – – 1.97/b0.001 – APOPTOSIS – – – – 1.83/b0.005 – INTERFERON_GAMMA_RESPONSE – – – – 1.81/b0.005 – COMPLEMENT – – – – 1.75/b0.005 – IL6_JAK_STAT3_SIGNALING – – – – 1.66/b0.01 – OXIDATIVE PHOSPHORYLATION – – – – – 2.05/b0.001 BILE_ACID_METABOLISM – – – – – 1.91/b0.001 ESTROGEN_RESPONSE_LATE – – – – –– 1.74/b0.01
both WT/NT-day 6 and SETD2 KD-day 25 PTECs (Table 1). In accordance with their proliferation status, both WT/NT-day 6 and SETD2 KD-day 25 PTECs showed significant enrichment of E2F_TARGETS (Figure 3B), G2M_CHECKPOINT, MITOTIC_ SPINDLE, and MYC_TARGETS_V1 gene sets in comparison to the nonproliferating WT/NT-day 16 PTECs. G2/M checkpoint genes regulate the transition of G2 to M phase in cells and prevent division of cells with DNA damage[19]. The E2F family of transcription factors orchestrates the expression of hundreds of genes in multiple biological processes, including senescence [20]. Collectively, these results demonstrate that SETD2-KD PTECs remain in an active proliferation
status well beyond a passage that would have caused senescence in the WT-PTECs. Given the known association between E2F targets and senescence, as well as the results of the growth competition assay, we next studied the expression of known senescence markers.
Inhibition of CDKN2A-E2F signaling in SETD2-KD PTECs
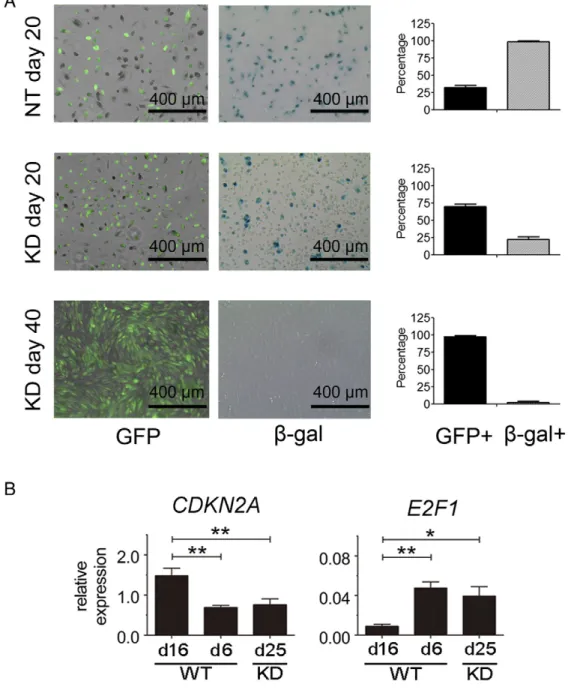
Senescent cells are characterized by growth arrest, enlarged and flat cellular morphology, and an expression profile characterized by senescence-associated genes. The most commonly used marker to identify senescent cells isβ-gal activity[21]. As shown inFigure 4, almost all NT-day 20 PTECs (both GFP + and GFP−) stainedFigure 4.SETD2 inactivation prevents PTECs from senescence by active E2F signaling. (A) GFP andβ-gal staining results of NT-day 20, SETD2-day 20 and SETD2-day 40 PTEC cultures. Representative microscopic views are shown. Quantification of GFP- andβ-gal–positive cells was performed by using ImageJ software (National Institutes of Health, Bethesda, MD). The results are present as mean ± SD value of three independent experiments (right panels). (B) The mRNA expression ofCDKN2AandE2F1in SETD2-WT PTECs at day 6 (WT-day 6), SETD2-WT PTECs at day 16 (WT-day 16), and SETD2-KD PTECs at day 25 (KD-day 25) was determined by RT-qPCR. The expression level of target genes was normalized to RP II. The results are presented as 2−Ctvalues of three independent experiments with mean ± SD.
One-way ANOVA with Dunnett multiple testing corrections showed significant differences between WT-day 6 and KD-day 25 PTECs compared with nonproliferating WT-day 16 PTECs. *Pb.05, **Pb.01.
positive for β-gal, indicative of a senescent status. In the mixed SETD2-KD cultures at day 20, containing both transduced GFP +/ SETD2-KD PTECs and nontransduced GFP-/SETD2-WT PTECs, only a subpopulation of the cells stained positive forβ-gal. After 40 days, almost all SETD2 KD cells were negative forβ-gal while being positive for GFP. The decrease ofβ-gal–positive cells, in combination with the increasing number of GFP + cells in the SETD2-KD PTEC culture, is consistent with a rescue of senescence of the SETD2-KD cells. These results indicate that knockdown of SETD2 prevents the transition of proliferating PTECs to nonproliferating, senescent PTECs.
The two main pathways associated with regulation of senescence are the tumor protein (TP)53-cyclin-dependent kinase inhibitor 1A (CDKN1A) and the CDKN2A-E2F pathway [22]. Activation of TP53 results in induction ofCDKN1Aand senescence. The expression levels ofTP53did not change, whereas its downstream targetCDKN1A was increased in both nonproliferating WT/NT-day 16 PTECs and proliferating SETD2 KD-day 25 PTECs (Supplementary Figure 3). Activation of CDKN2A induces senescence by inhibitingE2Ffamily members through binding to the retinoblastoma protein. As GSEA showed enrichment of E2F targets in WT/NT-day 6 and SETD2 KD-day 25 PTECs compared with WT/NT-day 16 PTECs, we studied the expression ofCDKN2AandE2F1in these three cohorts. Compared with WT/NT-day 6 PTECs, we observed a significant increase of CDKN2Aand a significant decrease ofE2F1in WT-day 16 PTECs. In SETD2 KD-day 25 PTECs, the expression ofCDKN2AandE2F1was maintained at levels comparable to WT/NT-day 6 PTECs (Figure 4B). These findings are consistent with a previous report showing that the expression of theE2F1was decreased in senescent cells, whereasE2F1 overexpression enabled resistance to senescence in primary fibroblast cells [23]. Thus, it appears that SETD2 knockdown prevents senescence in PTECs by maintaining the CDKN2A-E2F pathway. In the immortalized HEK293T cells, we observed decreased expression of bothCDKN2AandE2F1as a result of SETD2-KD (Supplementary Figure). Since the phosphorylation of RB is abolished as a result of the immortalization, the decreased expression ofCDKN2Acannot activate E2Fs. The decreased expression level of E2F1 might be caused by the genome-wide absence of H3K36me3 in gene bodies.
To examine if SETD2 inactivation could reverse the senescent nature of PTECs at high passage number, β-gal staining was performed on PTECs 6 days after transduction with lentiviral SETD2-shRNA at passage 6 (day 20). Although the majority of the cells were GFP+, they also stained positive forβ-gal (Supplementary Figure 5), indicating that the senescent state could not be reverted upon SETD2 knockdown.
Our data show that SETD2 inactivation represents an escape of senescence mechanism of PTECs, in line with its tumor suppressor function in ccRCC. This is consistent with the proposed role ofSETD2 inactivation in acute leukemia[24]. Senescence is a response that prevents proliferation of cells with DNA damage, and it serves as a barrier for malignant transformation[19]. We now show thatSETD2inactivation in PTECs bypasses the senescence barrier by maintaining CDKN2A-E2F signaling. Collectively, these studies emphasize the importance of the senescence-associated pathway in the development of ccRCC.
The major known consequence of SETD2 inactivation is loss of H3K36me3 on actively transcribed multiexon genes. This histone mark is recognized by so-called readers, most often by virtue of their PWWP domain [25]. These readers are important components of several cellular pathways that are linked to cancer.SETD2mutated ccRCC
tumors and/or cell lines showed altered chromatin accessibility, resulting in widespread transcript processing defects [26]. This is consistent with the known regulatory role of H3K36me3 methylation on transcription regulation [12]. Loss of H3K36me3 in ccRCC prevented recruitment of the mutS homolog 6, which is essential for DNA mismatch repair [27], and recruitment of Lens epithelium-derived growth factor, which is required for homologous recombination of DNA double-strand breaks[28]. Loss of H3K36me3 also hinders the recruitment of RAD51 to DNA damage sites, resulting in failure of the TP53-mediated DNA damage response[29]. A disrupted interaction of BRCA1 with RAD51 was shown to lead to microtubule organizing center amplification, causing chromosomal instability [30]. Thus, it might be speculated that loss of SETD2 leads to accumulation of DNA damage. However, it remains unknown how SETD2 loss exactly prevents senescence in PTECS; most likely, the effect is modulated by CDKN2A, which is strongly induced upon senescence and prevents induction of E2Fs and their targets. On the other hand, it cannot be excluded that another, undiscovered mode of action of SETD2 is responsible for the phenotype as observed upon SETD2-KD. Loss of a direct interaction of SETD2 with TP53 could play a role in this process [31]. The regulation of several TP53 downstream targets appeared to be dependent on its interaction with SETD2. Loss ofpuma, one of these targets, is suggested to prevent DNA-damage–induced apoptosis[32]. Conclusions
In summary, we demonstrate that functional loss ofSETD2enables PTECs to bypass the senescence barrier by maintaining CDKN2A-E2F signaling. The prolonged proliferating potential might result in accumulation of DNA damage and thereby result in the development of ccRCC. Our results thus support a tumor suppressor role forSETD2 in ccRCC, consistent with Knudson’s two-hit model.
Supplementary data to this article can be found online athttp://dx. doi.org/10.1016/j.neo.2016.04.005.
Acknowledgements
The research was supported by the Graduate School of Medical Sciences, University Medical Center Groningen, University of Groningen. J. L. was supported by a China Scholarship Council of research fellowship. We are grateful to Prof. Dr. Ir. Jo Vandesompele, Pieter-Jan Volders, and Dr. Pieter Mestdagh (Center for Medical Genetics Ghent) for sharing the design of the microarray used in this study. We thank Jackie Senior for critically editing the manuscript. References
[1] Ferlay J, Soerjomataram I, Ervik M, Dikshit R, Eser S, Mathers C, Rebelo M, Parkin DM, Forman D, and Bray F (2013). GLOBOCAN 2012 v1. 0, Cancer Incidence and Mortality Worldwide: IARC CancerBase No. 11 [Internet]. Lyon: International Agency for Research on Cancer; 2013 [globocan.iarc.fr (accessed 10 October 2014)]. [2] Haddad AQ and Margulis V (2015). Tumour and patient factors in renal cell
carcinoma—towards personalized therapy.Nat rev Urol12, 253–262.
[3] Thoenes W, Störkel ST, and Rumpelt HJ (1986). Histopathology and classification of renal cell tumors (adenomas, oncocytomas and carcinomas): the basic cytological and histopathological elements and their use for diagnostics.
Pathol Res Pract181, 125–143.
[4] Kok K, Naylor SL, and Buys CHCM (1997). Deletions of the short arm of chromosome 3 in solid tumors and the search for suppressor genes.Adv Cancer Res71, 27–92.
[5] Seizinger BR, Rouleau GA, Ozelius LJ, Lane AH, Farmer GE, Lamiell JM, Haines J, Yuen JWM, Collins D, and Majoor-Krakauer D (1988). Von Hippel Lindau disease maps to the region of chromosome 3 associated with renal cell carcinoma.Nature332, 268–269.
[6] Dalgliesh GL, Furge K, Greenman C, Chen L, Bignell G, Butler A, Davies H, Edkins S, Hardy C, and Latimer C, et al (2010). Systematic sequencing of renal carcinoma reveals inactivation of histone modifying genes.Nature463, 360–363.
[7] Duns G, van den Berg E, van Duivenbode I, Osinga J, Hollema H, Hofstra RMW, and Kok K (2010). Histone methyltransferase gene SETD2 is a novel tumor suppressor gene in clear cell renal cell carcinoma.Cancer Res70, 4287–4291.
[8] Sato Y, Yoshizato T, Shiraishi Y, Maekawa S, Okuno Y, Kamura T, Shimamura T, Sato-Otsubo A, Nagae G, and Suzuki H (2013). Integrated molecular analysis of clear-cell renal cell carcinoma.Nat Genet45, 860–867.
[9] Cancer Genome Atlas Research Network (2013). Comprehensive molecular characterization of clear cell renal cell carcinoma.Nature499, 43–49.
[10] Edmunds JW, Mahadevan LC, and Clayton AL (2007). Dynamic histone H3 methylation during gene induction: HYPB/Setd2 mediates all H3K36 trimethylation.EMBO J27, 406–420.
[11] van Ark J, Hammes HP, van Dijk MC, Lexis CP, van der Horst IC, Zeebregts CJ, Vervloet MG, Wolffenbuttel BH, van Goor H, and Hillebrands JL (2013). Circulating alpha-klotho levels are not disturbed in patients with type 2 diabetes with and without macrovascular disease in the absence of nephropathy.Cardiovasc Diabetol12, 116.
[12] Li J, Moazed D, and Gygi SP (2002). Association of the histone methyltransferase Set2 with RNA polymerase II plays a role in transcription elongation.J Biol Chem
277, 49383–49388.
[13] Qi W, Johnson DW, Vesey DA, Pollock CA, and Chen X (2007). Isolation, propagation and characterization of primary tubule cell culture from human kidney (methods in renal research).Nephrology12, 155–159.
[14] Maatman RG, Van de Westerlo EM, van Kuppevelt TH, and Veerkamp JH (1992). Molecular identification of the liver-and the heart-type fatty acid-binding proteins in human and rat kidney. Use of the reverse transcriptase polymerase chain reaction.Biochem J288, 285–290.
[15] Ikemoto S, Narita K, Yoshida N, Wada S, Kishimoto T, Sugimura K, and Nakatani T (2003). Effects of tumor necrosis factorαin renal cell carcinoma.Oncol Rep10, 1947–1955.
[16] Tun HW, Marlow LA, Von Roemeling CA, Cooper SJ, Kreinest P, Wu K, Luxon BA, Sinha M, Anastasiadis PZ, and Copland JA (2010). Pathway signature and cellular differentiation in clear cell renal cell carcinoma.PLoS One5, e10696. [17] Duns G, van den Berg A, van Dijk MCRF, van Duivenbode I, Giezen C, Kluiver
J, van Goor H, Hofstra RMW, van den Berg E, and Kok K (2013). The entire miR‐200 seed family is strongly deregulated in clear cell renal cell cancer compared to the proximal tubular epithelial cells of the kidney. Genes Chromosomes Cancer52, 165–173.
[18] Yuan H, Meng X, Guo W, Cai P, Li W, Li Q, Wang W, Sun Y, Xu Q, and Gu Y (2015). Transmembrane-bound IL-15–promoted epithelial-mesenchymal
transi-tion in renal cancer cells requires the Src-dependent Akt/GSK-3beta/beta-catenin pathway.Neoplasia17, 410–420.
[19] Zhou B-BS and Elledge SJ (2000). The DNA damage response: putting checkpoints in perspective.Nature408, 433–439.
[20] Narita M, Nuñez S, Heard E, Narita M, Lin AW, Hearn SA, Spector DL, Hannon GJ, and Lowe SW (2003). Rb-mediated heterochromatin formation and silencing of E2F target genes during cellular senescence.Cell113, 703–716. [21] Campisi J (2013). Aging, cellular senescence, and cancer.Annu Rev Physiol75,
685–705.
[22] Campisi J and d’Adda di Fagagna F (2007). Cellular senescence: when bad things happen to good cells.Nat Rev Mol Cell Biol8, 729–740.
[23] Dimri GP, Itahana K, Acosta M, and Campisi J (2000). Regulation of a senescence checkpoint response by the E2F1 transcription factor and p14(ARF) tumor suppressor.Mol Cell Biol20, 273–285.
[24] Zhu X, He F, Zeng H, Ling S, Chen A, Wang Y, Yan X, Wei W, Pang Y, and Cheng H (2014). Identification of functional cooperative mutations of SETD2 in human acute leukemia.Nat Genet46, 287–293.
[25] Qin S and Min J (2014). Structure and function of the nucleosome-binding PWWP domain.Trends Biochem Sci39, 536–547.
[26] Simon JM, Hacker KE, Singh D, Brannon AR, Parker JS, Weiser M, Ho TH, Kuan PF, Jonasch E, and Furey TS, et al (2014). Variation in chromatin accessibility in human kidney cancer links H3K36 methyltransferase loss with widespread RNA processing defects.Genome Res24, 241–250.
[27] Li F, Mao G, Tong D, Huang J, Gu L, Yang W, and Li G-M (2013). The histone mark H3K36me3 regulates human DNA mismatch repair through its interaction with MutSα.Cell153, 590–600.
[28] Pfister SX, Ahrabi S, Zalmas L-P, Sarkar S, Aymard F, Bachrati CZ, Helleday T, Legube G, La Thangue NB, and Porter ACG (2014). SETD2-dependent histone H3K36 trimethylation is required for homologous recombination repair and genome stability.Cell Rep7, 2006–2018.
[29] Carvalho S, Vitor AC, Sridhara SC, Martins FB, Raposo AC, Desterro JM, Ferreira J, and de Almeida SF (2014). SETD2 is required for DNA double-strand break repair and activation of the p53-mediated checkpoint.eLife3, e02482. [30] Jung YS, Chun HY, Yoon MH, and Park BJ (2014). Elevated estrogen receptor-alpha
in VHL-deficient condition induces microtubule organizing center amplification via disruption of BRCA1/Rad51 interaction.Neoplasia16, 1070–1081.
[31] Xie P, Tian C, An L, Nie J, Lu K, Xing G, Zhang L, and He F (2008). Histone methyltransferase protein SETD2 interacts with p53 and selectively regulates its downstream genes.Cell Signal20, 1671–1678.
[32] Zhou X, Tolstov Y, Arslan A, Roth W, Grullich C, Pahernik S, Hohenfellner M, and Duensing S (2014). Harnessing the p53-PUMA axis to overcome DNA damage resistance in renal cell carcinoma.Neoplasia16, 1028–1035.