Dose‐Guided Automatic IMRT Planning: A Feasibility Study by Yang Sheng Graduate Program in Medical Physics Duke University Date:_______________________ Approved: ___________________________ Q. Jackie Wu, Supervisor ___________________________ W. Robert Lee ___________________________ Robert E. Reiman Thesis submitted in partial fulfillment of the requirements for the degree of Master of Science in the Graduate Program in Medical Physics in the Graduate School of Duke University 2014
ABSTRACT Dose‐Guided Automatic IMRT Planning: A Feasibility Study by Yang Sheng Graduate Program in Medical Physics Duke University Date:_______________________ Approved: ___________________________ Q. Jackie Wu, Supervisor ___________________________ W. Robert Lee ___________________________ Robert E. Reiman An abstract of a thesis submitted in partial fulfillment of the requirements for the degree of Master of Science in the Graduate Program in Medical Physics in the Graduate School of Duke University 2014
Copyright by Yang Sheng 2014
Abstract
Purpose: To develop and evaluate an automatic IMRT planning technique for prostate cancer utilizing prior expert plan’s dose distribution as guidance.
Methods and Materials: In this study, the anatomical information of prostate cancer cases was parameterized and quantified into two measures: the percent distance‐to‐ prostate (PDP) and the concaveness angle. Based on these two quantities, a plan atlas composed of 5 expert prostate IMRT plans was built out of a 70‐case pool at our institution using k‐medoids clustering analysis. Extra 20 cases were used as query cases to evaluate the dose‐guided automatic planning (DAP) scheme. Each query case was matched to an atlas case based on PTV‐OAR anatomical features followed by deformable registration to enhance fine local matching. Using the deformation field, the expert dose in the matched atlas case was warped onto the query case, creating the goal dose conformal to the query case’s anatomy. Dose volume histograms (DVHs) objectives were sampled from the goal dose to guide automatic IMRT treatment planning. Dosimetric comparison between DAP plans and clinical plans were performed. Results: Generating goal dose is highly efficient by using MIM™ workflows. The deformable registration provides high‐quality goal dose tailored to query case’s anatomy in terms of the dose falloff at the PTV‐OAR boundary and the overall
conformity. Automatic planning in Eclipse™ takes ~2.5 min (~70 iterations) without human intervention. Compared to clinical plans, DAP plans improved the conformity index from 0.85±0.04 to 0.88±0.02 (p=0.0045), the bladder‐gEUD from 40.7±3.2 Gy to 40.0±3.1 Gy (p=0.0003), and rectum‐gEUD from 40.4±2.0 Gy to 39.9±2.1 Gy (p=0.0167). Other dosimetric parameter is similar (p>0.05): homogeneity indices are 7.4±0.9% and 7.1±1.5%, for DAP plans and clinical plans, respectively. Conclusions: Dose‐guided automatic treatment planning is feasible and efficient. Atlas‐ based patient‐specific dose objectives can effectively guide the optimizer to achieve similar or better plan quality compared to clinical plans.
Contents
Abstract ... iv List of Tables ... viii List of Figures ... ix List of Abbreviations ... xi Acknowledgements ... xiii 1. Introduction ... 1 1.1 Intensity Modulated Radiation Therapy ... 1 1.1.1 Brief Overview ... 1 1.1.2 IMRT for Prostate Cancer ... 2 1.2 Challenges for IMRT Treatment Planning ... 2 1.3 Knowledge‐based Radiation Therapy ... 3 1.4 Purpose of the Study ... 6 2. Materials and Methods... 8 2.1 Patient Selection ... 8 2.2 Dose‐guided Automatic Planning ... 9 2.2.1 Atlas Buildup and Query Case Matching ... 9 2.2.1.1 Anatomy Quantification ... 9 2.2.1.2 k‐medoids Clustering Analysis ... 11 2.2.2 Dose‐guided Automatic Plan Generation ... 13 2.2.2.1 Linking Query Case with Atlas Case through Deformable Image2.2.2.2 Automatic IMRT Planning ... 13 2.3 DAP Plan Quality Evaluation ... 14 3. Results ... 16 3.1 Atlas Buildup ... 16 3.2 Goal Dose Distribution ... 18 3.3 PTV Coverage and OAR Sparing ... 19 3.4 Planning Time and Monitor Unit ... 23 4. Discussion ... 26 4.1 Atlas Efficacy and Efficiency... 26 4.2 Deformable Image Registration Accuracy ... 27 4.3 Goal Dose Conformity on Target ... 30 4.4 Plan Quality Comparison ... 31 4.4.1 Dose Distribution ... 31 4.4.2 Dosimetric Parameters ... 32 4.5 Comparison between DAP and Previous Knowledge‐based Techniques ... 33 4.6 Future Direction ... 34 5. Conclusions ... 36 References ... 37
List of Tables
Table 1: Monitor unit for the DAP plan. ... 24 Table 2: Monitor unit for the clinical plan. ... 25
List of Figures
Figure 1: Flowchart of the DAP method. ... 8 Figure 2: Illustration of anatomical features of the PTV: (a) PTV‐SV containing SV labeled green and PTV‐prostate containing prostate labeled red; (b) extracted slices from PTV‐SV (yellow) and PTV‐prostate (white), and feature points for analysis... 11 Figure 3: The average silhouette width for different atlas numbers ... 17 Figure 4: Anatomical feature parameters for all 90 cases; five out of seventy cases are selected as atlas cases (filled red dots) by k‐medoids algorithm. Hollow black dots are atlas selection pool cases. Filled blue dots are test case pool cases; the red line connecting atlas case and test case indicates the match atlas case for each test query case. ... 18 Figure 5: Example of goal dose generated from the atlas plan dose. (a): Atlas plan with clinical dose. (b): Query case’s anatomy which is similar to the matched atlas case. (c): Query case’s anatomy with the goal dose generated from the atlas plan dose. ... 19 Figure 6: Examples of DVHs between the DAP plan and clinical plan: (a) improved low dose sparing for bladder in the DAP plan is observed in case #07; (b) similar OAR sparing is present for case #08; (c) worse rectum low dose sparing is observed in the DAP plan for case #11; (d) For case #20, similar overall OAR sparing is observed. Similar OAR sparing for both the bladder and rectum is provided by DAP plans except some inconsistencies for low dose region in some cases. ... 20 Figure 7: Dosimetric data boxplots of DAP plans and clinical plans including HI, CI, gEUD for the bladder and rectum, V100% and V65% for the bladder and rectum. ... 22 Figure 8: Comparison of (a) the deformed CT of the atlas case through the deformation field and (b) the CT of the query case. Images are masked for different CT numbers. High agreement is reached between two CTs indicating the accurate contour‐based deformable image registration. ... 29 Figure 9: Intensity‐based deformable image registration comparison. (a) The deformed CT of the atlas case through the deformation field; (b) the CT of the query case. Variations are observed between images especially at edges (red arrow). Potential error in the edge deformation may degrade the deformable image registration accuracy. ... 30Figure 10: Dose distribution comparison between the DAP plan and the clinical plan.
More conformal dose is observed for the DAP plan for this case (white arrow)... 32
List of Abbreviations
AP: Anterior‐Posterior ART: Adaptive Radiation Therapy BEV: Beam Eye View CI: Conformity Index CT: Computed TomographyCTV: Clinical Target Volume
DAP: Dose‐guided Automatic Planning DVH: Dose Volume Histogram gEUD: Generalized Equivalent‐Uniform‐Dose HI: Homogeneity Index IG‐IMRT: Image‐guided Intensity Modulated Radiation Therapy IMRT: Intensity Modulated Radiation Therapy KBRT: Knowledge‐based Radiation Therapy LGP: Linear Goal Programming MI: Mutual Information MLC: Multi‐Leaf Collimator OAR: Organ‐at‐Risk OVH: Overlap Volume Histogram
PA: Posterior‐Anterior PDP: Percent Distance‐to‐Prostate PIV: Prescription Isodose Volume PTV: Planning Target Volume SAM: Segment Aperture Morphing SBRT: Stereotactic Body Radiation Therapy SV: Seminal Vesicle SWO: Segment Weight Optimization TPS: Treatment Planning System
Acknowledgements
I would like to express my sincere thankfulness to my research advisor, Dr. Jackie Wu, for her constructive suggestion and advice for this research project, and also the patient guidance and incentive encouragement for my career in Medical Physics. I would also like to extend my gratitude to Dr. Taoran Li for his constructive recommendation during this study as well as the suggestion for the graduate study. I also thank Dr. Fang‐Fang Yin and Dr. Yaorong Ge for the constructive critique provided. I also thank Dr. Lulin Yuan and You Zhang for giving me suggestion and hint when I am in trouble and for the anecdotes you all shared with me which gives the life more color. I am deeply grateful for the priceless support and understanding from my parents. Thank you for giving me life and bringing me up; thank you for giving me the best education; thank you for the accompany and comfort when I am depressed.1. Introduction
1.1 Intensity Modulated Radiation Therapy
1.1.1 Brief Overview
Intensity Modulated Radiation Therapy (IMRT) has been rigorously developed in recently years. Based on the inverse planning method where a set of dosimetric objectives is given to iteratively modulate the beam fluence, IMRT can reduce the organ‐ at‐risk (OAR) dose while retaining adequate target coverage. The multi‐leaf collimators (MLC) utilize either the step and shoot or sliding window technique to modulate the beam intensity to create highly conformal dose. In the beam eye view (BEV) direction, the radiation ray that goes through sensitive organ will have lower intensity while the ray primarily penetrates the target will receive higher intensity, which cannot be accomplished by conventional 3D technique. The reduced OAR dose results in the minimized acute toxicity which makes the dose escalation feasible and thusly improve the tumor control [1]. Multiple non‐opposite beams are usually used in IMRT to increase the flexibility of adjusting beam fluence to achieve conformal dose distribution. Since the intensity of each beam is usually less than 100%, to achieve Rx dose the required MU is higher than 3D plan. Increased MU may introduce extra leakage dose to the patient, however, significant improvement is present for IMRT over conventional 3D treatment. Pirzkall etal. reinforced that IMRT produces significant improvement, in terms of conformality and coverage, over the conventional delivery technique [2].
1.1.2 IMRT for Prostate Cancer
IMRT has been widely implemented to treat prostate cancer. IMRT shows improved OAR sparing when the OAR is adjacent to the target. The close position of the PTV and main OARs, the bladder and rectum, makes IMRT an ideal technique to treat prostate cancer [2]. Clinical studies demonstrate the feasibility and safety, and even dosimetric advantage of IMRT for treating prostate cancer [3,4]. The high conformality of IMRT makes it more susceptible of underdose to the target especially for the prostate which is more prone to deformation/motion [5,6]. Several real‐time soft tissue tracking techniques and Adaptive Radiation Therapy (ART) have been proposed to deal with the deformation/motion issue with the help of online image guidance [7‐11]. Significant target dose improvement and OAR dose reduction was observed in Image‐guided Intensity Modulated Radiation Therapy (IG‐IMRT) compared to conventional IMRT [12].
1.2 Challenges for IMRT Treatment Planning
The optimization process of IMRT treatment planning iteratively modulates the beam fluence based on the objectives given by the planner to achieve specific OAR sparing goal. Anatomical variations among prostate cancer patients, however, make the optimization objectives for each IMRT planning highly patient‐specific. The planner,
particularly if less experienced, often is not aware of the optimal set of objectives before planning, and has to use iterative trials‐and‐errors in the planning process. The average treatment planning time for prostate IMRT cases on Eclipse treatment planning system (Varian Medical Systems, Palo Alto, CA) has been reported at one to three hours with large variations observed between planners with different expertise [13]. The plan quality is also reported to be dependent on the planner’s experience, where higher level of IMRT planning experience leads to superior plans [14]. The increasing need for reducing treatment planning time and guaranteeing plan quality consistency drives the emergence and prosperity of knowledge‐based treatment planning.
1.3 Knowledge-based Radiation Therapy
Clinical plans treated on the patient are reviewed by Physicist and Physician. The plan quality embeds the knowledge of PTV coverage as well as the OAR sparing which meet clinical requirement. With the premise that previous knowledge embedded in the clinically approved plan can be transferred to the new patient and/or used to predict the achievable dosimetric outcome, the Knowledge‐based Radiation Therapy (KBRT) tries to reduce the treatment planning time originated from the trial‐and‐errors process while generating plans with equivalent plan quality. The generated OAR sparing outcome is based on the best knowledge in the past, instead of the absolute best achievable sparing goal [15].
Methods and strategies to improve IMRT plan quality and planning efficiency have been studied. For patients with same disease and staging, class solutions have been proposed to provide dose objective guidance [15‐20] and/or other optimization parameter guidance. One group of the techniques focuses on finding the match between existing case database and new patient’s anatomy based on various similarity measures. The new case then uses part or all of the matched plan parameters (dose, fluence maps, MLC segments, etc.) and additional optimization is applied to refine the final dose distribution. For example, Chanyavanich et al uses mutual information (MI) of the beam’s eye view (BEV) projections of the structure contours [16] to select reference case from a library of previous clinical prostate plans; while Wu et al matches the PTV‐OAR geometry of the new patient to the database using the overlap volume histogram (OVH) [17]. These methods rely on the sufficiently large library, consisting of 100 cases [16], so that a very close match can be found and the existing plan dosimetric characteristics can be adopted to guide the planning of new case. Therefore, the computation burden is considerably heavy to ensure the matching accuracy. Another group of techniques takes the evidence‐based approach, where the relationships between certain anatomy features and dosimetry features are formulated [15,18‐20]. Zhu et al [18] and Yuan et al [15] propose a machine learning model to provide patient‐specific OAR sparing goals. This technique does not require matching specific query case with a database of expert cases.
Lian et al [19] further expands the model to analyze inter‐technique and inter‐ institutional performance, demonstrating highly conformal dose distribution is achieved with Tomotherapy and static‐gantry IMRT techniques at comparable level. Appenzoller et al also proposes patient‐specific OAR sparing models based on the correlation between the expected dose and the minimum distance from a voxel to the PTV surface [20]. For same patient with varying anatomy throughout the treatment course, several adaptive radiation therapy (ART) techniques have been proposed [8‐11,21‐23]. These techniques work with the original IMRT plan as they are designed by the expert planner and find ways to quickly modify the plan parameters to re‐conform the dose distribution to the changed anatomy. For example, Ahunbay et al develops an online adaptive treatment planning technique using segment aperture morphing (SAM) and segment weight optimization (SWO) to deal with inter‐fractional motion [21‐23]. We have also developed a fast re‐optimization technique for on‐line ART application [8‐11]. This method also uses the IMRT plan as base dose distribution and applies a deformable registration technique to generate goal dose distribution for subsequent treatment fractions that require re‐optimization. The goal dose, taking into consideration of the daily anatomy being different from the original CT scan, can then guide the optimizer to
generate new fluence maps in 1‐2 minutes. This method shows daily target coverage and OAR sparing comparable to human expert planner [8].
1.4 Purpose of the Study
To extend this ART technique designed for addressing inter‐fractional deformation within the same patient to provide guided automated IMRT optimization for new patients, we need to address the challenge of inter‐patient anatomy variations, which can often be much more substantial compared to intra‐patient anatomy variation that we have successfully dealt with in ART. We hypothesized that instead of using just one reference plan/dose, a set of reference plans covering a range of anatomy variation can be used as the goal dose distribution atlas. Then if a new case’s anatomy is sufficiently similar to an existing atlas subject, the dose distribution from the atlas plan can be warped to conform the new anatomy, and thus used as a guidance in the treatment planning for the new case. This hypothesis is a cross‐patient generalization of our previous work on intra‐patient dose guidance used for the adaptive radiation therapy. On the other hand, multi‐atlas‐based technique was frequently used in image segmentation [24‐26] in medical imaging, where existing segmentations within the atlas were used to predict new image’s segmentation [27], with the fine local variation being adjusted via deformable image registration. In this study, we validated our hypothesis
by investigating the feasibility and benefit of using a multi‐case atlas and deformable registration technique to facilitate automatic IMRT planning for new cases.
2. Materials and Methods
The flowchart of the DAP method is shown in Figure 1. The whole process consist two major components: atlas buildup and query‐atlas case matching, and dose‐ guided automatic plan generation.
Figure 1: Flowchart of the DAP method.
2.1 Patient Selection
90 patients including their clinical treatment plans were retrospectively
studied under an IRB protocol. The clinical target volume (CTV) includes both
the prostate and the seminal vesicles (SV), and the PTV is expanded from the
2.2 Dose-guided Automatic Planning
2.2.1 Atlas Buildup and Query Case Matching
Among the 90 patient cases included in this study, 70 cases were used to cluster and select the atlas cases and the other 20 cases were used to test the effectiveness of the atlas. After consulting with experts dedicated to clinical prostate radiation therapy service, two key features were quantified to represent anatomical variations among prostate patients (shown in Figure 2). 2.2.1.1 Anatomy Quantification The first feature calculates the relative position of the SV to the prostate in the anterior‐posterior (AP) direction, implicating how well a dose gradient fall‐off around the target, especially around the SV, can be formed. Two structures, the prostate and the
SV were used for the analysis. The center of mass (COM) of the SV (xSV_COM,ySV_COM)
was calculated. The range of the prostate in the AP direction, xprostate_ min
and xprostate_ max,
were also recorded. The relative position of the SV with respect to the prostate was defined as the percent distance‐to‐prostate (PDP). _ _ min _ max _ min 100% SV COM prostate prostate prostate x x PDP x x Eq.(1)
The second feature measures the concaveness of the posterior wall of the prostate. For quantification, the PTV was re‐organized as two components: PTV‐SV (SV plus the margin), and PTV‐prostate (rest of the PTV). For PTV‐SV, the axial slice with the globally most far‐reaching point (xSVx extreme_ ,ySVx extreme_ ) along the posterior direction was located. At the same slice, (xSVmin,ySVmin) and (xSVmax,ySVmax), the two points
where the PTV‐SV contour intersects with the projection of the AP axis which penetrates
the far‐reaching point (xpmin,ypmin) along the posterior‐anterior (PA) direction in PTV‐
prostate, were also marked. Similarly for PTV‐prostate, the axial slice with the globally
most far‐reaching point (xpmin,ypmin) along the PA direction was identified. All points
above were located on the axial plane with ( , )x y coordinates. This second feature
measures the PTV‐SV angle between AP axis and the line connecting
_ _
(xSVx extreme,ySVx extreme) and (xSVmax,ySVmax).
_ max arctan SVx extreme SVx extreme SV y x x
Eq.(2) Indicating the concaveness of the PTV, is a determining factor of dose falloff/gradient around the rectum.Figure 2: Illustration of anatomical features of the PTV: (a) PTV‐SV containing SV labeled green and PTV‐prostate containing prostate labeled red; (b) extracted slices from PTV‐SV (yellow) and PTV‐prostate (white), and feature points for analysis.
2.2.1.2 k‐medoids Clustering Analysis
To build an atlas out of the total 70 patient cases, the PDP and were assessed for all the patient cases. Each patient was represented by a point at a 2D space spanned by the two anatomical measures. To select k patient cases out from these points to compose an atlas (Figure 4), a technique based on clustering analysis, called the k‐ medoids algorithm [28], was applied. All patients’ parameters were treated as a 2‐ dimensional real vector. The k‐medoids algorithm selected k cases out of 70 as medoids and all cases were therefore partitioned into k clusters while minimizing the within‐ cluster sum of the Euclidean distance.
1 arg min j i k j i S i x S x S
Eq.(3)where S is the selected set of atlas,
x
j is the case in the clusterS
i. All cases were divided into clusters which centered on the selected atlas cases. To determine the optimal size k of the atlas, the average silhouette width for each k‐medoids scheme was calculated. The silhouette value for each datum was defined by Rousseeuw [29]. ( ) ( ) ( ) max{ ( ), ( )} b i a i s i a i b i Eq.(4)where a i( ) is the average dissimilarity of i with all other data in the same cluster;
( ) b i is the lowest average dissimilarity of i to any other cluster. The Euclidean distance was used as the dissimilarity measure. The average silhouette width, the arithmetic mean silhouette value of all data, reflects how well the data were clustered while higher average silhouette width corresponds to better clustering scheme [29]. Extra 20 cases outside the atlas selection pool were used as query cases to evaluate the performance of the atlas‐based dose guidance method. For each query case, an atlas case was matched, which has the minimum Euclidean distance to the query case on the 2D space spanned by PDP and .
2.2.2 Dose-guided Automatic Plan Generation
2.2.2.1 Linking Query Case with Atlas Case through Deformable Image Registration
Through PDP and
, the query case and an atlas case were matched roughly by large‐scale anatomical similarities. To account for the local and fine‐structure variations between the query case and the atlas case, deformable image registration [8‐11] between two image sets was further applied to enhance the link between two cases. In this study, the MIM Maestro™ (MIM Software Inc, Cleveland, OH) system was used to deform the matched atlas case’s anatomy towards the query case using contour‐based deformable image registration. The resulting deformation field of the deformable registration was applied to warp the atlas case’s dose towards the query case’s anatomy. Because this deformation field links the atlas case’s anatomy to that of the query case, the warped dose following the same transformation conformed the query case’s anatomy [8,10,11]. This dose is referred to as the goal dose [8] implicating a high‐quality dose distribution that can possibly be achieved through treatment planning.2.2.2.2 Automatic IMRT Planning
Form the goal dose DVH, the optimization objectives were sampled for each structure of interest. The sampled optimization objectives were then imported into the treatment planning system (TPS) to guide automatic planning. There was no human
were manually‐created for treatment, were used as references to evaluate the quality of DAP plans. Beam configuration of both plans is same from an institutional beam configuration template.
2.3 DAP Plan Quality Evaluation
In this study, the quality of two plans was first evaluated by comparing dosimetric parameters. The spatial dose distribution was visually inspected to identify any hotspot on sensitive OARs, such as the rectum. It ensures the overall dose distributions meet clinical delivery condition. DVHs of the PTV and two main OARs, the rectum and bladder, were computed and compared. The homogeneity index (HI) of the PTV [30] was analyzed for both plans, 2 98 100% Rx D D HI D . Eq.(5)
where
D
2 andD
98 are doses that 2% and 98% of the PTV volume received,respectively.
D
Rx is the prescription dose which was 54Gy in this study. Theconformity index (CI) described by Paddick [31] was also compared between the paired plans, 2 PIV PTV CI PTV PIV . Eq.(6)
where PTV is the planning target volume, PIV is the prescription isodose volume
and
PTV
PIV is the prescription isodose volume in the PTV. This parameter indicateshow the prescription dose (and similarly high dose) was conformed to the PTV. High values of CI correspond to highly conformed dose distribution around the PTV. Since plans were all normalized so that 100% Rx dose covers 95% of the PTV, 0.95 is the best achievable CI in our case. The OAR sparing between two plans was compared using the generalized equivalent‐uniform‐dose (gEUD) defined as 1/a a i i i gEUD v D
, Eq.(7) where vi , Di correspond to the percent volume of each voxel and the absolute dose of each voxel in the OAR, and the a value for both the bladder and rectum is chosen as 6 [32]. gEUD is an equivalent uniform dose that has same biological effect as the non‐ uniform dose across the OAR. Additional dosimetric parameters, such as volumes receiving 100% and 65% Rx dose (V100% and V65%) for the bladder and rectum were compared. All dosimetric comparisons were tested for significance using two‐sided Wilcoxon Signed Rank test. p‐ value below 0.05 was considered statistically significant. The MU of each plan was also recorded to assess the delivery efficiency.3. Results
3.1 Atlas Buildup
70 cases were clustered based on the k‐medoids algorithm. The average silhouette width was calculated for various clustering schemes. The average silhouette widths for various numbers of atlases are shown in Figure 3. The choice of five‐atlas was adopted according to the maximum average silhouette width. The selected atlas and clustering result is shown in Figure 4. Black hollow dots in Figure 4 were in the atlas selection pool. Blue dots which are connected to the atlas case (red dots) are extra test cases to validate the effectiveness of this generalized atlas. The proposed atlas is comprehensive and can be used for future application.Figure 3: The average silhouette width for different atlas numbers
Figure 4: Anatomical feature parameters for all 90 cases; five out of seventy cases are selected as atlas cases (filled red dots) by k‐medoids algorithm. Hollow black dots are atlas selection pool cases. Filled blue dots are test case pool cases; the red line connecting atlas case and test case indicates the match atlas case for each test query case.
3.2 Goal Dose Distribution
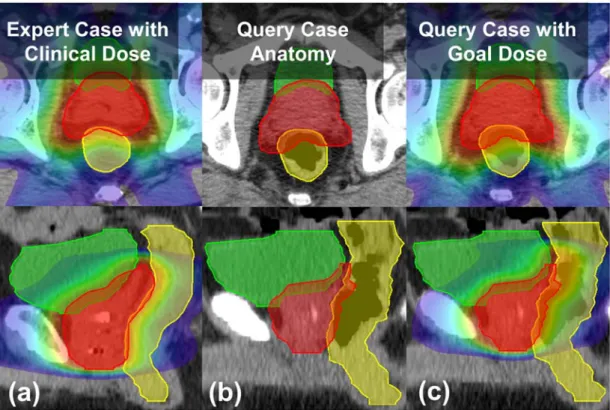
An example of the query case and its goal dose is shown in Figure 5. Anatomical characteristics of the selected atlas case and the query case are similar indicated by the left and middle column of Figure 5, which guarantees conformity of the deformed dose, i.e. the goal dose, to the query case’s anatomy shown in the right column of Figure 5. This conformity is assured because the deformation field transfers the dose change in accordance with the anatomical variation.
Figure 5: Example of goal dose generated from the atlas plan dose. (a): Atlas plan with clinical dose. (b): Query case’s anatomy which is similar to the matched atlas case. (c): Query case’s anatomy with the goal dose generated from the atlas plan dose.
3.3 PTV Coverage and OAR Sparing
Figure 6 shows DVHs for example cases. For case #07 (Figure 6(a)), the DAP plan has better bladder sparing. For case #08 (Figure 6(b)), the DAP plan has similar plan quality with the clinical plan. The DAP plan of case #11 (Figure 6(c)) shows worse rectum low dose sparing. Similar plan quality is observed for case #20 (Figure 6(d)) between two plans. DAP plans provide similar mid‐high dose sparing for the bladder and rectum, which is consistent throughout the query case cohort.
Figure 6: Examples of DVHs between the DAP plan and clinical plan: (a) improved low dose sparing for bladder in the DAP plan is observed in case #07; (b)
similar OAR sparing is present for case #08; (c) worse rectum low dose sparing is observed in the DAP plan for case #11; (d) For case #20, similar overall OAR sparing is
observed. Similar OAR sparing for both the bladder and rectum is provided by DAP plans except some inconsistencies for low dose region in some cases.
Boxplots of dosimetric data and the corresponding p‐value are shown in
the clinical plan (p=0.0045). The OAR sparing improvement provided by the
DAP plan, in terms of bladder gEUD and rectum gEUD, is statistically significant
(p=0.0003,0.0167). The 100% prescription dose volume for both the bladder and
rectum (V100%) of the DAP plan are smaller than those of the clinical plan with
statistical significance (p=0.0057 and p=0.0004 for the bladder and rectum). The
65% prescription dose volume for the bladder also shows significant
improvement (p=0.0206). Other parameters are comparable between two plans.
The comparison indicates that DAP plans have similar plan quality as clinical
Figure 7: Dosimetric data boxplots of DAP plans and clinical plans including HI, CI, gEUD for the bladder and rectum, V100% and V65% for the bladder and rectum.
3.4 Planning Time and Monitor Unit
With optimization objectives derived from the goal dose, the final DAP plan generation is accomplished in 70 continuous iterations (less than 2.5 minutes). Monitor unit for both the DAP plan and clinical plan are shown (Table 1 and Table 2). MU of both plans are similar: 116±24 MU and 124±30 MU for DAP plans and clinical plans respectively, which suggests similar treatment time and leakage radiation. We want to make sure there is no over modulation for our DAP plans compared to clinical plans. The average MU of all beams can reflect the overall level of modulation.24
Table 1: Monitor unit for the DAP plan.
DAP Plan Case 01 02 03 04 05 06 07 08 09 10 Field 1 116 63 97 136 110 124 158 77 136 140 Field 2 114 96 72 95 128 115 86 119 170 123 Field 3 107 120 120 116 114 136 119 87 156 132 Field 4 117 84 76 133 120 98 89 128 149 87 Field 5 116 90 103 108 126 120 102 106 164 143 Field 6 118 118 124 117 122 117 116 85 174 111 Field 7 111 74 79 81 118 92 84 123 144 111 Sum 799 645 671 786 838 802 754 725 1093 847 DAP Plan Case 11 12 13 14 15 16 17 18 19 20 Average Field 1 129 91 152 108 132 115 158 129 116 120 Field 2 138 130 126 94 100 113 112 72 130 112 Field 3 137 116 187 109 140 160 121 112 115 84 Field 4 136 114 155 145 69 131 100 95 130 117 Field 5 118 106 156 112 100 122 96 84 133 102 Field 6 137 134 137 165 117 139 129 121 144 84 Field 7 141 87 112 142 69 110 107 80 85 101 Sum 936 778 1025 875 727 890 823 693 853 720 116±24
25
Table 2: Monitor unit for the clinical plan.
Clinical Plan Case 01 02 03 04 05 06 07 08 09 10 Field 1 137 105 114 109 131 96 117 103 118 120 Field 2 128 119 102 136 127 114 103 100 129 95 Field 3 174 177 153 179 132 123 108 110 125 104 Field 4 103 162 100 153 131 85 92 118 166 71 Field 5 109 144 97 121 125 136 93 101 164 86 Field 6 155 203 182 206 130 107 100 94 126 93 Field 7 140 110 117 111 145 103 92 86 137 91 Sum 946 1020 865 1015 921 764 705 712 965 660 Clinical Plan Case 11 12 13 14 15 16 17 18 19 20 Average Field 1 105 135 187 102 155 116 166 173 114 114 Field 2 85 131 162 94 113 127 122 88 95 108 Field 3 161 151 133 120 173 162 142 141 106 86 Field 4 82 130 218 114 93 126 118 115 98 87 Field 5 93 113 179 135 126 131 104 85 108 94 Field 6 144 189 141 173 155 125 152 143 131 91 Field 7 108 104 143 132 79 116 126 94 68 98 Sum 778 953 1163 870 894 903 930 839 720 678 124±30
4. Discussion
A dose‐guided automatic planning technique was proposed and analyzed in this study. Preliminary results demonstrate clinically comparable plan quality of the DAP plan with full automation. The PTV coverage for the DAP plan is similar to the clinical plan. Although statistical significance is observed for some parameters, the difference is in general small; and the clinical significance from this difference will require further study.4.1 Atlas Efficacy and Efficiency
A prostate IMRT plan atlas was established in this study. Based on the two anatomy quantification measures, the PDP and the concaveness angle, all prostate cases were classified and clustered. This parameterization process identifies the selected atlas cases from the case pool. The proposed atlas, although with a small size, can cover various anatomical configurations. Query cases and their match case have similar geometry, especially in axial and sagittal view which is constrained by the two quantification measures, in terms of the position of the SV relative to the prostate and the concaveness of the posterior wall of the prostate. This similarity reduces the risk of introducing unrealistic goal dose distribution for the query case by decreasing the difficulty of the deformable image registration. The comprehensiveness of the proposed atlas is an important premise for the success of the DAP method. This atlas is also
established from a plan pool with a large number of cases which makes the atlas a generalized one suitable for any new prostate IMRT case. Compared to the previously proposed prostate case library of 100 cases [33], the atlas is highly efficient. This improved efficiency is realized by the application of the deformable image registration. Through the result we discover that the deformable image registration used in this study is able to accomplish the duty of fine tuning the local anatomical variations between the atlas case and query case. Since the deformable image registration is not perfect and may fail in the case of the presence of large variation, it is not wise to set up a single standardized prostate case to deform to any new prostate anatomy. A certain number of the atlas cases are therefore required, and an atlas of five cases can be qualified for the task. The silhouette width analysis determined the optimal size of an atlas based on the available case pool. The atlas of five cases was selected as the most efficient clustering scheme according to the maximum average silhouette width. The successful implementation of the DAP method with the five‐case atlas proves the effectiveness of generating dose guidance from a small size atlas.
4.2 Deformable Image Registration Accuracy
The success of the DAP technique also relies on the accuracy of the deformable image registration. The contour‐based free form deformable image registration was used
in this study. With the help of the workflow in MIM™, the contour expansion and masking process is highly efficient. The contour‐based deformable image registration focuses more on the volume point of view, where the concentration is put on lining the contour rather than specifically linking the pixels. To better regulate the deformation accuracy, customized contour expansion is added to the PTV to mimic the dose distribution around the target. The example deformation performance is shown in Figure 8. As can be seen from the comparison, high agreement is reached between the deformed CT from the atlas case and the target CT of query case with minor difference observed. This accuracy guarantees the successful dose warping onto the query case’s anatomy, and therefore the success of the DAP technique. Intensity‐based deformable image registration was also tested. The deformed CT from the atlas case and the target CT of query case is shown in Figure 9. Some errors are observed in the deformed CT (shown in red arrow) especially around the edge which will affect the dose warping. This study mainly focuses on the feasibility of the DAP technique rather than comparing and analyzing the deformation accuracy. Close analysis of the accuracy of deformable image registration is a hot topic and requires further study. However, based on current deformation result it is intuitive that contour‐ based deformable image registration is more favorable than the intensity‐based deformable image registration.
(b)
(a)
Figure 8: Comparison of (a) the deformed CT of the atlas case through the deformation field and (b) the CT of the query case. Images are masked for different
CT numbers. High agreement is reached between two CTs indicating the accurate contour‐based deformable image registration.
(b)
(a)
Figure 9: Intensity‐based deformable image registration comparison. (a) The deformed CT of the atlas case through the deformation field; (b) the CT of the query
case. Variations are observed between images especially at edges (red arrow). Potential error in the edge deformation may degrade the deformable image
registration accuracy.
4.3 Goal Dose Conformity on Target
As shown in Figure 5, the goal dose generated from the clinical dose for the atlas case through deformable image registration is highly conformal on the query case’s anatomy. This conformity is transferred from the atlas through deformable image registration to the query case. The conformity of the dose on the target, especially high dose levels, is the knowledge that we transfer from the atlas to the query case. The goal dose distribution can reveal the achievable dose distribution for specific patient and is
reflected in the goal dose DVH. From the result we also notice that the quality of the plan, in terms of OAR sparing performance, is transferred to the query case. For certain atlas case whose high dose levels are tight around the target to better spare the OARs, the DAP plan generated from it also shows better OAR sparing for the query case. However, this improvement is not systematic and cannot be further emphasized to claim the overall plan quality improvement for prostate IMRT planning using DAP technique. The main goal of this study, as mentioned earlier, is to generate IMRT plan based on best available knowledge rather than the absolute best knowledge achievable.
4.4 Plan Quality Comparison
4.4.1 Dose Distribution
Example dose distribution for the DAP plan and the clinical plan is shown in Figure 10. For this example case, the DAP plan has better dose conformity around the target while some non‐conformal isodose levels are observed for the clinical plan. The conformity is guaranteed by the dose transfer through the deformable image registration and this conformity is consistent throughout the DAP plans. On the other hand, the conformity of the clinical plan is various depending on the clinical requirement for each case. Such non‐conformal dose is observed for some other clinical plans and may introduce some unnecessary dose to the OARs although the amount is not substantial.DAP Plan
Clinical Plan
Figure 10: Dose distribution comparison between the DAP plan and the
clinical plan. More conformal dose is observed for the DAP plan for this case (white arrow).
4.4.2 Dosimetric Parameters
The DAP plan and the clinical plan are generally comparable in terms of the dosimetric parameters. Some statistical significance is present for some parameters such as the conformity index and the OAR gEUDs; the clinical significance is unknown in the current context of this study. However, we are confident to draw the conclusion that the DAP technique can generate clinically accepted automatic IMRT plan. By analyzing and comparing the DVHs of the DAP plan and the clinical plan, larger low dose region in both bladder and rectum is observed for some cases planned with the DAP method. This situation might be due to the fact that low dose regions typically do not conform to the target, therefore not effectively warped by deformable registration. In our approach the contour‐based deformable image registration onlyfocuses on mid‐high dose levels (>50% Rx). Further study is required to better regulate low dose regions.
4.5 Comparison between DAP and Previous Knowledge-based
Techniques
The main contribution of this work is two‐fold: one is the anatomical feature‐ based atlas case selection, and the other one is the deformable image registration‐driven planning knowledge/expertise transfer. Previously, to select a match case from an atlas, volumetric measures like OVH and mutual information (MI) have been used. In this study, we proposed a new anatomical feature‐based metric that considers the relative topological information of different anatomies directly. Compared with more quantitative measures like OVH and mutual information (MI), simple anatomical features can more easily indicate the potential of minimizing the OAR dose while maximizing the target dose as they directly picture the relative position of OARs and the target in the ionization field. These simple features are also closer to what the planner uses to anticipate achievable DVHs, therefore making it more straightforward, fast and require less computation power. The other contribution, the deformable image registration‐driven plan expertise transfer, eliminates the need to search for exact match between atlas and query anatomies; therefore do not require a large database as atlas or training dataset. By being able to provide adequate dose guidance with only a 5‐plan atlas, this method simplifies the knowledge transfer, and expedites the implementationprocess. The result shows comparable plan quality from the DAP plan when compared to the clinical plan. This result, combined with less requirement on atlas size and more efficient matching criteria, makes the DAP method a promising candidate to aid treatment planning, especially in small and evolving clinics. The goal dose is a full 3D dose distribution and can also be directly used to generate plans without extracting DVH objectives. Danthai et al [8] utilized a voxel‐ based optimization algorithms formulated as a linear goal programming (LGP) model [34] especially suitable for fast on‐line plan re‐optimization. This algorithm could also be applied to our method to further reduce overall treatment planning time.
4.6 Future Direction
The main advantage for the DAP technique is the reduction of treatment planning time and the consistency of generated automatic plan quality. These qualities make the DAP technique an ideal candidate for ART for prostate Stereotactic Body Radiation Therapy (SBRT). Adaptive treatment planning for prostate IMRT has been previously proposed [10]. This method relies on previously treated plan for the patient which makes this method suitable for multi‐fractionated treatment such as IMRT. However, for a five‐fraction SBRT, limited plan pool is present for generating the daily optimal plan for the patient. The feature‐based anatomy parameterization can quantify the anatomy in advance and may be able to predict the motion pattern of the PTV whichincludes the SV. By creating a series of plans for the patient for various possible motion patterns, the daily target can be covered by one of the prepared plans with the on‐board image guidance used to localize the target.
5. Conclusions
Current IMRT planning is a trial‐and‐error process which requires
iterative adjustment on optimization objectives. The plan quality is highly
dependent on the experience of a planner. Previous studies in automatic
planning rely on a large atlas of previous cases to ensure accuracy. A fully
automated IMRT treatment planning method is described. Two anatomical
feature‐based metrics are used to select the most similar case from a well
clustered 5‐plan atlas and deformable registration is further applied to fine‐tune
the linkage between the query case and the matched case in the atlas. Large
amount of data processing is avoided and treatment planning time is reduced.
Dose‐guided automatic planning demonstrates the feasibility and efficiency
References
1. Teh BS, Woo SY, Butler EB. Intensity modulated radiation therapy (imrt): A new
promising technology in radiation oncology. The Oncologist 1999;4:433‐442.
2. Pirzkall A, Carol M, Lohr F, Hoss A, Wannenmacher M, Debus AJ. Comparison of intensity‐modulated radiotherapy with conventional conformal radiotherapy for complex‐shaped tumors. International journal of radiation oncology, biology, physics 2000;48:1371‐1380. 3. Zelefsky MJ, Fuks Z, Happersett L, Lee HJ, Ling CC, Burman CM, Hunt M, Wolfe T, Venkatraman ES, Jackson A, Skwarchuk M, Leibel SA. Clinical experience with intensity modulated radiation therapy (imrt) in prostate cancer. Radiation oncology 2000;55:241‐249. 4. Guckenberger M, Flentje M. Intensity‐modulated radiotherapy (imrt) of localized
prostate cancer: A review and future perspectives. Strahlentherapie und Onkologie :
Organ der Deutschen Rontgengesellschaft [et al] 2007;183:57‐62.
5. Crook JM, Raymond Y, Salhani D, Yang H, Esche B. Prostate motion during standard
radiotherapy as assessed by fiducial markers Radiation oncology 1995;37:35‐42.
6. Huang E, Dong L, Chandra A, Kuban DA, Rosen II, Evans A, Pollack A. Intrafraction prostate motion during imrt for prostate cancer. International journal of radiation
oncology, biology, physics 2002;53:261‐268.
7. Willoughby TR, Kupelian PA, Pouliot J, Shinohara K, Aubin M, Roach M, 3rd, Skrumeda LL, Balter JM, Litzenberg DW, Hadley SW, Wei JT, Sandler HM. Target localization and real‐time tracking using the calypso 4d localization system in patients with localized prostate cancer. International journal of radiation
oncology, biology, physics 2006;65:528‐534.
8. Wu QJ, Thongphiew D, Wang Z, Mathayomchan B, Chankong V, Yoo S, Lee WR, Yin FF. On‐line re‐optimization of prostate imrt plans for adaptive radiation therapy.
Physics in medicine and biology 2008;53:673‐691.
9. Thongphiew D, Wu QJ, Lee WR, Chankong V, Yoo S, McMahon R, Yin FF.
Comparison of online igrt techniques for prostate imrt treatment: Adaptive vs
10. Li T, Thongphiew D, Zhu X, Lee WR, Vujaskovic Z, Yin FF, Wu QJ. Adaptive prostate igrt combining online re‐optimization and re‐positioning: A feasibility study. Physics in medicine and biology 2011;56:1243‐1258.
11. Li T, Zhu X, Thongphiew D, Lee WR, Vujaskovic Z, Wu Q, Yin FF, Wu QJ. On‐line
adaptive radiation therapy: Feasibility and clinical study. Journal of oncology
2010;2010:407236.
12. Ghilezan M, Yan D, Liang J, Jaffray D, Wong J, Martinez A. Online image‐guided intensity‐modulated radiotherapy for prostate cancer: How much improvement can we expect? A theoretical assessment of clinical benefits and potential dose escalation by improving precision and accuracy of radiation delivery.
International journal of radiation oncology, biology, physics 2004;60:1602‐1610. 13. Das IJ, Moskvin V, Johnstone PA. Analysis of treatment planning time among
systems and planners for intensity‐modulated radiation therapy. Journal of the
American College of Radiology : JACR 2009;6:514‐517.
14. Batumalai V, Jameson MG, Forstner DF, Vial P, Holloway LC. How important is dosimetrist experience for intensity modulated radiation therapy? A comparative
analysis of a head and neck case. Practical Radiation Oncology 2013;3:e99‐e106.
15. Yuan L, Ge Y, Lee WR, Yin FF, Kirkpatrick JP, Wu QJ. Quantitative analysis of the factors which affect the interpatient organ‐at‐risk dose sparing variation in imrt
plans. Med Phys 2012;39:6868‐6878.
16. Chanyavanich V, Das SK, Lee WR, Lo JY. Knowledge‐based imrt treatment planning
for prostate cancer. Medical Physics 2011;38:2515.
17. Wu B, Ricchetti F, Sanguineti G, Kazhdan M, Simari P, Jacques R, Taylor R, McNutt T. Data‐driven approach to generating achievable dose‐volume histogram
objectives in intensity‐modulated radiotherapy planning. International journal of
radiation oncology, biology, physics 2011;79:1241‐1247.
18. Zhu X, Ge Y, Li T, Thongphiew D, Yin FF, Wu QJ. A planning quality evaluation tool
for prostate adaptive imrt based on machine learning. Med Phys 2011;38:719‐726.
19. Lian J, Yuan L, Ge Y, Chera BS, Yoo DP, Chang S, Yin F, Wu QJ. Modeling the dosimetry of organ‐at‐risk in head and neck imrt planning: An intertechnique
20. Appenzoller LM, Michalski JM, Thorstad WL, Mutic S, Moore KL. Predicting dose‐
volume histograms for organs‐at‐risk in imrt planning. Med Phys 2012;39:7446‐
7461.
21. Ahunbay EE, Peng C, Chen GP, Narayanan S, Yu C, Lawton C, Li XA. An on‐line
replanning scheme for interfractional variations. Med Phys 2008;35:3607‐3615.
22. Ahunbay EE, Peng C, Godley A, Schultz C, Li XA. An on‐line replanning method for
head and neck adaptive radiotherapy. Med Phys 2009;36:4776‐4790.
23. Ahunbay EE, Peng C, Holmes S, Godley A, Lawton C, Li XA. Online adaptive replanning method for prostate radiotherapy. International journal of radiation
oncology, biology, physics 2010;77:1561‐1572.
24. Han X, Hoogeman MS, Levendag PC, Hibbard LS, Teguh DN, Voet P, Cowen AC,
Wolf TK. Atlas‐based auto‐segmentation of head and neck ct images. Medical
image computing and computer‐assisted intervention : MICCAI International
Conference on Medical Image Computing and Computer‐Assisted Intervention 2008;11:434‐441.
25. Stapleford LJ, Lawson JD, Perkins C, Edelman S, Davis L, McDonald MW, Waller A, Schreibmann E, Fox T. Evaluation of automatic atlas‐based lymph node
segmentation for head‐and‐neck cancer. International journal of radiation oncology,
biology, physics 2010;77:959‐966.
26. Strassmann G, Abdellaoui S, Richter D, Bekkaoui F, Haderlein M, Fokas E, Timmesfeld N, Vogel B, Henzel M, Engenhart‐Cabillic R. Atlas‐based semiautomatic target volume definition (ctv) for head‐and‐neck tumors.
International journal of radiation oncology, biology, physics 2010;78:1270‐1276. 27. Langerak TR, Berendsen FF, Van der Heide UA, Kotte AN, Pluim JP. Multiatlas‐
based segmentation with preregistration atlas selection. Med Phys 2013;40:091701.
28. Kaufman L, Rousseeuw P. Clustering by means of medoids: Fac., Univ.; 1987. 29. Rousseeuw PJ. Silhouettes: A graphical aid to the interpretation and validation of
clustere analysis. Journal of Computational and Applied Mathematics 1987;20:53‐65. 30. Wu Q, Mohan R, Morris M, Lauve A, Schmidt‐Ullrich R. Simultaneous integrated
squamous cell carcinomas. I: Dosimetric results. International journal of radiation
oncology, biology, physics 2003;56:573‐585.
31. Paddick I. A simple scoring ratio to index the conformity of radiosurgical treatment
plans. Technical note. Journal of neurosurgery 2000;93 Suppl 3:219‐222.
32. Oliver M, Bush K, Zavgorodn S, Ansbacher W, Beckham W. Understanding the
impact of rapidarc therapy delivery errors for prostate cancer. Journal of applied
clinical medical physics 2011;12:32‐43.
33. Good D, Lo J, Lee WR, Wu QJ, Yin FF, Das SK. A knowledge‐based approach to improving and homogenizing intensity modulated radiation therapy planning quality among treatment centers: An example application to prostate cancer planning. International journal of radiation oncology, biology, physics 2013;87:176‐181. 34. Chankong V, Haimes Y. Multiobjective decision making: Theory and methodology
(amsterdam, north holland) 1983.