EdData II
Education Data for Decision
Making (EdData II):
Data for Education Programming in
Asia and Middle East (DEP/AME)
Nepal Early Grade Reading Assessment,
Education Management Efficiency Study and
Teacher Observation Study
Final Report
EdData II Technical and Managerial Assistance, Task Number 15 Contract Number: AID-OAA-BC-11-00001
April 2014
This publication was produced for review by the United States Agency for International Development. It was prepared by RTI International.
Education Data for Decision
Making (EdData II):
Data for Education Programming in
Asia and Middle East (DEP/AME)
Nepal Early Grade Reading Assessment,
Education Management Efficiency Study and
Teacher Observation Study
EdData II
Task Order No. 15
Prepared for
Mitch Kirby/Asia Bureau COR [email protected]
USAID/Nepal
Prepared by RTI International 3040 Cornwallis Road Post Office Box 12194
Research Triangle Park, NC 27709-2194
RTI International is a trade name of Research Triangle Institute.
The authors’ views expressed in this publication do not necessarily reflect the views of the United States Agency for International Development or the United States Government.
Table of Contents
List of Figures ... v
List of Tables ... vii
Abbreviations ... viii
I. Project Description and Overview ... 1
Objective and Structure of this Report ... 1
Survey Scope and Methodology ... 1
Descriptive Statistics of the Sample ... 3
Availability of Equipment and Infrastructure ... 4
II. Findings... 6
1. Overview of Findings ... 6
2. Research Questions (RQs) 1 and 2: Education Leadership, Management Practices, and Attitudes. ... 7
3. RQ 3: Knowledge and Practices Related to the Teaching of Reading ... 12
4. RQ 4: Availability of Teaching and Learning Materials ... 18
5. RQ 5: Opportunities for mother-tongue-based multi-lingual education (MTB-MLE) ... 21
6. RQ 6: Capacity and Readiness of Existing Teacher Professional Development (TPD) System ... 25
7. RQ 7: Teacher Motivation and Participation ... 30
III. Conclusions ... 34
Attachment 1: EMES/TOS Research Questions ... 37
Attachment 2: Final EMES-TOS Instruments ... 39
2.1 Head Teacher (HT), School Inventory and SMC Interview Instruments ... 40
2.2 Teacher Observation, Classroom Inventory, and Teaching Interview Instruments ... 70
2.3 District Education Officer Interview and DEO Inventory Instruments ... 97
2.4 Resource Person Interview and Resource Center Inventory Instruments .... 112
2.5 Education Training Center Interview and Inventory Instruments ... 124
Attachment 3: Summary of Interview Findings with MOE and CLAs ... 139
3.1 Interview Questions for MOE and CLAs ... 139
3.2 Summary of Interviews ... 148
Attachment 4: Index Composition Tables and Analysis of Scores ... 154
4.1 Summary of School Leadership and Management Index ... 155
4.2 Summary of Reading Instructional Index ... 156
4.4 Summary of Remediation Practices Index ... 158 4.5 Summary of Teaching and Learning Materials Index ... 159
List of Figures
Figure I.1: Distance of schools from DEO ... 3
Figure I.2: G2 girls’ enrollment at schools ... 3
Figure I.3: Teachers by status ... 4
Figure I.4: Districts by size ... 4
Figure I.5: Schools with computers ... 5
Figure I.6: Available equipment at ETCs, DEOs and RCs. ... 5
Figure II.2.1: Schools that produce information on learner performance ... 8
Figure II.2.2: Percentage of schools utilizing parental and community resources for EGR... 9
Figure II.2.3: Differences in schools’ abilities to raise revenues ... 9
Figure II.2.4: School budget line items relevant to EGR ... 10
Figure II.2.5: Reading promotion initiatives offered by schools ... 10
Figure II.2.6: School leadership & management index... 11
Figure II.3.1: Recorded observations of language instruction practices ... 13
Figure II.3.2: Observations of child-centered teaching practices ... 14
Figure II.3.3: Reading remediation programs offered by schools ... 15
Figure II.3.4: Frequency of reading and writing assignments given to G2 students ... 15
Figure II.3.5: Participation in supplemental reading lessons ... 16
Figure II.3.6: Reading instructional practice index ... 17
Figure II.3.7: Child-centered instruction index—raw scores ... 17
Figure II.3.8: Remediation practices index—raw scores ... 18
Figure II.4.1: Availability of language textbooks ... 18
Figure II.4.2: Suitability of existing language textbooks ... 19
Figure II.4.3: Opinion on textbook usefulness and appropriateness ... 19
Figure II.4.4: Schools with libraries ... 20
Figure II.4.5: Classrooms with supplemental materials ... 20
Figure II.4.6: Teaching and learning materials index ... 20
Figure II.5.1: Schools by type ... 21
Figure II.5.2: Percentage of G2 students sharing language with G2 teacher ... 22
Figure II.5.3: Attitudes of education officers toward mother-tongue instruction ... 24
Figure II.5.4: Attitudes of parents toward mother tongue ... 24
Figure II.5.5: Percentage of districts with schools implementing MTB-MLE ... 24
Figure II.5.6: DEO staff and RC trainers with mother tongue experience in the districts ... 25
Figure II.6.2: Head teacher attitudes toward TPD ... 26
Figure II.6.3: ETC facilities for training and boarding ... 27
Figure II.6.4: School to supervisor ratios of surveyed districts ... 28
Figure II.6.5: School:Nepal RT Specialist Ratios ... 28
Figure II.6.6: Teacher: RT Ratios ... 28
Figure II.6.7: Frequencies of G2 classroom observation ... 29
Figure II.6.8: School proximity to DEO and DEO supervisory visits ... 30
Figure II.6.9: Classroom observation by head teacher and teacher status ... 30
Figure II.7.1: Self-reported motivation for teaching ... 31
Figure II.7.2: Teacher subject preference ... 31
Figure II.7.3: Teacher grade preference ... 31
Figure II.7.4: Teacher absenteeism in academic year ... 32
Figure II.7.5: Reasons reported for extended absence (2- plus weeks) ... 32
Figure II.7.6: Relationship between motivation and teacher absenteeism ... 32
Figure II.7.7: Relationship between teacher status and motivational factors ... 33
Figure II.7.8: Teacher type and child-centered teaching scores ... 33
Figure II.7.9: Motivation factor and child-centered teaching scores ... 33
Figure II.7.10: Teacher presence and child-centered teaching scores ... 33
Figure III.1: Summary results of indexed scores... 36
Figure 4.1: Summary Analysis of School Leadership and Management Index ... 155
Figure 4.2: Summary Analysis of Reading Instructional Index ... 156
Figure 4.3 Summary Analysis of Child-Centered Instructional Index ... 157
Figure 4.4 Summary Analysis of Remediation Practices Index ... 158
List of Tables
Table I.1: Number of respondents per instrument ... 2 Table I.2: EMES-TOS sample frame ... 3 Table II.1: Proportion of schools where teachers and students not share dominant
language, by school type ... 22 Table II.2: Teacher belief statements related to mother-tongue instruction ... 23 Table II.3: Work practices of TPD providers ... 27
Abbreviations
Asia/ME Asia and Middle East
CI Classroom Inventory
CLA central level agency
DEC District Education Committee DEO District Education Office
DEP-AME Data for Education Programming in Asia and the Middle East EdData Education Data for Decision Making
EGR early grade reading
EGRA early grade reading assessment EGRP Early Grade Reading Program
EMES-TOS Education Management Efficiency Study and Teacher Observation Study ETC education training center
FME Federal Ministry of Education, Nigeria
G Grade
HT head teacher
MOE Ministry of Education
MT mother tongue
MTB-MLE mother-tongue-based multi-lingual education NEDS National Education Household Survey
NEMIS National Education Management Information Systems PTA parent-teacher association
RC resource center
RP resource person
RQ research question RT roster trainer
RTI RTI International (trade name of Research Triangle Institute) SMC School Management Committee
SOW Scope of Work
TI Teacher Interview
TO Teacher Observation
TPD teacher professional development TWG Technical Working Group
I.
Project Description and Overview
The Data for Education Programming in Asia and the Middle East (DEP/AME) Task Order is intended to generate regional and country-specific education data—and analysis of those data—that can be used by Asia and Middle East (Asia/ME) bureaus, missions, and partner countries to prioritize education needs and corresponding investment. This activity, titled the Nepal Early Grade Reading Assessment, Education Management Efficiency Study and Teacher Observation Study (EMES-TOS) in support of the Early Grade Reading Program (EGRP) in Nepal, is funded under Result 1: Asia/ME Mission Strategy Related Data Needs Met, which is intended to strengthen local skill in design, evaluation, and management of education programs, and quality data capture and analysis to support them.
This activity will result in a nationally representative early grade reading assessment (EGRA) of Grade (G) 2 and G3 students in Nepal public schools for Nepali. The EMES-TOS will provide a description of the current instructional practices and institutional and management capacity requirements to support a coherent national early grade reading program. Each of these assessments and studies is intended to provide a useful baseline or benchmark by which the effectiveness of the upcoming national reading program could be measured.
Objective and Structure of this Report
The purpose of this report is to provide data on specific education management capacities and teaching practices that will affect the Ministry of Education’s (MOE’s) ability to implement and sustain a national EGRP at scale. In so doing, we examine the variety of system
structures and attributes that lend themselves to EGRP implementation, identify existing gaps and capacities to be addressed, and highlight the strengths and opportunities that could be leveraged by the Ministry and its financial and technical partners.
This analysis is guided through the prism of the core research questions (RQs) (see
Attachment 1) that were developed and agreed upon in consultation with the MOE and its stakeholders. This report presents data that address each of the research questions. It also uses those data to reach summary conclusions about the extent to which the education system in Nepal is prepared to support implementation of a national EGRP. In addition, these
conclusions identify additional areas for further research or exploration that could be useful for decision makers. To get started, a brief description of the sample respondents and their characteristics will help the reader contextualize the findings within the scope of this survey.
Survey Scope and Methodology
The EMES-TOS comprises 12 distinct survey instruments designed to obtain quantitative and qualitative data at each level of the education system, from schools and classrooms to
resource centers (RCs), districts and education training centers (ETCs), to MOE and its central level agencies (CLAs). RTI, along with New ERA and the MOE, developed and adapted the following instruments (see Attachment 2).
School-Level Instruments
• Head Teacher Interview
• Teacher Observation
• Classroom Inventory
• School Inventory
• School Management Committee Member Interview District-Level Instruments
• District Education Office Director Interview
• District Education Office Inventory
• Resource Person Interview
• Resource Center Inventory
• Education Training Center Instructor Interview
• Education Training Center Inventory
National-level interviews. Interviews were held with senior officers from the MOE and its CLAs. A brief discussion of the results and implications of these interviews, along with the interview questions, are found in Attachment 3.
The adaptation, training, and field administration of these instruments occurred between late November and late December 2013. Table I.1 provides the number of respondents for each instrument:
Table I.1: Number of respondents per instrument
School Inventory1 N = 104 Teacher Interview/Classroom
Inventory/ Teacher Observation N = 104
Community-managed N = 94 Male Teachers N = 41
Community school N = 9 Female Teachers N = 63
Private N = 9 Grade 2 Teachers N = 95
SMC Interview N = 104 Grade 3 Teachers N = 5
DEO Interview/Inventory N = 13 Multi-grade Teachers N = 4 RP Interview/ RC Inventory N = 26 RCs English Lesson N = 4
ETC Interview/Inventory N = 7 ETCs Nepali Lesson N = 100
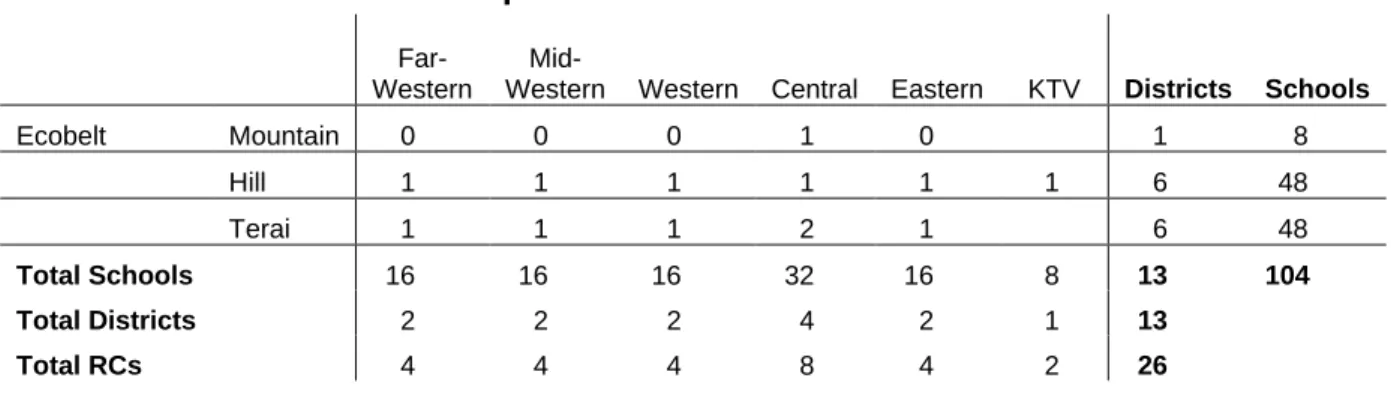
Table I.2 provides a summary breakdown of the number of schools by district, region, and ecobelt. The sample of schools was drawn from 13 districts, which were selected from the broader 33 districts that were sampled for the much larger EGRA.
1
The results in this report reflect only government (community and community-managed) schools. The study obtained anecdotal data for nine private schools in the urban districts of Bhaktapur, Syangja, and Chitwan. Summary findings from the private schools will be prepared in a separate report. Note one of the school-type responses is missing.
Table I.2: EMES-TOS sample frame
Far-Western
Mid-Western Western Central Eastern KTV Districts Schools
Ecobelt Mountain 0 0 0 1 0 1 8 Hill 1 1 1 1 1 1 6 48 Terai 1 1 1 2 1 6 48 Total Schools 16 16 16 32 16 8 13 104 Total Districts 2 2 2 4 2 1 13 Total RCs 4 4 4 8 4 2 26
Descriptive Statistics of the Sample
The sample of schools visited, in terms of their enrollment and distance from the District Education Office (DEO), reflects a balanced distribution. Figures I.1 and I.2 illustrate the distribution of schools by size and proximity. The average distance of schools from the DEO is 43 kilometers. The average distance grade 2 enrollment is 13 girls and 14 boys.
Figure I.1: Distance of schools from DEO
Figure I.2: G2 girls’ enrollment at schools 21 27 16 33 6 0 5 10 15 20 25 30 35 40 0 to 10 km 11 to 30 km 31 to 50 km 51 to 100 km 101 km+ 17 34 33 17 3 0 5 10 15 20 25 30 35 40 Less than 5 5 to 10 11 to 20 21 to 40 40 plus
Figure I.3: Teachers by status Local, 27 Permanent, 32 Temporary, 40 Other, 5 The teachers observed and
interviewed also reflect a balance in terms of the distribution of their teaching status. Figure I.3 breaks down the number of teachers by their position status at the school.
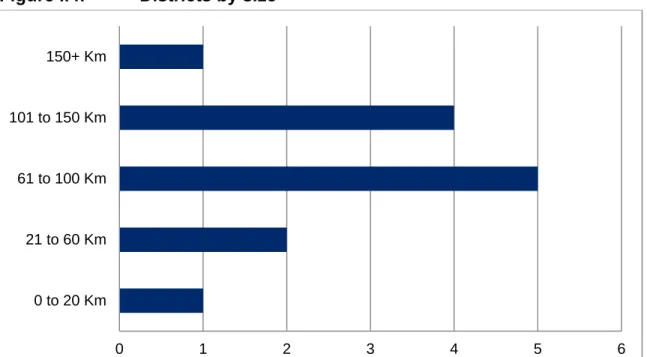
Figure I.4 uses the distance from the DEO to the furthest school within a district as a proxy for the geographic size of the districts included in the survey. The graph shows a balanced distribution between more compact
districts (distance of 0 to 20, or 21 to 60 km from the DEO to the furthest school) and more spread out districts (over 100 km from the DEO to the furthest school); with most schools in the medium size range (61 to 100 km).
Figure I.4: Districts by size
Availability of Equipment and Infrastructure
The availability of computers, vehicles, and other equipment at each level is an important indicator of the capacity and readiness of the education system to support an EGRP at scale. These data are provided under the descriptive statistics section as they can directly or
indirectly relate to each of the research questions in some way. Additionally, this information helps to explain some of the basic constraints that implementation of a national early grade reading program could face at decentralized levels in the system, as well as indicates what each level of the education system could be realistically expected to accomplish.
0 1 2 3 4 5 6 0 to 20 Km 21 to 60 Km 61 to 100 Km 101 to 150 Km 150+ Km
Figure I.5: Schools with computers 0 2 4 6 8 10 12 14 16 1 2 to 5 6+
Computers and internet at school. While the vast majority of schools sampled do not have computers (n = 72), encouragingly, 32 of the schools reported having at least one computer. Of these, 14 schools reported having an internet connection. Weighting for this nationally, we estimate approximately
13% of all schools have some form of internet connection.
Figure I.5 shows that of the schools that have computers, more than half have fewer than 5 total, and only 14 schools have six or more.Note 72 schools reported not having any computers. We estimate that approximately 75% of
schools nationally will be without computers
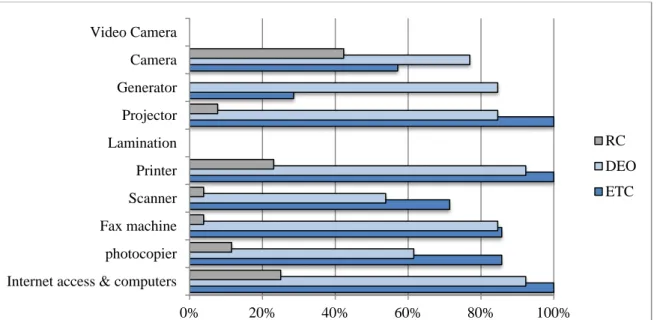
Equipment at ETCs, DEOs, and RCs.
Figure I.6: Available equipment at ETCs, DEOs and RCs.
Figure I.6 illustrates relative lack of equipment at the observed RCs, in comparison to those ETCs and DEOs that were observed. Note that while most DEOs interviewed had at least one or two vehicles, none of the resource persons indicated they had an official motorbike or vehicle to use for school visits.
0% 20% 40% 60% 80% 100%
Internet access & computers photocopier Fax machine Scanner Printer Lamination Projector Generator Camera Video Camera RC DEO ETC
II. Findings
1. Overview of FindingsAs stated above, the purpose of this survey was to gauge the extent to which the education system in Nepal can support a national early grade reading improvement program. The survey instruments deployed in the EMES-TOS examine what is happening at the school level (in terms of instruction and other core practices) and also gather information regarding the capacity and functioning of district offices, resource centers, and education training centers. The general picture of the system that emerges from analyzing the results of the various survey instruments is discussed below.
Most schools benefit from relatively small class sizes in the early grades, making it possible for teachers to provide more attention to individual students. Additionally, almost all teachers share attitudes reflective of child-centered approaches to instruction, and those attitudes translate fairly consistently into classroom practices that include engaging all
students in the lesson, encouraging students to ask questions, and permitting students to speak up in class. More advanced instructional techniques, such as appropriate approaches to correcting student errors, are also in evidence but only in some classrooms.
Reading instruction in G2 is focused on oral language and reading text, with little to no focus on letters, letter sounds, phonics and the building blocks of literacy acquisition.
Textbooks are readily available in Nepali and English, although not always in sufficient numbers for all students. Materials in mother-tongue languages are essentially absent from all but a handful of schools. Supplemental materials in Nepali are available in less than 40% of schools; those in English in less than 30%. Only about a third of schools have a library. Most school and community leaders see teaching reading in the early grades as a priority, and many schools organize activities to support literacy. However, very few schools take on the more challenging tasks of tracking, reporting, and using data on student performance in reading. Some, but not all schools are working with their communities in productive ways, and there are examples of good practice—offering remedial classes to struggling students, mobilizing volunteers from the community to support reading instruction, raising funds specifically to support improved literacy instruction in early grades.
Teachers and schools recognize the need for additional support for students who are
struggling, but do not consistently offer the interventions that could best help those students. Also, there is some divergence of opinion with the majority of teachers thinking additional attention should go to struggling students, while head teachers and SMC members think the added attention should go to the best students.
In almost half the schools Nepali is the language shared by the vast majority of students and their teachers. In another 30% of schools students were found to share a common mother tongue other than Nepali, but in about a quarter of those schools the teacher did not share that language. In 26% of the schools there is heterogeneity of languages among students and teachers. Most teachers share the belief that students learn best in their mother tongue, and the majority of SMC members agreed with the statement that “most parents would prefer that their children learn first in their [mother tongue].” In 40% of districts there are no schools
implementing mother-tongue based, multi-lingual education (MTB-MLE). In another 35% there are only handfuls of schools doing so.
Many districts have no resource center staff who specialize in local language. A majority of districts have a small number of DEO staff specialized in local language and trained in developing local language curriculum.
RCs and ETCs are equipped to serve as training venues. However, just over 30% of teachers have participated in professional development related to language/reading. In contrast, more than 60% of teachers stated they would like to receive training related to language and
reading instruction. School-based support—in the form of monthly meetings among teachers and head teachers—is fairly prevalent, and almost all head teachers also meet monthly at an RC. Outside support to schools is much more limited. The vast majority of teachers report that they are never visited by a resource person or DEO staff member. The ratio of staff to schools in some districts is a constraint to providing support as is the lack of transportation. The remainder of Section II of this report provides more in-depth discussion of the data on which these general findings are based.
2. Research Questions (RQs) 1 and 2: Education Leadership, Management Practices, and Attitudes.
The first RQ guiding this study concerns the extent to which schools are focused on reading/literacy as a priority learning outcome. Whether management practices support a priority on improving reading/literacy is addressed in the second question. Taken together, data relative to these two research questions allow us to understand whether schools and districts are producing and using information on student performance in reading and whether improving reading/literacy is an explicit goal of schools and districts, whether it is something parents and communities are engaged in supporting, and whether resources are explicitly allocated to support reading/literacy related activities.
Analysis of the data generated by the relevant portions of the EMES-TOS survey indicates:
• Few schools produce and share information on early grade reading (EGR) outcomes
• Community and parent-teacher association (PTA) resources are under-utilized
• A majority of schools do organize reading promotion programs, but they are mostly oral language-oriented.
The intention of this line of inquiry is to understand to what extent the leadership in the education system is aligned to the objectives of an EGRP, and what existing school-management practices could be built upon. Taking the view that this program is in many ways a behavioral reform of early grade teaching, the change management strategies must rely on leadership at each level to establish the necessary organizational culture, processes, and accountability systems to ensure such change is rooted at the institutional level.
Production and sharing of learner performance information.
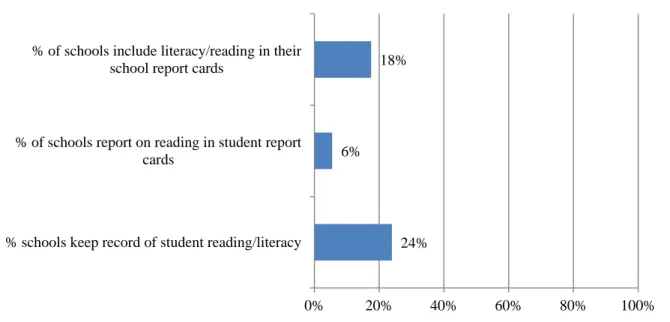
Figure II.2.1 shows that few schools produce learner performance data on reading or literacy. Although 94% of schools conduct end of term/year exams, only 40% report results to the School Management Committee (SMC). Approximately 68% report out results to the
DEO/RCs. On the other hand, an estimated 77% of SMCs receive information on learner performance for grades 1-3.
Figure II.2.1: Schools that produce information on learner performance
The study estimates that 90% of DEOs share information with the District Education Committee (DEC), and 68% of districts include “reading” or “literacy” in their district reports. But only an estimated 39% of all DEOs keep up-to-date records on learner performance received from the schools.
From the teacher perspective, the study finds that an estimated 44% of all teachers share student progress reports with their parents. An estimated 79% of teachers organize teacher-parent conferences at least twice a year.
Utilization of PTA and community resources.
Figure II.2.2 highlights how few schools are taking advantage of PTA and community resources. It also illustrates some discrepancies in the responses between SMCs and head teachers. Promisingly, fewer than 2% of the schools reported not having SMC meetings, whereas an estimated 25% of schools do not have functioning PTAs at all.
24% 6%
18%
0% 20% 40% 60% 80% 100%
% schools keep record of student reading/literacy % of schools report on reading in student report
cards
% of schools include literacy/reading in their school report cards
Figure II.2.2: Percentage of schools utilizing parental and community resources for EGR
School-based financing and initiatives.
The decentralized nature of the school system devolves significant autonomy and
management of resources to the schools’ administration. Figure II.2.3 provides a snapshot of the range of revenues the schools raise internally—resources that could potentially be allocated in part to supporting reading improvement/focused initiatives.
Figure II.2.3: Differences in schools’ abilities to raise revenues
0% 20% 40% 60% 80% 100%
% utilize literacy or reading coaches % draw volunteers to support reading
% raise money with PTA for EGR % work with PTA for book drives and
donations
% provide guidance to parents to help their children with reading
% request parents to help with homework SMC HT Zero 33% Less than $100 10% $100 to $500 25% $500 to $1000 12% $1000 to $2000 5% $2000 to $4000 4% $4000 to $10,000 9% over $10,000 5% > $1000
A third of schools report no local revenue. Another 47% are able to raise up to the equivalent of $1000, with 10% of those raising less than $100. The remaining 23% are the somewhat advantaged schools, able to raise the equivalent of over $1000, with 5% of that group able to raise more than $10,000.2
Figure II.2.4 shows that for many schools that maintain budgets, a good portion are using those resources for programs that could have a positive impact on learning outcomes, such as employing teaching aides (15%) or offering remedial programs (22%).
Figure II.2.4: School budget line items relevant to EGR
In addition to the above programs for which schools may be allocating resources, some schools also organize diverse activities to promote reading, such as those illustrated below. Figure II.2.5 illustrates the typical reading promotion initiatives schools offer. While the majority offer competitions or games, these are typically oriented to the higher performers. In addition, it may be worth exploring what kinds of rewards and incentives are offered and how effective those are.
Figure II.2.5: Reading promotion initiatives offered by schools
2
Note that the percentages do not add to 100% because of rounding.
0% 20% 40% 60% 80% 100% Teacher training Remedial programs Teacher aides Reading books/primers Library materials/facilities No budget available 0% 20% 40% 60% 80% 100%
Reading competitions or games Student rewards/incentives tied to reading Reading clubs Story telling,poetry recital,stage performing Other None at all
Figure II.2.6: School leadership & management index 0 5 10 15 20 25 0 1 2 3 4 5 6 7 8 9 10
The first two research questions guiding the EMES-TOS survey seek to know whether schools and districts are focused on reading/literacy as a priority outcome of early grade teaching and learning, and whether school-based management practices reflect that priority. To summarize the findings across the several types of data collected, an index has been created that joins together information related to:
• A school’s maintenance and use of records on student performance in reading
• Whether the school states that quality, and in particular improving reading in early grades, are its primary mission and goals
• Whether schools work with their communities to improve reading (raising funds for reading improvement, running book drives, recruiting volunteers as teacher aides)
• Whether schools offer remedial instruction and provide literacy coaches or teachers’ assistants focused on reading.
In total, 10 elements are included in the school leadership and management index.3 Index scores range from zero, reflecting an absence of leadership and management practices related to reading/literacy, to 10, which would indicate a school that demonstrates all the desirable practices. Figure II.2.6 shows how schools in the survey scored. Most of the schools had 2 to 4 “Yes” answers out of the 10 items.
While three schools had 0 “Yes” answers, two schools had as many as 8 “Yes” answers. The average number of “Yes” answers for all schools was 3.4 out 10. Such an index could be used as a benchmark or baseline for school performance in these areas of management and leadership related to early grade reading.
Further details regarding the index of school leadership and management are drawn from analysis of the items on which school answered “Yes.” Comparison of the “Yes” answers most frequently given by schools with lower index scores to the “Yes” answers most frequently given by schools with higher scores does reveal some differences. (Note that Figure 4.1 in Attachment 4 shows the difference between low scoring schools and higher scoring schools.)
Most schools said yes to the questions regarding the mission and purpose of the school and to the one regarding holding reading promotion activities. However, those schools that had higher index scores had more “Yes” answers on items that lower scoring schools did not answer yes to, for example: use of student report cards, utilization of literacy coaches, and recruitment of volunteers from the community.
3
Most school and community leaders state that they see teaching reading in the early grades as a priority. Many schools also organize activities that could be supportive of improved
reading/literacy outcomes. However, few schools take on the more challenging tasks of tracking, reporting, and using data on student performance in reading. Schools are working with their communities in productive ways, and there are examples of good practice in some schools—offering remedial classes to struggling students, mobilizing volunteers from the community to support reading instruction, raising funds specifically to support improved literacy instruction in early grades, etc. These attributes represent a foundation upon which future efforts can rely. The gulf between the rhetoric—stating that reading in early grades is a priority—and the actions needed to work systematically towards that priority is what will be a main challenge to a national early grade reading program.
While some important leadership and management practices exist in only a few of the schools, there are enough instances to indicate a norm of behavior that other schools could and should adopt. PTA and community resources appear to be under-utilized, and there is a potential for leveraging school and community resources to finance localized initiatives through school plans and budgets. One area for further exploration is the interplay between the schools, districts, and local development committees, which could offer not only additional revenue streams but opportunities to strengthen horizontal accountability in the system.
3. RQ 3: Knowledge and Practices Related to the Teaching of Reading
In addition to the leadership and management practices addressed through the first two research questions, the third research question is concerned with the knowledge, attitudes, and practices of school staff. To what extent are schools and districts knowledgeable about the best practices for reading instruction? To what extent are good practices demonstrated in early grade classrooms? What are schools doing to reinforce and/or support improved reading outcomes? Are schools cultivating a habit of reading?
The findings from the data indicate the following answers.
• Teachers are generally spending more time in class on oral language, sight reading, and other aspects of a whole language approach to literacy instruction, and spend little if any time on basic phonics and other important instructional areas related to the development of early literacy skills.
• Many classrooms exhibit features of child-centered practice.
• Some schools are trying some remedial activities, but not all activities are likely equally effective.
• Almost half of the schools surveyed are not offering any remedial activities.
• Teachers are giving reading and writing assignments but most schools are not offering supplemental classes.
The remainder of this section presents the details on which these and other conclusions are drawn. Data are presented regarding the observed instructional and classroom management practices of teachers in early grades, the types of remedial programs that schools offer to support students who are struggling, the frequency and type of assignments given by teachers, and the level of student participation in supplemental classes.
Teacher classroom practices.
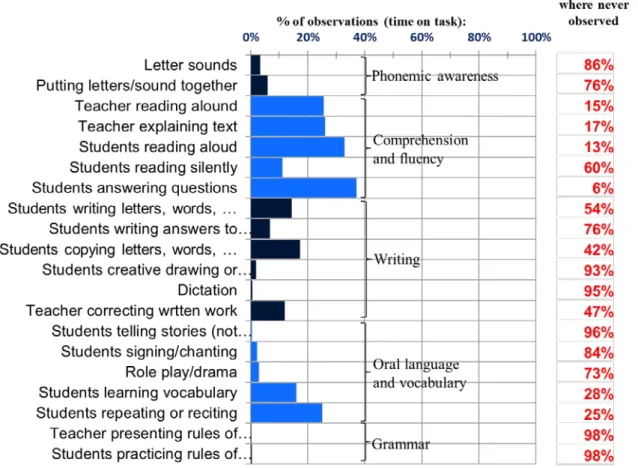
Figure II.3.1 below summarizes the results of the observations conducted in 104 classrooms. The observations were carried out during a language class—almost always Nepali (with a handful of English classes observed). Along the left-hand side activities are listed, showing what the teacher or students were doing during the lesson. The horizontal blue bars show the percentage of all observations during which the indicated activity was seen. For instance, “students answering questions” occurred during nearly 40% of all observations. In contrast, the teaching of letter sounds was noted on less than 3% of the observations. The numbers in red to the right indicate the percentage of all classrooms (out of 104) in which the indicated lesson activity was never observed. For example, during 76% of the observations, the enumerators never noted teachers or students putting letters/sounds together to make words. In contrast, the teacher reading aloud was not at all noted during only 15% of the
observations. Overall, many of the lesson elements integral to a balanced approach to teaching reading are under-represented: notably phonics, students reading silently, and students writing.
Figure II.3.1: Recorded observations of language instruction practices
In addition to the instructional practices related to teaching reading, classroom observations also noted whether child-centered practices were in evidence. The vast majority of teachers are using sound child-centered practices as shown in Figure II.3.2.
Figure II.3.2: Observations of child-centered teaching practices
Attitudes and practices toward remediation.
Figure II.3.3 shows that only a few schools offer any remedial resources or programs for struggling students and that almost half offer none.
In addition, when asked if they agreed with the statement, “stronger students should get more attention because they have a better likelihood to succeed.” 64% of head teachers and 67% of SMCs agreed (or strongly agreed). A bias towards more attention for stronger students is antithetical to what is needed to ensure that all children learn to read in early grades. This may be indicative of a broader school-culture issue to address.
In contrast to the point of view of the head teacher and SMC, when teachers were given the option to choose which statement they agree with most, 96% chose “students who are struggling to read should get the most attention from the teacher so that they can catch up to the rest of the class.
Cultivating a habit of reading. Beyond offering reading promotion activities, schools that wish to promote or cultivate a habit of reading amongst their early grade learners should provide supplemental reading periods, and teachers should regularly assign reading and writing activities to students to complete outside the classroom.
Figure II.3.4 below shows how frequently teachers give students reading and writing assignments. After that, Figure II.3.5 shows whether students participate in supplemental reading lessons, and in schools where supplemental reading lessons are offered, it shows which students do participate.
0% 20% 40% 60% 80% 100%
Teacher called on students whose hand was not raised
Teacher called on all students in the classroom
Teacher called on boys & girls equally Most students stayed on task in the lesson More than half of the children volunteer to
answer
Figure II.3.3: Reading remediation programs offered by schools
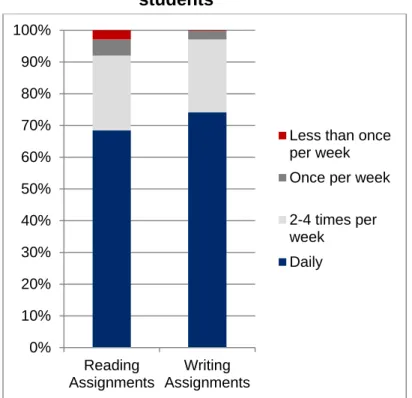
Figure II.3.4: Frequency of reading and writing assignments given to G2 students
0% 20% 40% 60% 80% 100%
Extra / Remedial classes Reference Resources Extra / Co-Curricular Activities Library / Book Corner Other None 0% 10% 20% 30% 40% 50% 60% 70% 80% 90% 100% Reading Assignments Writing Assignments
Less than once per week Once per week 2-4 times per week
Daily
Figure II.3.4
encouragingly shows most teachers give daily reading and writing assignments to their students.
Nevertheless, according to Figure II.3.5, an estimated 78% of all schools do not offer supplemental language or reading lessons. 18% of schools have supplemental lessons for all students, and only a handful (3%) require the weak or struggling students to participate.
Figure II.3.5: Participation in supplemental reading lessons
Summary conclusions. As noted above reading instructional and remedial practices are generally lacking in most of the schools. The key behavioral challenge will be shifting from a whole-word /oral-based approach to a balanced approach that includes key elements of phonemic awareness and phonics. Nevertheless, most teachers appear to have good foundational skills, are generally teaching in child-centered ways, and are generally exhibiting good classroom management practices. There appears to be some divergence of point of view regarding how best to target effort and resources, with head teachers and SMCs favoring providing attention to higher performing students and teachers noting that struggling students are the ones who need additional attention. Cultivating a shared sense of how best to ensure that all children learn to read and how to effectively deploy resources and effort at the school level will be an important challenge going forward. In addition, an area to explore further is whether teachers and education leaders in the system understand the distinctions between language learning and literacy acquisition and therefore see the differences in the pedagogical approaches that are needed for each..
As was the case for school leadership and management, an index was also created to summarize how schools are fairing on issues related to instructional practices and the provision of remedial opportunities.
Indices of instructional and remediation practices.4
Again as was the case for leadership and management, indices summarizing several survey items that relate to the instructional practices, presence of materials, and opportunities for remediation at school were constructed. First, Figure II.3.6 below shows the number of schools with different index scores for items related to reading instructional practice. This index includes 9 items, 6 of which have to do with the kinds of instructional practices observed at a school (whether the practices most associated with good development of reading skills were observed), and 3 of which relate to teachers’ beliefs or attitudes regarding how children learn to read.
4
See Attachment 4 for the list of items that comprise these indices. 79%
18%
3%
0%
Figure II.3.7: Child-centered instruction index— raw scores 0 5 10 15 20 25 30 35 0 1 2 3 4 5 6 7 8 9
Figure II.3.6: Reading instructional practice index
Further analysis of schools’ reading instructional practice index scores is presented in
Attachment 4, Figure 4.2. That analysis reveals that across the board, teachers share beliefs such as it is better to let children express their thoughts, or to let students tell the teacher why they don’t understand something, or to allow students to interrupt the teacher if they have something to add. The items that distinguish schools with high indices from those with low indices are those that concern whether specific instructional practices—teaching phonics and phonemic awareness, students reading to themselves, students writing answers to questions— were observed. This implies that the work to be done to improve reading instruction must focus on actual classroom practice, while building on the broadly shared teacher attitudes that reflect a child-centered approach to teaching.
An index regarding child-centered current instructional practice was also constructed, incorporating several aspects of what was observed during lessons—how teachers call on students, whether students were engaged in the lesson, how the teacher reacts to student responses, and whether the teacher gave a homework assignment.
Figure II.3.7 shows how schools scored on this index of child-centered
instruction.
School had the highest scores on this index. Most schools had scores greater than 6 out of 9 items. The average index score is 7.1 items. This indicates that child-centered practices are evident in most schools in Nepal. Figure 4.3 in Attachment 4 shows that the common items for low-scoring schools reflect student behaviors (children on task and volunteering). Schools with higher index
0 5 10 15 20 25 30 0 1 2 3 4 5 6 7 8 9 Figure II.3.6 shows most schools had index scores between 3 and 6. The average index score is 4.6 out of the total possible of 9.
Figure II.3.8: Remediation practices index—raw scores 0 5 10 15 20 25 30 35 0 1 2 3 4 5 6 7 8 9
scores also exhibited these behaviors, but in addition more frequently demonstrated complex instructional practices, such as the teacher asking students a clarifying question or
encouraging the student to try again when they give a wrong answer. The last index created
for this section of the analysis concerns whether schools offer and students participate in supplemental or remedial programs. Figure II.3.8 shows most schools had a score of 2 to 5 on this index, and no school scored higher than 6. The average score is 3.4 out of 9. As with the other
indices, further analysis of the answers provided by schools with lower and higher index scores is provided in Figure 4.4 in Attachment 4. Schools with index scores of 5 or 6 (23% of the total) did a better job offering individualized
4. RQ 4: Availability of Teaching and Learning Materials
The objective of this section is to get a baseline sense of the existing instructional materials that are available to learners in the schools. The information below comes from the
classroom and school inventories, where the field data collectors were required to verify the existence of materials in Nepali, English, and any mother tongue. Overall there appear to be sufficient Nepali and English textbooks, but there is a dearth of mother-tongue textbooks (Figure II.4.1)
Figure II.4.1: Availability of language textbooks
0% 20% 40% 60% 80% 100%
Nepali Textbooks English Textbooks Mother Tongue Textbooks
None/Missing
Very few
Less than half
Half or just over half
Figure II.4.2 provides the distribution of responses teachers gave when asked the number one problem they have with their language textbooks. Just over half (51%) state that their main problem derives from the untimely delivery of the books or from their own lack of training in using the materials. These are reflective of system management challenges and are not related to the content of the materials. Only 12% of the teachers (the red shaded portion of the pie chart) indicated that the materials were in some way inappropriate and therefore not useable. Five percent of the teachers felt the materials were not grade-level appropriate.
Figure II.4.2: Suitability of existing language textbooks
Nevertheless, when asked how “useful” and how “appropriate” the teachers found the language textbooks, the majority were generally positive. Figure II.4.3 provides a breakdown of their responses.
Figure II.4.3: Opinion on textbook usefulness and appropriateness
Availability of supplemental reading materials.
15% 8% 51% 61% 33% 31% 0% 10% 20% 30% 40% 50% 60% 70% 80% 90% 100% Useful Appropriate Not at all Somewhat Useful/Appropriate Very useful/appropriate
Figure II.4.6: Teaching and learning materials index 0 5 10 15 20 25 30 0 1 2 3 4 5 6 7 8 9
About one-third of schools have a library (Figure II.4.4), but two-thirds do not. In those libraries the materials are for the most part level appropriate (i.e., for elementary school). Figure II.4.5 shows that 36% of classrooms have supplemental Nepali materials, 27% have supplemental materials in English, and almost none (1%) have them for any mother tongue. In all cases, the majority of schools do not have supplemental materials in any language.
Figure II.4.4: Schools with libraries
Figure II.4.5: Classrooms with
supplemental materials
Index of teaching and learning materials.5
The last index created to help summarize the survey results concerns the availability of teaching and learning
materials in schools. Whether students have Nepali, English, and mother-tongue textbooks or other materials and whether teachers have materials in different languages are summarized in this index. It also includes an item related to whether a school has a library with elementary-level materials and
classroom book corners or tin trunks. Figure II.4.6 shows that most schools scored in the range of 3 to 6 out of 10 on this index, with the average score being 4.2. No school scored higher than 8 out of 10.
5
See Attachment 4 for the list of items that comprise this index. 29.7% 4.6% 0% 20% 40% 60% 80% 100% Not Level-appropriate Level-appropriate materials 36% 27% 1% 0% 20% 40% 60% 80% 100%
Figure II.5.1: Schools by type Type I 43% Type II 31% Type III 26%
Figure 4.5 in Attachment 4 breaks down how schools with higher index scores differed from those with lower index scores. Almost all schools answered yes regarding the
availability of Nepali instructional materials. Schools with higher scores were those that also had mother-tongue materials, English language teacher guides, classroom book corners, and libraries with relevant grade-level books.
Summary conclusions. Apart from the near total absence of mother-tongue language or reading materials, most schools have decent supplies of language textbooks. Some schools (a minority) have additional materials (also often only in Nepali or English) to supplement the textbooks, but many schools do not. Two things are worth exploring further. First, is the extent to which the existing materials, in particular the textbooks, align with the elements of sound literacy skill building and reading instruction in the early grades. Second would be to determine whether the existing materials are being used in ways that maximize children’s exposure to print and opportunities to practice reading skills and reading.
5. RQ 5: Opportunities for mother-tongue-based multi-lingual education (MTB-MLE)
According to the 2011 Census, more than half of all Nepalese have a different mother tongue than Nepali. This section of the EMES-TOS explores how issues related to language manifest themselves at the school level. Data were gathered on the languages spoken at each school, on prevailing attitudes towards the language of instruction, and the capacity within the system to support mother-tongue learning.
The first question along these lines examines the degree of language heterogeneity in the G2 classrooms. The basis of this line of inquiry is found in the national EGR strategy, which outlines three types of schools:
• Type I: Almost all students have a reasonable understanding of Nepali when they join school (60%-70% estimated by MOE)
• Type II: Most students have no or a limited understanding of Nepali at the time of joining school AND almost all students have the same first language (mother tongue, or MT) (10%-15% estimated)
• Type III: Most students have no or a limited understanding of Nepali at the time of joining school AND students belong to 2 or more language groups (15%-20% estimated)
Figure II.5.1 breaks down the percentage of classrooms observed by type. Note this is more a representation of the
homogeneity of the classrooms than whether children have Nepali language skills coming into school (as G2, not G1 classrooms were observed). Schools were designated Type III if more than 10% of the children did not share the common MT in the classroom observed. This survey found a lower percentage of Type I
Figure II.5.2: Percentage of G2 students sharing language with G2 teacher Classrooms that share Nepali 42% Classrooms that share other MT 26% Classrooms not sharing 32%
schools and higher percentages of both Type II and III than the MOE’s estimates. Type I schools are where Nepali can easily be used as the medium of instruction. In Type II
classrooms, students share a mother tongue other than Nepali. Type III schools include more than one mother tongue language.
In addition, the study examined whether teachers and students are aligned in terms of their sharing of a common language. This is particularly important for those Type 2 schools that require a teacher to share the same mother tongue language in order to an implement MTB-MLE program.
Figure II.5.2 shows the proportion of grade 2 classrooms separated into three types:
• Type A: teachers that share Nepali language with students as the dominant mother tongue (42%)
• Type B: teachers that share a common MT with the majority of their students (26%)
• Type C: teachers that do not share the same
dominant mother tongue as the majority of the students in the classroom (32%)
The next question we asked is how many Type I, Type II, and Type III (from Figure E.1) classrooms are comprised of Type C classrooms (where teachers do not share the same language as the majority of the students) (from Figure E.2). Table II.1 summarizes the findings.
Table II.1: Proportion of schools where teachers and students not share dominant language, by school type
School by Type Percentage of schools that do not share common language between student and teacher
Type I 8%
Type II 25%
Type III 50%
Only 8% of Type I schools have teachers who are not native Nepali speakers like their students. In 25% of Type II schools, where students share a mother-tongue language (other than Nepali), the teacher does not speak that same mother tongue. And in 50% of the Type III schools, where there is more linguistic heterogeneity, the teacher does not speak the “dominant” (most widely spoken among the students) language.
The implication is that in the 40 to 50% of schools where Nepali is widely spoken, in 92% of the cases, the teacher can easily use Nepali as the medium of instruction. In 75% of the schools where another mother tongue is shared by the students, the teacher would be able to teach in that language. In the other 25%, this would not be the case, and teacher
reassignment or some other intervention would be necessary. Type III schools present the greatest challenge—more than one language is the mother tongue of the students—and in half the cases, teachers do not speak the language most commonly spoken by the students.
Attitudes toward MTB-MLE
The second line of inquiry related to language examines attitudes toward MTB-MLE
instruction. Table II.2 below shows three pairs of statements. Teachers were asked to choose the statement they agree with most. Teachers are evenly split in their belief regarding the language in which children should learn to read (first set of statements). But the majority appear to recognize the important role mother-tongue instruction could play, with a still significant number who do not.
Table II.2: Teacher belief statements related to mother-tongue instruction
Statement 1 Statement 2
All children should learn how to read in their mother tongue first.
51%
All children should learn how to read in Nepali first, regardless of their mother tongue.
49%
Teachers should try to speak the mother tongue of their pupils.
65%
Pupils should try to understand the language their teacher is using.
35%
It is easier for a child to learn how to read in his or her mother tongue.
65%
It makes no difference in which language a child learns how to read.
35%
In addition to asking teachers their points of view, several other stakeholders were given similar statements to either agree or disagree with. The results show that opinions tend to vary as to the appropriateness of an MTB-MLE program, Figures II.5.3 and II.5.4 below show that the closer to the school/community the respondent, the higher positive association with mother-tongue instruction.
Figure II.5.5: Percentage of districts with schools implementing MTB-MLE 0% 20% 40% 60% 80% 100% 50 to 100+ schools 20 to 30 schools 1 to 10 schools 0 schools Figure II.5.3: Attitudes of education
officers toward mother-tongue instruction
Figure II.5.4: Attitudes of parents toward mother tongue
Existing practices and capacities related to mother-tongue instruction of the districts.
According to Figure II.5.5 an estimated 40% of all districts do not have any schools
implementing MT. On the other hand, the other 60% of districts that do have schools
implementing mother tongue, it is usually being done in a handful of schools (more than half the districts with schools
implementing mother tongue are doing so in 1 to 10 schools). One district reported having 56
schools and another as many as 119 schools implementing mother tongue.
Figure II.5.6 shows the percentage of districts and RCs with the number of staff or trainers that have experience or training to develop mother tongue materials. For the districts and RCs with multiple staff with experience, it is not clear how deep or extensive that experience actually is. 0% 20% 40% 60% 80% 100% ETC DEO RP SMC HT
Statement: All children should learn first in their MT 0% 20% 40% 60% 80% 100% ETC DEO RP SMC HT
Statement: Most parents would prefer their children to learn first in their MT
Figure II.5.6: DEO staff and RC trainers with mother tongue experience in the districts
Although most of the districts appear to have some capacity to support local language development, there are very few roster trainers with experience at the RC level, and only a very small fraction (less than 5%) of teachers and head teachers claimed to have developed local language curriculum.
Summary conclusions. The challenges that the Ministry will face should it opt to implement an MTB-MLE program at scale are multi-fold. Principal of these is the heterogeneous environment of many of classrooms. Not only do a significant number of Type III schools exist, but the misalignment in half of them between teachers’ language and students’ languages presents an additional challenge. Overall, the system has adequate human resources to support an MTB-MLE, but capacity at the sub-district level and in schools will need to be strengthened. Further analysis of the dominant languages and the availability of materials and product development in those languages would be exceedingly useful, as would deeper examination of parental and societal attitudes toward MTB-MLE versus English as the medium of instruction for the early grades.
6. RQ 6: Capacity and Readiness of Existing Teacher Professional Development (TPD) System
This study examined three key areas relating to the provision of TPD: 1) the level of existing demand and perceptions of its effectiveness; 2) capability of the system in terms of its existing infrastructure and resources at each level; and 3) the level of follow-up, coaching, and supervision of teachers in the classroom. In short, the results yield the following conclusions.
• There are conflicting views on the participation and efficacy of TPD for language or reading instruction across each level of the system.
• TPD system capability and infrastructure is mostly adequate.
• Follow-up support and coaching for teachers are lacking and face significant constraints. 0% 20% 40% 60% 80% 100% None 1 to 10 11 to 20 21+
No. of RC roster trainers specialized or with experience in local language No. of DEO staff with experience developing local language
Demand for TPD in language and reading.
Figure II.6.1 reveals that although 30% of teachers have participated in TPD that included language/reading instruction, more than twice as many expressed demand for additional TPD in these areas. When asked if they could pick just one thing to help them become a better teacher, over 60% of teachers responded “more training or more professional support and mentoring.”
Figure II.6.1: Teacher participation and attitudes toward TPD
While it appears most teachers would desire more TPD, most head teachers, as depicted in Figure II.6.2, generally have a positive view of current TPD. Strikingly, the majority of head teachers (60%) believe their G2 teachers have already received adequate TPD in reading. Almost 70% believe they themselves have received adequate training to provide instructional leadership in reading. And nearly all have a positive view toward the quality of TPD provided by the RC.
Figure II.6.2: Head teacher attitudes toward TPD 0% 10% 20% 30% 40% 50% 60% 70% 80% 90% 100%
Participated in TPD for language Ever requested TPD for language
Suggest more training or professional support 13% 27% 9% 47% 41% 72% 0% 20% 40% 60% 80% 100%
TPD already received by teachers is adequate I have been adequately trained to provide coaching
and support
RC is effective TPD provider
Infrastructure, resource capability, and work practices of the TPD system. The thrust of this inquiry is three-fold: Do the TPD providers have adequate facilities and work practices; do they have the available human resources; and do they have established routine work practices to support a large scale teacher training program?
Table II.3: Work practices of TPD providers
District Education Offices % of Respondents
Percentage of DEOs that support TPD 81%
Planning and budgeting 81%
Roster selection and human resource management 77%
Monitoring and follow-up 81%
Resource Centers / Resource Persons % of Respondents Percentage of RCs with dedicated training facility 96%
Frequency of head teacher meetings to determine TPD needs
Once a month or more 77%
Once a term 13%
Once a year 10%
Frequency of head teacher meetings at RC for peer learning
Once a month or more 95%
Once a term 3%
Once a year 2%
The survey results in Table II.3 above are encouraging in that routine meetings between head teachers and RPs appear to be occurring regularly. RCs as well as ETCs appear to be
equipped to serve as the training venues for teachers and teacher trainers respectively (see Figure II.6.3).
Figure II.6.3: ETC facilities for training and boarding
Figure II.6.4 depicts the school-to-supervisor ratios for each of the thirteen districts surveyed. While this study did not survey enough districts in each ecobelt to obtain
representative results, anecdotally there appears to be a relationship worth examining more closely. 120 175 360 90 60 65 80 20 30 50 20 15 25 25 0 50 100 150 200 250 300 350 400
ETC 1 ETC 2 ETC 3 ETC 4 ETC 5 ETC 6 ETC 7 Training Capacity Boarding Capacity
The training to boarding capacity ratios break down as follows: ETC 1 = 6.0 ETC 2 = 5.8 ETC 3 = 7.2 ETC 4 = 4.5 ETC 5 = 4.0 ETC 6 = 2.6 ETC 7 = 3.2
Figure II.6.5: School:Nepal RT Specialist Ratios 0% 20% 40% 60% 80% 100% No RTs >0-15 >15-30 >30-45 >45+
Figure II.6.6: Teacher: RT Ratios
0% 20% 40% 60% 80% 100% >0-20 >20-30 >30-49 50 -75 >75+ Figure II.6.4: School to supervisor ratios of surveyed districts
Figure II.6.5 charts the ratio of all schools in an RC to all Nepali RT specialists in the RC across the 26 RCs surveyed. The ratio ranges are on the X-axis, and the weighted percentage (%) of RCs is on the Y-axis. Interestingly a weighted 12% of the RCs do not have any
specialized RTs in Nepali language instruction. Half of all RCs have 15-30 schools for every Nepali language RT specialist. Overall there are on average 25 schools for every Nepali language RT across the 26 districts surveyed. Of note, there is a positive correlation between the geographic size of the RC and the school:roster trainer ratio depicted in Figure II.6.5. Figure II.6.6 charts the ratio of all teachers in an RC to all available RTs in the RC. Overall there are on average 41 teachers for every available RT across the 26 districts. However in about 15% of the RCs the ratio is in the 50 to 75 range,
0 20 40 60 80 100 120 140 160 180 200 Baitadi Kavrepalanchowk Pyuthan Syangja Udaypur Sindhupalchowk Banke Chitwan Dhanusha Kanchanpur Morang Nawalparasi Bhaktapur Kathmandu Valley Terai Ecobelt Mountain Ecobelt Hill Ecobelt
and in another 5%, the ratio exceeds 75 teachers for every available RT.
Teacher monitoring, support, and supervisory practices. In terms of existing practice, Figure II.6.7 indicates how frequently teachers have reported classroom observations and compares this to the responses and expectations set out by head teachers, RPs, and DEOs.6 Of note, 12% of head teachers indicated it was not their responsibility to provide school-based teacher supervision and support to the G2 teacher.
Figure II.6.7: Frequencies of G2 classroom observation
The low frequency of RP and DEO visits to classrooms can be explained by the high schools-to-supervisor and -RP ratios. Over 80% of DEOs cited either ‘overloaded jobs of
supervisors’ or ‘insufficient incentives’ as the number one issue constraining school
supervisory visits. Amongst the RPs, not a single one reported having a government-issued motorbike or vehicle for conducting school visits.
Summary conclusions. While the systems, personnel, and facilities are generally in place to support a large-scale in-service training program, the readiness of the structures and
personnel below the district level (RCs, school clusters, etc.) are far more variable.
Substantial resources will need to be deployed to strengthen external monitoring and support of teachers. Without additional resources at the school-cluster level, school-based
supervision and coaching will need to be strengthened in order for teachers to receive the necessary support and feedback following any large-scale training effort. Additional research could investigate the existing content and structure of the TPD curriculum itself, especially in regard to the reading or language subject areas.
6
Responses of RPs and DEOs are more akin to goal statements than actual practices, as they were asked “for any one school in your [jurisdiction], how often on average will the school receive a visit from the [staff] in a given school year?”
Figure II.6.8: School proximity to DEO and DEO supervisory visits 0% 20% 40% 60% 80% 100% Never Once per year Twice per term Once a term Once a month
Exploring the data. Some additional questions raised relate to whether past participation in TPD has any relation to teaching phonics, whether school visits are tied to school proximity to district center (Figure II.6.8), and whether the frequency of head teachers’ supervision relates to the status of the teacher (Figure II.6.9).
In regard to the first question, there is no correlation found between those teachers participating in TPD and the teaching of phonics or phonemic awareness.
In regard to the second question, Figure II.6.8 shows that a school less than 25km away from the DEO has about a 75% chance of never receiving a visit, whereas a school 100+
kilometer (km) away has nearly a 100% chance of never receiving a visit during the school year. Given the
supervisor/school ratios noted above, the results are not terribly surprising. In regard to the third question, Figure II.6.9 shows the relationship between the frequency of reported lesson observations and teacher status. As is
evident, a permanent and local teacher is far less likely to have received a classroom observation from a head teacher or primary in-charge than a temporary teacher.
Figure II.6.9: Classroom observation by head teacher and teacher status
7. RQ 7: Teacher Motivation and Participation
This section of the study examines underlying teacher motivational factors, to what extent teachers are missing time from school, and possible factors influencing their levels of motivation. 0% 20% 40% 60% 80% 100%
Local Permanent Temporary
Never Once per year 1-2 x per term 1-2 x per month At least weekly
Factors affecting teacher motivation.
Figure II.7.1: Self-reported motivation for teaching
Figure II.7.1 shows that teachers generally reported being intrinsically motivated to become a teacher. Figures II.7.2 and II.7.3 indicate that about half the G2 teachers are assigned to their first choice in terms of grade-levels and subject preferences.
Figure II.7.2: Teacher subject preference
Figure II.7.3: Teacher grade preference
Figure II.7.4 indicates that few teachers are missing extended days from school, and Figure II.7.5 provides the reasons for those extended (2-plus week) absences.
Passion / calling 26% Enjoy teaching 37% Prestige in community 16% Best job available
7% Convenience to home 10% Job security 3% 80% of all teachers reported intrinsic motivational factors for teaching 0% 20% 40% 60% 80% 100%
English Nepali Math Science Social Other
0 20 40 60 80 100 Pre grade 1
Grade 1-3 Grade 4-5 Above grade 5
Figure II.7.4: Teacher
absenteeism in academic year
Figure II.7.5: Reasons reported for extended absence (2- plus weeks)
Is there a relationship between expressed motivation and absenteeism? The answer appears to be “yes”. Figure II.7.6 shows a slightly stronger relationship between those teachers with
reportedly “extrinsic” motivational factors and missed days.
Figure II.7.6: Relationship between motivation and teacher absenteeism
Can we detect any differences between teacher status and other indicators?
One of the questions raised early on by the Ministry of Education was whether issues of motivation or teaching practices differed between the types of teachers, particularly in relation to local teachers versus permanent or temporary teachers.
Another question raised by the MOE was whether there were any differences in how teachers teach based on the teacher’s gender, the classroom subject, or the classroom type (G 2, G 3 or multi-grade). Not missed school, 4% Less than 1 week, 56% 1-2 weeks, 34% plus 2 weeks, 5% Training, 1 Sickness, 5 Family issue, 3 Other, 2 0% 20% 40% 60% 80% 100% Passion/ Enjoy teaching Prestige Best job Convenience Job security
Not missed any days Less than 1 week 1-2 week 2 weeks plus
Extrinsic motivation -al factors Intrinsic motivation -al factors